impractical as a method of generation of tests for real, big. VLSI designs. To reduce ... Definition: Let us call an input pattern ti of a given gate G a functional fault if it ... such a region in the circuit that if the center of a defect of a given radius R is ...
Hierarchical Defect-Oriented Fault Simulation for Digital Circuits M.Blyzniuk1, T.Cibaková2, E.Gramatová2, W.Kuzmicz3, M.Lobur1, W.Pleskacz3, J.Raik4, R.Ubar4 1
State University "Lvivska Politechnika", 2Institute of Informatics, Bratislava, 3 Warsaw University of Technology, 4Tallinn Technical University
Abstract A new fault model is developed for estimation of the coverage of physical defects in digital circuits for given test sets. Based on this model, a new hierarchical defect oriented fault simulation method is proposed. At the higher level simulation we use the functional fault model, at the lower level we use the defect/fault relationships in the form of defect coverage table and the conditional defect probabilities. A description and the experimental data are given about probabilistic analysis of a complex CMOS gate. Analysis of the quality of 100% stuck-at fault test sets for two benchmark circuits in covering physical defects like internal shorts, stuck-open’s and stuck-on’s. It has been shown that in the worse case a test with 100% stuck-at fault coverage may have only 50% coverage for internal shorts in complex CMOS gates. It has been shown also that classical test coverage calculation based on counting of defects detected without taking into account the defect probabilities may lead to considerable overestimation of results.
1. Introduction Testing and diagnosis of digital systems have faced a lot of problems produced mainly by the complexity of systems. The efficiency of test generation (quality of tests, speed of test generation) is highly depending on the system description and fault models. Since traditional low-level test generation methods and tools for complex VLSI systems have lost their importance, other approaches based mainly on functional, behavioral, or hierarchical methods are gaining more and more popularity [1-2]. The advantage of hierarchical test generation approaches compared to the functional ones lies in the possibility of constructing test plans at higher functional levels, and modeling faults at lower levels. Conventional low level fault modeling methods use logic gate level representations of digital circuits and stuck-at-0/stuck-at-1 fault (SAF) model. On the other hand, the SAF model which has been rather popular in test quality estimating has not withstood the test of time.
It has been shown that high SAF coverage cannot quarantee high quality of testing, for example, for CMOS integrated circuits [3-5]. The reason is that the SAF model ignores the actual behaviour of digital circuits implemented as CMOS integrated circuits, and does not adequately represent the majority of real IC defects and failure mechanisms. Physical defects that may occur in real circuits often do not manifest themselves as stuck-at faults. Moreover, the types of faults that can be observed in a real gate depend not only on the logic function of the gate, but also on its physical design, i.e. layout of the gate. Although these facts are well known [4-7], in engineering practice they are ignored. Layout-based test generation techniques were proposed in the works of Nigh and Maly [6] and Jacomet and Guggenbuhl [7]. In both works the whole circuits having tens or hundreds of gates were analysed as single blocks. Such an approach allows to study differences between stuck-at model and functional model, but is computationally expensive and thus highly impractical as a method of generation of tests for real, big VLSI designs. To reduce computational complexity of layout analysis algortihms, Jacomet and Guggenbuhl introduced simplified analytic expressions for determination of the areas of the layout sensitive to defects. These expressions are good for long parallel conductive paths but do not seem to be sufficiently accurate for complex shapes inside standard cells and therefore do not solve the problem completely. In this work we do not follow the approaches of Nigh and Maly and Jacomet and Guggenbuhl. Our aim is to characterise faults in library cells, determine kinds of faults and their probabilities and then use this information for defect oriented fault simulation and test generation at higher levels of abstraction. This approach is based on the assumption that the majority of defects occur inside the cells and not in the routing between them. Such assumption would not be very realistic in the case of older CMOS technologies with two levels of metal and very dense routing. However, in stateof-the-art deep submicron technologies still only one or two levels are used inside cells but 6 or more levels of
metal are available for routing. Routing between the cells is less dense and various nodes are routed at various metal levels. As a result, probability of shorts outside cells is significantly reduced. There are also other differences between these two works and our work. The work of Nigh and Maly [6] concentrates on current testing. Jacomet and Guggenbuhl [7] consider traditional logic tests but assign fault types to physical defects in a rather arbitrary way. In our work we verify functionality of analysed gates for all possible defects and find the actual functions performed, using transistor-level simulation. This characterisation process may be computationally expensive, but it is performed only once for every library cell. To improve the test quality, there is a need to replace abstract fault models like SAF with realistic defect models. In this work we propose a methodology which allows to find the types of logic faults that may occur in a real circuit, to determine their probabilities of occurrence, to find input test patterns that detect these faults and to find the best sequence of patterns which allows to detect all faults and reduces the average length of the sequence of patterns to a minimum. We compare the results obtained in this way with the results of testing of the same circuits by the sequences of test patterns based on the conventional fault model. The paper is organized as follows. In Section 2 we present a new Functional Fault Model for describing physical defects in integrated circuits. In Section 3 we give a probabilistic analysis of defects and relate the defects to the Functional Fault Model. In Section 4 we propose a new hierarchical defect oriented fault simulation method. Sections 5 and 6 give a comparison of stuck-at fault coverage vs. defect coverages, correspondingly, for the complex and single gate cases. In Section 7 we draw final conclusions of this research.
2. Functional fault model In this Section we present a new general fault model for components of digital circuits called Functional Fault Model (FFM) which can be used for describing arbitrary physical defects that result in a violation of the logical function of the component. Consider a Boolean function y = f (x1, x2, …, xn) implemented by an embedded component in a digital circuit. Introduce a Boolean variable d for representing a given defect in the component or in the environment of the lead y, which affects the value y by converting the Boolean function f into another function: y = f d (x1, x2, …, xn, xn+1, … xp). Introduce now a generalized function y* = f*( x1, x2, …, xn, xn+1, … xp, d) = ¬d & f ∨ d & f d
which describes the behavior of the component simultaneously for both possible cases – for erroneous (d = 1) and nonerroneous (d = 0) cases. In other words, y* = f d if d = 1, and y* = f if d = 0. The solution of the Boolean differential equation Wd = ∂y* / ∂d = 1 describes the conditions (constraints) to be fulfilled in test generation for activating the fault d on a line labelled by the variable y. Definition: Let us call an input pattern ti of a given gate G a functional fault if it detects at the output of G at least one physical defect dj in the gate G. Some examples of such constraints for different faults (where SAF is a particular case) are given in Table 1 (here xk is the observable variable, and x’k is the variable at the previous time moment). Table 1. Fault conditions for different defects
No 1 2 3 4 5
Fault (defect) SAF xk ≡ 0 SAF xk ≡ 1 Short between xk and xl Exchange of lines xk and xl Delay fault on the line xk
Constraints xk = 1 xk = 0 xk = 1, xl = 0 xk = 1, xl = 0, or xk = 0, xl = 1 xk = 1, x’k = 0, or xk = 0, x’k = 1
For example, for the fault SAF xk ≡ 0 we have: y* =¬d & f ∨ d & f d =¬d & xk ∨ d & 0 Wd = ∂y* / ∂d = xk. The condition Wd = xk = 1means that in order to detect the fault SAF xk ≡ 0, we have to assign to the variable xk the value 1. As another example for the short between leads xk and xl we have y* =¬d & f ∨ d & f d =¬d & xk ∨ d & xk xl Wd = ∂y* / ∂d = xk¬ xl. The condition Wd = xk ¬ xl = 1 means that in order to detect on the lead xk the short between leads xk and xl, we have to assign to xk the value 1 and to xl the value 0. In such a way we should construct for each component of the circuit under test a list of defects d with logical constraints Wd (called functional faults). To calculate Wd, the needed erroneous Boolean functions are to be derived either analytically or experimentally.
3. Probabilistic functional fault model for CMOS gates In the following we consider one kind of physical defects in CMOS gates - shorts between conducting regions. This is one of the most important sources of faults in CMOS digital circuits. However, the
0.0015
0.001
0.0005
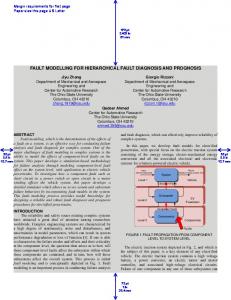
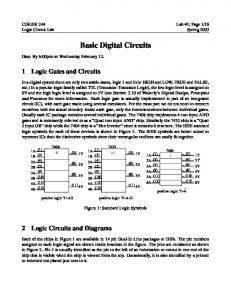
0 Not detectable not((B*C)*(A+D)) not((B*D)*(A+C)) B*(not(A)) B*(not(C*D)) not(A+(C*D)) not(C*D) not((A*C)*(B+D)) not((A*D)*(B+C)) A*(not(B)) A*(not(C*D)) not(B+(C*D)) not(A+B+D)+(C*(not((A*B)+D))) C*(not(A*B)) not(A*B) not(A+B+C)+(D*(not((A*B)+C))) D*(not(A*B)) not((A*B)+(B*C*D)+(A*C*D)) not((C*D)+(A*B*D)+(A*B*C)) SA1 at Q SA0 at Q
Probabilities of faults (arbitrary units)
methodology can be extended to other types of physical defects as well (e.g. breaks).
Functional faults (actual functions performed)
Fig.1. Functional faults in a AND2,2/NOR2 gate and their probabilities
A short is a piece of extra conducting material that connects a pair of separate conducting regions in the integrated circuit. This affects the connectivity of the circuit - two separate electrical nodes become connected. It is intuitively obvious that probabilities of shorts depend on the layout of the circuit. Conducting regions that are adjacent to one another are more susceptible to shorts than regions that are separated by a large distance. We assume that every defect that results in a short can be approximated by a circle. To estimate the probabilities of shorts between pairs of nodes we use the concept of critical area for shorts [5]. The critical region for shorts is such a region in the circuit that if the center of a defect of a given radius R is located anywhere inside the critical region, a short between two adjacent conducting regions occurs. The critical area is the area of the critical region. It depends on the shapes and locations of the conducting regions that can be shorted and is a function of the defect radius R. The radii of defects are random and can be characterised by a probability density function Pdf(R) which is specific for a given manufacturing process and given conducting layer. We assume that the probability of a short between a pair of conducting regions that correspond to a pair of electrical nodes is proportional to the critical area for these two regions. The critical area for shorts is a function Ps(R) of the defect radius R. Since the defect radii exhibit a random distribution, the product Pdf(R) * Ps(R) integrated over the range of R where Ps(R) > 0 can be
taken as the measure of the total probability of shorts between a given pair of nodes. Pt = ∫ Ps(R) Pdf(R) dR The first step in identification of logic faults and their probabilities is to calculate Pt for all pairs of conducting regions representing electrical nodes. If for a given pair Pt = 0, this pair of nodes cannot be shorted and is not taken into account. For the pairs that can be shorted the logic faults are determined. In simple cases this can be done by inspection of the circuit, for example it is obvious that a short between an output node and VDD results in “stuck-at-1” fault at this node. In more complex cases it may be necessary to simulate operation of the faulty circuit at the transistor level by SPICE. In our simulations shorts were represented by resistors. We tried several resistance values in the range from 0.01 ohm to 200 ohm. The gate behaviour at the logic level did not depend on this resistance. The waveforms obtained from the simulation allow to determine the actual logic function performed by the faulty circuit. In this way the functional faults that result from shorts are identified and their probabilities are determined. This procedure and the software developed for this purpose are described in more detail elsewhere [9]. In principle the faults and their probabilities could also be determined experimentally. This is, however, impractical for economic reasons. The frequency of occurence of faults in manufactured gates is extremely low (otherwise it would not be possible to manufacture VLSI chips with millions of gates). Therefore, it would be necessary to manufacture and test perhaps 108 to 1010 identical gates in order to gather statistically meaningful information. Fig.1 shows the distribution of the probabilities of various types of functional faults for a complex 4 input gate performing the AND2,2/NOR2 function. This gate is from an industrial standard cell library in 0.8 micron CMOS technology. Usually the most time consuming part of the characterisation process is the identification of the logical faults that correspond to shorts. If the number of possible shorts is large and operation of faulty cell is not obvious for most of them, it is necessary to perform many circuit simulations. This is time consuming and difficult to automate. Hence, the complexity of the characterisation process depends mainly on the number of physically possible shorts in the characterised cell and the complexity of the cell function. In practice it may take from several hours to several days to characterise a single cell. However, this process is performed only once for every library cell.
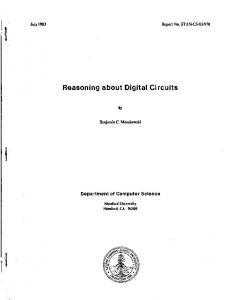
4. Multi-level functional fault simulation To reduce the amount of work for calculating the defect coverage by fault simulation we represent a system on three levels: defect, logical, and register transfer levels. The multi-level functional fault simulation is carried out as follows (see Fig. 2): • on the defect level we relate the physical defects of complex gates to the functional fault model by fixing which defects are detected by which input pattern of the gate; this information is stored in the library fault tables; • on the logical level we check if the functional faults of the given gate are activated and propagated to the output of the given module, and • on the RTL level we check if the erroneous signals caused by defects are propagated from the outputs of modules to an observable point of the system. Formally, if Y is the system variable representing an observable point of the system, yM is an output variable of a gate level module and yC is the output of a complex gate with a physical defect d, then the condition to detect the defect d on the observable test point Y of the system is Wd,Y = ∂Y/ ∂yM ∧ ∂ yM / ∂yG ∧ Wd = 1, where ∂Y/ ∂yM is the Boolean difference calculated by the high-level simulation, ∂yM / ∂yG is the Boolean difference calculated by the gate-level simulation, and Wd is the functional fault condition found by the complex gate preanalysis.
The step of high-level fault analysis in this fault simulation approach can be carried out by symbolic backtracing technique discussed in [10]. In this paper, a hierarchical two-level defect oriented fault simulation technique is proposed which consists of the following two steps: • gate-level stuck-at fault simulation with the goal of creating a fault table for stuck-at faults of a gate-level circuit, and • defect oriented functional fault simulation with the goal of fixing the subsets of defects detected in all the gates of the given circuit. On the first step, for a given module a fault table FT = tij is created for the stuck-at faults xj ≡ e, e ∈{0,1}at the outputs of complex gates gj, where an entry tij = e means that a test pattern Ti of the circuit detects the fault xj ≡ e, otherwise tij = X where X means don’t care. On the other hand, each entry tij ∈{0,1} in FT means that a functional fault ti of the gate gj is detected on its output xj. On the second step, for each tij in the fault table FT, a subset of defects Dg,j(ti) ⊂ Dg,j will be fixed for the gate gj detected by the test pattern Ti by the following operation: Dg,j(ti) = {dj | j: dij = 1 & , ti ⊂ Ti }, where ti ⊂ Ti means that the test pattern Ti includes the input pattern ti of the gate gj. The described multi-level functional fault simulation was used for estimating the quality of 100% stuck-at test patterns in detecting physical defects in CMOS gates.
5. The quality of stuck-at fault tests Functional fault activated
Defect High-level simulation
d
Physical defect analysis
yG
Complex gate
Functional fault detected
yM
Y
High-level fault analysis
Gate-level simulation
Module
Gate-level fault analysis
System Fig. 2. Hierarchical defect oriented fault simulation
The relationships between the functional faults ti and the defects dj for all the gates g in the library L are given by defect tables DTg = dij , g ∈ L, where an entry dij = 1 means that the input pattern ti of the gate detects the defect dj , otherwise dij = 0. Let Dg be a set of defects in the gate g ∈ L. Then for each gate g ∈ L we create a set of probabilities Pg where each entry pj ∈ Pg means the conditional probability of a defect dj ∈ Dg in the condition that a defect is present in the system under test.
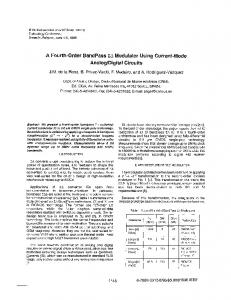
To compare the quality of 100% stuck-at test sets in relation to physical CMOS defects we used the data of probabilistic analysis of the AND2,2/NOR2 gate. Let D be a set of physical defects under consideration. In Table 2, 20 defects d ∈ D in the gate like shorts are listed together with the erroneous functions f d . A,B,C,D are inputs of the gate, Q is the output and N9 is an internal node of the gate. All the defects covered by each input pattern of the gate are marked by 1. To calculate the probabilistic defect coverage we use the conditional defect probabilities pi (Table 2) for each defect di (the probability of a particular defect di in condition that a defect from D is present), which are calculated as
pi = Pi
20
∑P. i =1
i
We generated two test sets Tmin = {0101,1010,1011, 1110} and Tmax = {0101,1010,0011,1100} which both give a 100% stuck-at fault coverage. On the other hand, Tmin gives only 50.4% in relation to the defect set D (the defects d7, d17, d18 remain not detected) whereas the test Tmax guarantees 100% coverage also for the defect set D.
Table 2. Conditional probabilities of defects in the complex gate AND2,2/NOR2 and the fault table i
Fault di
Erroneous function f di
pi
1 2 3 4 5 6 7 8 9 10 11 12 13 14 15 16 17 18 19 20
B/C B/D B/N9 B/Q B/VDD B/VSS A/C A/D A/N9 A/Q A/VDD C/N9 C/Q C/VSS D/N9 D/Q N9/Q N9/VDD Q/VDD Q/VSS
not((B*C)*(A+D)) not((B*D)*(A+C)) B*(not(A)) B*(not(C*D)) not(A+(C*D)) not(C*D) not((A*C)*(B+D)) not((A*D)*(B+C)) A*(not(B)) A*(not(C*D)) not(B+(C*D)) not(A+B+D)+(C*(not((A*B)+D))) C*(not(A*B)) not(A*B) not(A+B+C)+(D*(not((A*B)+C))) D*(not(A*B)) not((A*B)+(B*C*D)+(A*C*D)) not((C*D)+(A*B*D)+(A*B*C)) SA1 at Q SA0 at Q
0.010307065 0.000858922 0.043375564 0.007515568 0.001717844 0.035645265 0.098990767 0.013098561 0.038651492 0.025982392 0.000214731 0.020399399 0.033927421 0.005153532 0.007730298 0.149452437 0.143654713 0.253382006 0.014386944 0.095555078
For investigation of the correlation between fault coverages for stuck-at faults and the defects in D, we created two benchmark circuits C1 and C2 – both, treelike combinational networks, the first with 2-levels (5 complex gates, 16 inputs, 100 defects) and the second with 3-levels (21 complex gates, 64 inputs, 420 defects). Both circuits were simulated for two tests Tmin (optimized test: 8 patterns for C1, and 16 patterns for C2) and Tmax (not optimized test: 19 patterns for C1, and 70 patterns for C2) which both had 100% coverage for stuck-at faults. Simulation was carried out hierarchically in two steps. At first, at the higher level, for each complex gate the functional fault coverage was calculated. Then, at the lower level, the real defect coverage for the whole circuit, based on functional fault coverages for components and on the data in Table 2 was calculated. The results are depicted in Table 3. Table 3. Defect coverage for circuits C1 and C2 Circuit Probabilistic Denumerable defect coverage, % defect coverage, % Tmin Tmax Tmin Tmax C1 66,68 72,01 81,00 83,00 C2 70,99 77,05 84,29 84,76
From the experiments we can do the following preliminary conclusions: • the difference between stuck-at fault and physical defect coverages reduces when the complexity of the circuit increases, and • the difference between stuck-at fault and physical defect coverages is higher when the defect probabilities are taken into account compared to the
Input patterns tj 0 1 2 3 4
�� ��
5
6
1 1 1 1
1 1
1
1 1
1 1
1 1 1 1
1
1 1
1
1
8
9
10 11 12 13 14 15
1 1 1 1 1 1 1
1 1 1 1 1
1 1
1 1 1
1 1
1
1 1
1 1
1
1
1 1
1
1
1
1
1 1
1
1
1
1 1
1 1 1 1
1 1
1 1 1 1
1 1
1 1
�� � ��� �� �� ��
7
1
1 1
1
1
1
traditional method where all faults are assumed to have the same probability.
6. Stuck-open and stuck-on defects The problem of „stuck-at faults versus physical defects in CMOS circuits” is investigated now for a larger set of defects at the 2-input basic gates level using classical voltage and also IDDQ testing. Algorithms for defect coverage computation and real defect localization are based on the analysis of the list of undetected functional faults (“fault conditions”) and a list of detected functional faults for the circuit over the selected defect library. The algorithms are parts of the ATPG system named DefGen for combined IDDQ-voltage testing of combinational circuits [11-13]. It can run for an arbitrary “fault conditions library” for basic gates (NAND, AND, OR, NOR, XOR, EXNOR, NOT, BUFF). The defect library used in the experiments consists of the following transistor level defects: • stuck-at faults; stuck-open’s, stuck-on faults of the p-, n- type of transistors • transistor shorts (intra-gate shorts) – the transistor short model considers shorts between four terminals of a transistor: source (s), drain (d), gate (g), bulk (b). Six such shorts are used for every transistor inside every basic gate. The results of defect detection are based on electrical simulation for every basic gate using voltage and current measurements. Then two tables of defect libraries are created - the first one for classical voltage testing and the second one for the IDDQ testing.
The first example to be investigated was a simple circuit consisting of three basic gates: NAND2, NOR2 and BUFF, and implementing the function: y = ¬(¬(x1∧x2) ∨ x3) The list of defects consists of 60 items. A test set with 100% stuck-at fault coverage was investigated by defect localization algorithm using the specified defect library for voltage testing. The fault coverage of only 66.67% was achieved for the mentioned 60 defects. This coverage can not be increased if the exhaustive test set is used for gates NAND2 and NOR2. The following types of defects can not be covered by this test set: • NAND2: stuck-open for p1, p2 transistors, stuck-on for p1, p2, n1, n2 transistors; • NOR2: stuck-open for p1, p2, n1, n2 transistors, stuck-on for p1, p2, n1, n2 transistors; • BUFF: stuck-open for p1, p2 transistors, stuck-on for p1, p2, n1, n2 transistors. Next, the experiments were focused to combined voltage and IDDQ testing where both defect libraries have been analysed (for IDDQ and voltage testing). The defect coverage was increased to 86,67%, but the following types of defects can not be covered by this test: • NAND2: stuck-open for p1, p2 transistors; • NOR2: stuck-open for p1, p2 transistors, stuck-on for n1, n2 transistors; • BUFF: stuck-open for p1, p2 transistors. Both, current and voltage defect libraries have to be analysed, and both types of testing (IDDQ and voltage) have to be applied to the tested circuit. Table 4. Defect coverage data for circuits C1 and C2, based on the complex gate Circuit C1 C2
Only voltage testing, % 66,83 66,59
IDDQ & voltage testing, %
87,32 87,07
In Table 4, the real physical defect coverages of 100% stuck-at fault tests for circuits C1 and C2 are given. The experiments not only confirm the generally believed fact about the defficiency of SAF model, they also represent a quantitative solution to show how low may be the real defect coverage of a test with 100% SAF coverage.
Conclusions A new Functional Fault Model and a hierarchical physical defect oriented fault simulation method were developed for calculating the real physical defect coverage for given test sets. In this method, at the higher level we use the developed functional fault model, and at the lower level we use the defect/fault relationships in the form of defect coverage table and the conditional probabilities of defects.
A probabilistic analysis of CMOS physical defects like internal shorts, stuck-open’s and stuck-on’s has been carried out for generating input data for stuck-at test quality estimation. It has been shown that in the worse case a test with 100% stuck-at fault coverage may have only 50% coverage for internal shorts in complex CMOS gates. It has been shown also that classical test coverage calculation based on simply counting of defects detected without taking into account the defect probabilities may lead to considerable overestimation of the real quality of test sets for CMOS circuits.
Acknowledgements This work has been supported by the EC project INCOCOPERNICUS 977133 - VILAB “Microelectronics Virtual Laboratory for Cooperation in Research and Knowledge Transfer”, by the Estonian Science Foundation grant G4300, by the Slovak VEGA 2/6091/99 project and by the Polish State Committee for Scientific Research grant for international cooperation with Ukraine.
References [1] S.R.Rao, B.Y.Pan, J.R.Armstrong. Hierarchical Test Generation for VHDL Behavioral Models. Proc. EDAC, Feb. 1993, pp. 175-183. [2] E.M.Rudnick, R.Vietti, A.Ellis, F.Corno, P.Prinetto, M.Sonza Reorda, "Fast sequential circuit test generation using high-level and gate-level techniques", Proc. of DATE, 1998. [3] J.M. Soden, C.F. Hawkins. Quality Testing Requires Quality Thinking. Proc. Int. Test Conference, 1993,pp. 596. [4] W.Maly, J.P.Shen, J.Ferguson, “System. Characterization of Physical Defects for Fault Analysis of MOS IC Cells”, Proc. 1984 ITC, pp. 390-399, Philadelphia, 1984. [5] J.P.Shen, W.Maly, J.Ferguson, “Inductive Fault Analysis of MOS ICs”, IEEE Design&Test, pp.13-26, 1985. [6] P.Nigh and W.Maly, “Layout - Driven Test Generation”,Proc.1989 ICCAD, pp. 154-157, 1989. [7] M.Jacomet, W.Guggenbuhl, “Layout-Dependent Fault Analysis and Test Synthesis for CMOS Circuits”, IEEE Trans. on CAD, vol. 12, pp. 888-899, 1993. [8] W.Maly, “Modeling of Litography-Related Yield Losses for CAD in VLSI Circuits”, IEEE Trans. on CAD, vol. CAD4, pp.166-177, 1985. [9] M.Blyzniuk, W.Pleskacz, M.Lobur, W.Kuzmicz ”Estim. of Probability of Different Functional Faults Caused by Spot Defects in VLSI Circuits”, Proc. TCSET 2000 Conf., Slavsko, Ukraine, 2000. [10] A. Benso, P.Prinetto, M.Rebaudengo, M.Sonza, R.Ubar. A New Approach to Build a Low-Level Malicious Fault List. IEEE European Design&Test Conf., Paris, March 17-20, 1997. [11] E.Gramatová, A.Somorovská, J.Gašpar, H.Manhaeve: “Test Pattern Generation System for IDDQ-Voltage Test Experiments”, Proc. of ETW’98, pp.193-194, 1998. [12] E.Gramatová, A.Somorovská, J.Gašpar, H.Manhaeve: “Test Pattern Generation for IDDQ Voltage Testing Based on Fault Simulation”, Proc. of DDECS’98, pp.265-268, 1998. �>��@� (�*UDPDWRYi�� -�� %HþNRYi� -�*DãSDU�� ³'HIHFW� 2ULHQWHG
TPG for combined IDDQ - Voltage Testing of Combinational Circuits”, Proc. of Fast abstracts EDCC-3, 1999.