University of Louisiana at Lafayette. In Partial ... 2.2.4 Dynamic Connections versus Temporal Binding . ...... hippocampus (Minai and Levy, 1993, 1994).
Hierarchical Learning of Conjunctive Concepts in Spiking Neural Networks
A Dissertation Presented to the Graduate Faculty of the University of Louisiana at Lafayette In Partial Fulfillment of the Requirements for the Degree Doctor of Philosophy
Cengiz Günay Fall 2003
c Cengiz Günay
2003 All Rights Reserved
Hierarchical Learning of Conjunctive Concepts in Spiking Neural Networks Cengiz Günay
APPROVED:
Anthony S. Maida, Chair Associate Professor of Computer Science
István S. N. Berkeley Associate Professor of Philosophy
Vijay V. Raghavan Distinguished Professor of Computer Science
William R. Edwards Associate Professor of Computer Science
C. E. Palmer Dean of the Graduate School
Dedicated to my parents Jenny and Tarhan Günay.
Acknowledgments This research is partially funded by the University Doctoral Fellowship of the University of Louisiana at Lafayette (ULL). I wish to express my gratitude to my advisor Dr. Anthony Maida for the direction and support throughout the research. Special thanks go to Prashant Joshi, Ben Rowland, and Dr. István Berkeley for stimulating discussions, and comments and suggestions on previous drafts of this work. I also appreciate the time and effort put in by my other dissertation committee members, Drs. Vijay Raghavan and William Edwards. The Graduate School of ULL has been very helpful to me during my studies, for which I want to especially thank Ms. Nancy Strodtman. Last, but not least, I would like to thank my dear friend Anca Doloc-Mihu for the many things she did that helped me prepare this dissertation. This document is prepared using the LYX LYX document preparation system (Ettrich et al., 2003) which uses the LATEX 2ε typesetting language (Lamport, 1994). LYX is copyrighted by Matthias Ettrich and covered by the terms of the GNU General Public License (GPL), and LATEX 2ε is copyrighted by D. E. Knuth and the Free Software Foundation, Inc. and is covered by both the TEX copyright and the GNU GPL. The JAVA language is a trademark of Sun Microsystems. Other copyrighted material cited in this work is covered by their respective copyright holders. The author can be reached at the address .
v
Contents ACKNOWLEDGMENTS
v
ABBREVIATIONS
x
1
2
Introduction 1.1 The Neuroidal Model . . . . . . . . . . . . . . . . . . . . . . . 1.2 Temporal Binding . . . . . . . . . . . . . . . . . . . . . . . . . 1.2.1 Why Recruitment Learning? . . . . . . . . . . . . . . . 1.2.2 Spike Timing: Tolerance and Segregation . . . . . . . . 1.2.3 Psychological and Neuroscientific Theory and Evidence 1.2.4 Phase Segregation . . . . . . . . . . . . . . . . . . . . 1.3 Instability in Hierarchical Recruitment . . . . . . . . . . . . . . 1.4 Overview . . . . . . . . . . . . . . . . . . . . . . . . . . . . .
. . . . . . . .
. . . . . . . .
. . . . . . . .
. . . . . . . .
. . . . . . . .
. . . . . . . .
. . . . . . . .
. . . . . . . .
1 3 5 6 8 11 12 13 14
Background 2.1 Brief History of the Neural Network Field . . . . . . . . 2.1.1 Classical Artificial Neural Networks . . . . . . . 2.1.2 Localist versus Distributed Representations . . . 2.1.3 Spiking Neurons . . . . . . . . . . . . . . . . . 2.2 Representation, Composition and the Binding Problem . 2.2.1 The Variable Binding Problem . . . . . . . . . . 2.2.2 The Binding Problem . . . . . . . . . . . . . . . 2.2.3 Temporal Binding . . . . . . . . . . . . . . . . 2.2.4 Dynamic Connections versus Temporal Binding . 2.2.5 Discussion . . . . . . . . . . . . . . . . . . . . 2.3 Learning and Reasoning . . . . . . . . . . . . . . . . . 2.3.1 Learning . . . . . . . . . . . . . . . . . . . . . 2.3.2 Reasoning . . . . . . . . . . . . . . . . . . . . . 2.4 Our Approach . . . . . . . . . . . . . . . . . . . . . . .
. . . . . . . . . . . . . .
. . . . . . . . . . . . . .
. . . . . . . . . . . . . .
. . . . . . . . . . . . . .
. . . . . . . . . . . . . .
. . . . . . . . . . . . . .
. . . . . . . . . . . . . .
. . . . . . . . . . . . . .
17 18 18 21 24 26 28 31 33 35 43 45 46 52 56
vi
. . . . . . . . . . . . . .
. . . . . . . . . . . . . .
. . . . . . . . . . . . . .
. . . . . . . . . . . . . .
CONTENTS 3
4
5
Recruitment Learning with the Neuroidal Network 3.1 Introduction . . . . . . . . . . . . . . . . . . . . . 3.1.1 What is Recruitment Learning? . . . . . . 3.1.2 A Neuroidal Architecture . . . . . . . . . 3.1.3 Structural Organization . . . . . . . . . . 3.1.4 Redundant Localist Representations . . . . 3.1.5 Recruitment Depends on Temporal Binding 3.1.6 How Recruitment Works . . . . . . . . . . 3.1.7 Tracing State Transitions . . . . . . . . . 3.1.8 Robust Hierarchical Recruitment . . . . . 3.2 Definitions and the Spiking Neuron Model . . . . . 3.2.1 The Spike Response Model . . . . . . . . 3.2.2 Pros and Cons of Using a Spiking Model . 3.3 Simulator Software and Tools Used . . . . . . . .
. . . . . . . . . . . . .
. . . . . . . . . . . . .
. . . . . . . . . . . . .
. . . . . . . . . . . . .
. . . . . . . . . . . . .
. . . . . . . . . . . . .
. . . . . . . . . . . . .
. . . . . . . . . . . . .
. . . . . . . . . . . . .
. . . . . . . . . . . . .
. . . . . . . . . . . . .
Robust Recruitment over Delayed Lines 4.1 Timing Issues in Recruitment . . . . . . . . . . . . . . . . . . . . . . 4.1.1 Timing in Hierarchical Learning . . . . . . . . . . . . . . . . . 4.1.2 Delays in Converging Direct/Indirect Pathways . . . . . . . . . 4.1.3 Detecting Temporally Separate Coincidences . . . . . . . . . . 4.1.4 Defining Peripherals for Timing with Delays . . . . . . . . . . 4.2 Defining Measures of Tolerance and Segregation . . . . . . . . . . . . 4.2.1 Implementing with a Continuous-time Model . . . . . . . . . . 4.2.2 Phase Segregation . . . . . . . . . . . . . . . . . . . . . . . . 4.2.3 State Machine for Continuous-Time Neuroids . . . . . . . . . 4.3 Methods and Results . . . . . . . . . . . . . . . . . . . . . . . . . . . 4.3.1 Testbeds for Observing Timings . . . . . . . . . . . . . . . . . 4.3.2 Behavior of the Inputs and Concepts . . . . . . . . . . . . . . 4.3.3 Intuitions on Tolerance Window Parameter from the Simulations 4.3.4 Quantitative Results . . . . . . . . . . . . . . . . . . . . . . . 4.3.5 Discussion . . . . . . . . . . . . . . . . . . . . . . . . . . . . 4.4 Chapter Conclusions and Future Work . . . . . . . . . . . . . . . . . . 4.4.1 Chapter Conclusions . . . . . . . . . . . . . . . . . . . . . . . 4.4.2 Chapter Future Work . . . . . . . . . . . . . . . . . . . . . . .
. . . . . . . . . . . . .
. . . . . . . . . . . . . . . . . .
. . . . . . . . . . . . .
. . . . . . . . . . . . . . . . . .
. . . . . . . . . . . . .
. . . . . . . . . . . . . . . . . .
. . . . . . . . . . . . .
58 58 58 59 62 63 63 64 66 67 70 70 71 72
. . . . . . . . . . . . . . . . . .
74 74 74 76 77 79 81 82 86 89 90 92 94 96 98 102 110 110 111
A Stochastic Population Approach to the Problem of Stable Recruitment Hierarchies 112 5.1 Introduction . . . . . . . . . . . . . . . . . . . . . . . . . . . . . . . . . . . . 112 5.2 Related Work . . . . . . . . . . . . . . . . . . . . . . . . . . . . . . . . . . . 115 5.2.1 Relation to Winner-Take-All Mechanisms . . . . . . . . . . . . . . . . 116
vii
CONTENTS 5.3 5.4
5.5
5.6 6
The Model Framework . . . . . . . . . . . . . . . . . . The Monopolar Synaptic Population Model . . . . . . . 5.4.1 The Open-loop Characteristics . . . . . . . . . 5.4.2 The Closed-loop System with Negative Feedback 5.4.3 Instantaneous Feedback Condition . . . . . . . . 5.4.4 Fixed-Delay Feedback Condition . . . . . . . . The Dipolar Synaptic Population Model . . . . . . . . . 5.5.1 Non-Rectified Model . . . . . . . . . . . . . . . 5.5.2 Oscillations in Activity Levels . . . . . . . . . . 5.5.3 A Decaying Inhibitory Synapse Population . . . 5.5.4 Lateral Excitatory Feedback . . . . . . . . . . . 5.5.5 Low-Pass Filter . . . . . . . . . . . . . . . . . 5.5.6 Discussion . . . . . . . . . . . . . . . . . . . . Chapter Conclusions . . . . . . . . . . . . . . . . . . .
. . . . . . . . . . . . . . . . . . . . . . . . . . . . . . . . . . . . . . . . . . . . . . . . . . . . . . .
. . . . . . . . . . . . . .
. . . . . . . . . . . . . .
. . . . . . . . . . . . . .
. . . . . . . . . . . . . .
. . . . . . . . . . . . . .
. . . . . . . . . . . . . .
. . . . . . . . . . . . . .
. . . . . . . . . . . . . .
Summary of Conclusions
118 122 124 126 128 131 132 134 139 139 141 143 144 147 150
A Formal Definitions A.1 Neuroidal Network Model . . . . . . . . . . . . . . . . . . . . . . . . . . . A.1.1 Scalars and Sets . . . . . . . . . . . . . . . . . . . . . . . . . . . . A.1.2 Functions . . . . . . . . . . . . . . . . . . . . . . . . . . . . . . . . A.1.3 The Area . . . . . . . . . . . . . . . . . . . . . . . . . . . . . . . . A.1.4 The Network . . . . . . . . . . . . . . . . . . . . . . . . . . . . . . A.2 Derivation of Probability of Connection in Random Multipartite Graphs . . . A.2.1 Probability of Merging Connections from Different Areas . . . . . . A.2.2 Connection Probability in the Generalized Recruitment Scenario . . A.2.3 A More Realistic Probability Calculation for the Dipolar Model . . . A.3 Time-to-spike Shortens if Membrane Time Constant is Increased by Only Varying the Resistance . . . . . . . . . . . . . . . . . . . . . . . . . . . . . . . A.4 Solution to (5.12) in the Monopolar Synaptic Population Model . . . . . . . A.4.1 The Lipschitz Condition . . . . . . . . . . . . . . . . . . . . . . . . B Simulator Software Design B.1 Software Components . . . . . . . . . B.1.1 The Synapse Object . . . . . B.1.2 The Neuroid Object ni . . . B.1.3 The Neuroid.Mode Object si B.1.4 The AxonArbor Object . . . . B.1.5 The Area Object Gy . . . . . ˜ . . . . B.1.6 The Network Object G
viii
. . . . . . .
. . . . . . .
. . . . . . .
. . . . . . .
. . . . . . .
. . . . . . .
. . . . . . .
. . . . . . .
. . . . . . .
. . . . . . .
. . . . . . .
. . . . . . .
. . . . . . .
. . . . . . .
. . . . . . .
. . . . . . .
. . . . . . .
. . . . . . .
. . . . . . .
. . . . . . .
. . . . . . . . .
154 154 154 156 156 156 156 159 161 162
. 163 . 170 . 171
. . . . . . .
173 173 176 176 177 177 177 178
CONTENTS B.1.7 The Peripheral Object . . . . . . . . . . . . . . . . . . . . . . B.2 A Simulator Interface Design Inspired by the Program Debugger Paradigm B.2.1 Command Interface by Accepting Source Level Text Input . . . . . B.2.2 Design Requirements of the Interface . . . . . . . . . . . . . . . . C Algorithms on Neuroids C.1 Unsupervised Training . . . . . . . . . . . . . . . . . . . . . . . . C.1.1 Unsupervised Memorization – UM . . . . . . . . . . . . . C.1.2 Unsupervised Memorization of Timed Conjunctions – UMT C.2 Supervised Training . . . . . . . . . . . . . . . . . . . . . . . . . . C.2.1 Supervised Memorization—SM . . . . . . . . . . . . . . . C.2.2 Supervised Inductive Learning—SL . . . . . . . . . . . . .
. . . . . .
. . . . . .
. . . . . .
. . . . . .
. . . .
. . . . . .
. . . .
179 179 182 183
. . . . . .
188 189 190 191 197 197 197
D Supplemental Compact Disc
199
INDEX
200
BIBLIOGRAPHY
208
ABSTRACT
227
BIOGRAPHICAL SKETCH
228
ix
Abbreviations AI
Artificial Intelligence
ANN
Artificial Neural Network
AP
Action Potential
EPSP
Excitatory Post-Synaptic Potential
FSM
Finite State Machine
I/F
Integrate-and-Fire
LSM
Liquid State Machine
LTD
Long Term Depression
LTG
Linear Threshold Gate
LTP
Long Term Potentiation
NTR
Neuroidal Tabula Rasa (The Blank Slate)
PAC
Probably Approximately Correct
PE
Processing Element
PNN
Pulsed Neural Network
RMI
JAVA Remote Method Invocation
SRM
Spike Response Model
TCH
Temporal Correlation Hypothesis
x
CONTENTS WTA
Winner-Take-All
xi
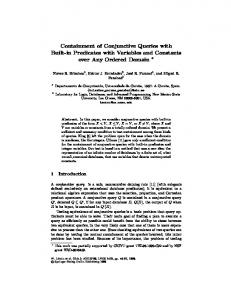
Chapter 1 Introduction The subject of this research is a computational system, the neuroidal network, originally described by Valiant (1988, 1994, 2000a). Valiant’s model describes a symbol processing framework for constructing an artificial intelligence (AI) system that is loosely consistent with the known organization of the brain. It combines the accumulated knowledge in the cognitive science field along with theoretical computer science methods and previous artificial neural network (ANN) models. It is an architecture for cognition in the sense of Anderson (1983) and Newell (1990), since it aims to simulate the human cognitive system. Valiant’s work, however, has not been refined to the implementation level. The neuroidal model inherits ideas from connectionist models of Feldman (1982). The model consists of a simple random graph where each node has a linear threshold gate (LTG), and a finite state machine (FSM) as seen in Figure 1.1. The nodes of the graph are initially unallocated, the network being a blank slate. As new information is input to the system, redundant sets of nodes are recruited to represent each item. This recruitment learning property is an important feature of this random graph model (Wickelgren, 1979; Feldman, 1982; Valiant, 1994). Recruitment of new nodes depends on simultaneous presentation of 1
CHAPTER 1. INTRODUCTION
NTR (a) The randomly connected directed graph
T =∞ Initial State
A
T =p p≥2
M
Memorized State
T : threshold p T o(k) = 0 o/w
Net input Threshold condition
wn
Figure 2.1: The McCulloch-Pitts neuron, or the LTG. 2.1
Brief History of the Neural Network Field
2.1.1
Classical Artificial Neural Networks
Artificial neural networks (ANNs) or connectionist networks are mathematical models inspired by the elements of the mammalian central nervous system. The now ‘classical’ ANNs were first proposed by McCulloch and Pitts (1943), intended to capture a logical abstraction of the nervous system. These networks of simple discrete processing elements were proven to be capable of universal computation. Their processing elements are widely known as McCulloch-Pitts neurons, or linear threshold gates (LTGs), seen in Figure 2.1. The inputs and output of an LTG are binary and the function of the gate is to indicate if the weighted sum of its inputs exceeds a threshold. In a recent classification by Maass (1997), LTGs are referred to as first generation neural networks. The first learning scheme for neural systems in general was proposed by Hebb (1949). Commonly named the Hebbian learning rule, it is a data-driven (unsupervised) learning scheme that prescribes that the connection strength between two neurons should be strengthened if the firing of the upstream neuron causes the firing of the downstream neuron. Even though the description of the Hebbian plasticity rule was not completely formalized, the
18
CHAPTER 2. BACKGROUND
Outputs ··· ··· ··· Inputs Figure 2.2: A two layer feed-forward perceptron network. idea inspired some of the first mathematical learning rules, and later formed the basis of a statistical learning scheme leading to the seminal work of Hopfield (1982). A practical application of McCulloch-Pitts neural networks was introduced with the invention of the powerful perceptron learning algorithm by Rosenblatt (1958). Rosenblatt’s trainable perceptron network has a special form where layers of processing units are connected in feed-forward fashion as seen in Figure 2.2. Rosenblatt described a supervised learning1 algorithm, which is consistent with Hebb’s ideas, to find proper weights for a single layer perceptron network in order to achieve a desired output. In contrast with the binary values at the inputs and output of a binary LTG, a perceptron employs continuous values, which may be interpreted as indicating the average firing rate of a biological neuron, or a firing probability. Independently, at about the same time, Widrow and Hoff (1960) proposed a similar learning rule to that of perceptrons. At this point in the history of neural network research, Minsky and Papert (1969) presented a seminally important critical argument describing the limitations of Rosenblatt’s 1
Supervised learning means there is a teacher correcting the outputs of the network at each step, as opposed to unsupervised learning which lacks such a teacher and simply learns the statistical correlations in the input patterns presented to the network.
19
CHAPTER 2. BACKGROUND learning algorithm for single layer perceptrons. Even though the perceptron learning algorithm is proven to train a single layer perceptron network, it is limited by the computing power of the device. Minsky and Papert showed that a single layer perceptron fails to classify the inputs of an exclusive-or (XOR) function, because the XOR function is linearly inseparable. A perceptron network with more layers can overcome this limitation and it is capable of universal computation, however there was no learning algorithm for training multi-layer perceptron networks at the time. It is believed that Minsky and Papert’s critical report has mostly suspended neural network research for about two decades. This report created two fronts in the scientific community, one of supporters of the symbolic AI approach and one of supporters of neural nets. Interestingly, it turns out that Minsky and Papert’s criticisms were only limited in scope, and that they did not intend to create such a separation in the AI community (Berkeley, 1997). Researchers in the AI community now agree that the symbolical and neural approaches complement each other rather than contradict (Nilsson, 1998). Recent advances in hybrid neural systems which bring together the strengths of the two approaches further support this view (Wermter and Sun, 2000a). However, during this time of slow progress there was important work on neural networks as memory devices (Anderson, 1972; Kohonen, 1972) and on their self-organization property (Grossberg, 1976). The research was revived with two important events. First, Hopfield (1982) proposed a model using statistical mechanics to describe a certain class of recurrent neural networks that can act as associative memories. Second, the discovery of the back-propagation procedure of Rumelhart et al. (1986a) that allowed training multi-layer perceptron networks, alleviated the single-layer perceptron crisis. The Parallel Distributed Processing volumes of Rumelhart et al. (1986b) published shortly afterwards had started a new era in neural network research which continues at the time of this writing. Later it was
20
CHAPTER 2. BACKGROUND blue square
yellow Volkswagen
yellow square
yellow square
blue Volkswagen
blue Volkswagen
Figure 2.3: A simple example of an extreme localist representation where each unit represents a single conceptual entity. discovered that back-propagation was first discovered independently by Werbos (1974). These correspond to the more powerful second generation neural networks according to Maass (1997). It has been shown that these networks require fewer units to compute certain boolean functions than neural nets of the first generation. The class of third generation neural networks is the subject of a subsequent section on the spiking neural networks in §2.1.3. The short summary here aims rather to provide a general overview of the development of the neural network field. The insightful histories from Hagan et al. (1996, Ch.1), Hertz et al. (1991, Ch.1), and selected articles from Anderson and Rosenfeld (1990) were very valuable to the author in preparing this section.
2.1.2
Localist versus Distributed Representations
The localist knowledge representation scheme is best described with the extreme view of the neuron doctrine for perception of Barlow (1972). The doctrine postulates that in principle, one can always find a single neuron in the brain responsible for any decision taken. In time, this definition has extended to include finding single neurons representing any concept perceived or imagined. This implies that a distinct neuron is used to represent each possible combination of these single concepts as well, such as a “blue square” or a “yellow Volkswagen” as shown in Figure 2.3. The localist units that represent such high level features are also called gnostic, or cardinal cells. 21
CHAPTER 2. BACKGROUND A most critical argument against the plausibility of finding a “yellow Volkswagen cell” concerns the storage capacity of the brain, first mentioned by Harris in 1970’s (see Weisstein, 1973 and the review of Page, 2000). The argument is that one may need cells to represent general features such as “yellowness” or “Volkswagen,” but if a distinct cell is used for an arbitrary combination such as “yellow Volkswagen,” then the number of other multi-place combinations that need to be represented is 2n , which increases exponentially with the number of possible features n. For instance, taking a set of features S = {a, b, c}, the number of possible combination of features becomes S¯ = {∅, a, b, c, ab, bc, ac, abc}, where the size of ¯ = 8 = 23 . These combinations will also unavoidably include never-to-be-used the latter is |S| concepts. One can easily see the kind of problems this combination coding creates considering gross facts of neuroscience. Taking the 106 fibers connecting the retina to cortex, if one uses a purely localist approach to represent pairs of points in the retina (e.g., lines connecting a pair of points), 1012 neurons would be needed for all combinations which is more than the 1011 available in the whole of cerebral cortex (example is due to Feldman, 1990). Another criticism against the extreme localist approach is concerned with its unreliability as a storage system. If the localist scheme was employed in the brain, one would have a “grandmother cell” that fires at the sight of the grandmother. Considering that neurons are constantly dying, one would forget concepts completely when the neuron representing it is lost. Obviously, the brain is more fault tolerant than this theory predicts. This argument was popularized by a story of an imaginary neuroscientist finding a cell representing an animal’s mother, independent of angle of view, or even if the display is an abstraction. The story then discusses the consequences if the subject lost the cell permanently and therefore was not able to imagine its own mother, even though it can imagine all other things related to her, showing
22
CHAPTER 2. BACKGROUND the absurdity of the situation. This story originated with Jerome Lettvin in a talk given in 1969 (see appendix to Barlow, 1995). This kind of extreme localist view is admitted to be faulty in more recent discussions (Feldman, 1990). Furthermore, contrary to the neuron doctrine for perception, it was found that a single stimulus can activate large populations. The most prevalent alternative to the much criticized localist representations are distributed representations. Distributed representations are purely featural representations that show fault tolerance and have generalization capabilities (Hinton et al., 1986; Page, 2000). They are sometimes called holistic or holographic representations because they involve the whole set of units in the representation of any entity. Initial motivation for this kind of representation came from the early work of Lashley (1950). He stated that the reason for certain patterns of deficits in lesioned rats can be best explained by looking at the total amount of cortex removed. Since more recent findings show that most of the primary sensory and motor areas have specialized structure, the distributed representations are only hypothesized to be used in the higher brain areas whose functional organization is not yet understood. Another motivation for distributed representations was the dynamic cell assemblies of Hebb (1949). Research in these kinds of dynamic cell activity were pursued by the temporal binding proposal of von der Malsburg (1994, 1995) and synfire chains of Abeles (1991). In strictly distributed representations, concepts are represented by multiple neurons, and the same neurons can take part in the representations of different concepts, thereby offering economy in representing composite concepts. Furthermore, distributed representations enable representation of general rules that belong to a group of objects that have similar, but not completely identical, features. Since individual instances are not represented separately but by
23
CHAPTER 2. BACKGROUND activation of feature groups, then a class of concepts having common features will share neurons in their representations. This enables forming mechanisms that act on behalf of the whole class, therefore offering generalization capabilities. Also, since in distributed representations concepts are represented by the activity of a large number of neurons, they are more tolerant to fault and noise than localist models. Apart from these advantages, distributed representations also have disadvantages. Since a representation of a concept may be distributed over many features, another concept that shares similar features cannot be represented simultaneously, thus preventing parallelism. Another disadvantage of distributed representations is their apparent lack of suitability for representing structured knowledge (Hinton, 1990; Feldman, 1990; von der Malsburg, 1995). To illustrate, consider the task of representing the two objects; ‘grandmother,’ and ‘the white house’ in a fully distributed fashion. It is straightforward to represent each object with its set of features separately. However, what if we want to represent ‘the grandmother in the white house?’ A simple superposition of their features will result in crosstalk of the two different objects yielding a meaningless result. Accordingly, von der Malsburg (1995) named the inability to combine objects in distributed systems, the superposition catastrophe. Other solutions to the problem of representing structured knowledge so far did not yield satisfactory results for fully distributed representation systems. The difficulty is also due to the fact that, contrary to localist systems, observing an individual neuron does not reveal the state of the whole system, thus making distributed representations more difficult to interpret.
2.1.3
Spiking Neurons
The third generation of neural networks is the spiking networks according to Maass’s classification. The essential difference of spiking neurons from McCulloch-Pitts neurons is
24
CHAPTER 2. BACKGROUND
Inputs
Connection weights
x1 (t)
w1
x2 (t)
w2 .. .
xn (t)
Output T p(t)
R
o(t) = δ(t − t(f ) ),
p(t(f ) ) > T
Membrane potential Threshold condition
wn
Figure 2.4: A simplified spiking neuron to compare with the LTG. The schematic does not indicate the reset after spike and the constant decay effects on the membrane potential. the interpretation of the activation (output) function. In second generation neural networks, the output of a unit consists of a real value that is hypothesized to represent the average firing rate of a biological neuron at a discrete-time step k (see Figure 2.1). However, in the continuous-time spiking neurons the output at time of firing is the actual spike as seen in Figure 2.4. Average firing rate models have been commonly used since the 1920’s (Maass, 1997; Gerstner, 1999). The information carried by this rate coding was recently found to be band limited. For instance, Thorpe and Imbert (1989) observed that certain visual tasks can be completed in about 100 ms by the brain, with the computation involving about 10 stages of propagation across synapses. This leaves enough time for the neurons in each stage to emit only a few spikes, given that highest spiking rate of a neuron is about 100 Hz (Maass, 1997). If neurons were averaging their inputs before giving an output, this computation could not have been carried out meaningfully with the few spikes. However, it may be argued that the rate coding actually represents the total activity of a neuron population at a time instant to avoid this criticism (Gerstner, 1999). This approach has other pitfalls by assuming an unrealistic system that has homogeneous populations of neurons connected to points where collective responses are evaluated. 25
CHAPTER 2. BACKGROUND These observations suggested that neurons use a faster code which may be based on the timing of the spikes emitted. Observations indicating that biological systems actually depend on timing of signals have supported this view (Gray et al., 1989; König and Engel, 1995; Singer, 1995; Singer and Gray, 1995; Ritz and Sejnowski, 1997; Engel et al., 1999). A number of alternative approaches to rate encoding have been proposed. These include spike time coding (time-to-first-spike), phase encoding, coding with correlations and synchrony, and stimulus reconstruction with reverse correlations (Gerstner, 1999). Here, an account of how models of spiking neurons have been developed is given. Von der Malsburg (1994) and Abeles (1991) as well as Hebb (1949) are among those who proposed models empowered with neurons using exact spike timing rather than an average firing rate (Crick, 1984). The following sections discuss how these ideas were developed in broader detail.
2.2
Representation, Composition and the Binding Problem
In modeling cognition, certain problems were identified as essential by many researchers. As a cognitive architecture, similar in spirit to earlier works (Anderson, 1983; Newell, 1990), Valiant’s neuroidal model needs to tackle several such problems. Some of these, being of interest to us, are employing adequate representational mechanisms and being able to compose novel concepts as new knowledge is acquired. It turns out that the unified framework of the neuroidal model offers a solution to both these problems of representation and composition. In this section, an account of the developments leading to this solution offered by the neuroidal model is given, rather than its other important features. In the neuroidal model, an integral object is represented by correlated activity of its features. This representation method involves the temporal properties of neuronal firings, 26
CHAPTER 2. BACKGROUND therefore is called temporal binding, originally proposed by Christoph von der Malsburg in 1981 (reprinted as von der Malsburg, 1994). The temporal binding mechanism uses synchronous firing activity to represent features that belong to a single object, and desynchronized activity to distinguish features of different objects (Milner, 1974; von der Malsburg, 1994; von der Malsburg and Schneider, 1986; von der Malsburg, 1995; Abeles, 1991, 1994; König and Engel, 1995; Singer, 1995; Singer and Gray, 1995; Engel et al., 1999). Valiant’s original motivation, however, was not von der Malsburg’s proposal. Rather, it was a network that can dynamically link its nodes that represent previously known concepts to new nodes that is intended to represent a novel concept. This mechanism, known as recruitment learning, operated on a network that consists of nodes with sparse random connections, originally proposed by Jerome A. Feldman (1982). The way novel concepts are formed requires simultaneous activation of existing concepts that relate to the novel concept, which is essentially the same mechanism proposed by von der Malsburg. Even though similar, there are differences in the approaches of Feldman versus von der Malsburg, mainly in having different motivations. On one hand, von der Malsburg proposed temporal binding as a feasible representation scheme for the brain. Feldman’s recruitment learning, on the other hand, was an engineer’s solution to avoiding crosstalk and combinatorial explosion in representing binding structures, and allowing composition of novel concepts in connectionist models through learning. The following discussion describes, in detail, the motivation behind these two parallel approaches and their similarities. Then, an account of contributions from other researchers to Valiant’s neuroidal model are given. We are going to quote, in places, von der Malsburg’s account of the history of temporal binding from his recent review article of (von der Malsburg, 1995). The issue of binding was
27
CHAPTER 2. BACKGROUND identified as a central problem in neural representation earlier by Rosenblatt (1961). The term ‘binding,’ however, is due to another line of research on the problem of variable binding in the knowledge representation subfield of artificial intelligence (AI) which is explained next.2
2.2.1
The Variable Binding Problem
The variable binding problem is a special case of the more general binding problem. Variable binding is concerned with finding appropriate bindings for first-order logic variables in rule-based systems. This serves to correctly assess relations between objects. Binding an object to a variable means using the variable to represent the object. The problem can be demonstrated with an example in the context of a perceptual recognition task as follows (see Figure 2.5). As the knowledge base of a system, take two first-order logic sentences describing the properties of objects in a visual scene. The first sentence specifies the geometric properties of available objects with ∃a, b square(a) ∧ triangle(b) ∧ (a 6= b) which is interpreted as “there exists a square and a triangle (in the scene).” The second one specifies the location of the available objects by using predicates that can detect the presence of any object in parts of the visual field. This sentence is ∃c, d upper(c) ∧ lower(d) ∧ (c 6= d) which is interpreted as “there exists two objects such that one is in the upper part and one is in the lower part (of the scene).” Possible input scenes described by the predicates employed are depicted in Figure 2.5(a). Assume one wants to use the available information in the knowledge base to draw inferences. Let us consider the rule “if there is a triangle at the upper part, then assert (something).” This rule can be encoded in first-order logic with ∃a upper(a) ∧ triangle(a) ⊃ foo(bar). Drawing the inference requires verifying the 2
The term binding is alternatively called fast links (Bienenstock, 1999).
28
CHAPTER 2. BACKGROUND
Inputs :
Upper
square
0
triangle
1
Linear Threshold Unit
Square 1
Lower
upper
Output: foo
2
0
Triangle lower
Visual Field
(a) Elements of the scene as predicates.
(b) The network architecture in Rosenblatt’s example.
Inputs: upper, triangle
Inputs: upper, square, lower, triangle
(c) The target scene. Activates the two predicates triangle and upper that can be recognized by a computational mechanism.
(d) The scene that causes the incorrect detection by activating the same inputs as the case on the left, however having a different configuration.
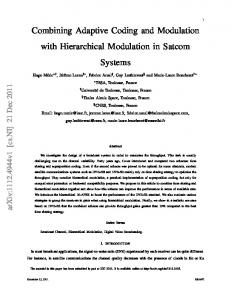
Figure 2.5: Example for demonstrating the binding problem. The four predicates given in the text are abbreviated as square, triangle, upper and lower for simplicity. See text for details.
29
CHAPTER 2. BACKGROUND antecedent. That is, if “there is a triangle in the upper part,” the consequent foo(bar) will be implied as seen in Figure 2.5(c). This is not obvious because the relations between the variables a, b and c, d in the sentences of the knowledge base are not known to the system. A search must be conducted by testing possible bindings of variables that correctly represent the scene. Here, the possible number of bindings are few, just two: {a = c, b = d} or {a = d, b = c}. It is seen that the rule can be applied if the first binding {a = c, b = d} holds on the input scene. However, in more general cases this search takes time growing factorially by the number of variables in each sentence and exponentially by the number of sentences in the knowledge base. For researchers in the AI field, the variable binding problem is the time complexity of this search (Valiant, 1998). The binding issue described above becomes graver if no variables are allowed in the representation. This is the case if propositional logic is employed instead of first-order logic, where each proposition specifies the properties of the totality of the input. The contents of the knowledge base in the above paragraph would then become square-object ∧ triangle-object and object-in-upper-part ∧ object-in-lower-part and the rule would become object-in-upper-part ∧ triangle-object ⇒ foo-bar. The antecedent of the rule detects the presence of two propositions, that is, a production system needs to test if “there is an object at the upper part” and that “there is a triangle.” The system can correctly detect the presence of the triangle at the upper part of the scene depicted in Figure 2.5(c) because the two propositions required for the rule are available. However, the rule does not assert that it is indeed the triangle which is at the upper part of the scene. The rule works correctly as long as the triangle is the only object in the scene. In order to show the conflict, another object needs to be added to the scene. Consider the scene depicted in Figure 2.5(d) where there is a square at the upper part and the triangle is
30
CHAPTER 2. BACKGROUND shifted to the lower part. This case activates all four propositions: square-object, triangle-object, object-in-upper-part, and object-in-lower-part. Having more than one object while employing propositional representations creates an ambiguity of which features belong to which object. The result is catastrophic; the two propositions required by the rule are still available, and therefore the rule will succeed by incorrectly detecting a triangle at the upper part even though there is none! This brings us to the example described originally by Rosenblatt (1961) to illustrate the more general problem of binding. His example is given next to introduce the binding problem. The example is designed to demonstrate the limitations in representational machinery of classical neural networks.
2.2.2
The Binding Problem
Rosenblatt, in describing the binding problem, uses a neural network as seen in Figure 2.5(b) to recognize the geometric-shapes-at-two-locations task discussed above. In classical neural networks the inputs are given in patterns to the network without any binding information, similar to that of propositional logic. If the network is trained to recognize the stimulus in Figure 2.5(c), its objective is to detect the conjunction of the two active inputs in this case: triangle-object and object-in-upper-part. Then, similar to the case in propositional logic, if the network is presented the scene in Figure 2.5(d) with the square above the triangle, it will spuriously detect a triangle at the upper part since the the conjunction is satisfied with the activity on all the four inputs. The binding problem, due to crosstalk of different objects, is thus exploited in neural networks when there is more than one object in the scene. The binding problem is thus shown to appear in different computational descriptions, such as demonstrated with propositional logic and neural networks. Neither system can distinguish
31
CHAPTER 2. BACKGROUND if the square or the triangle is at the upper part when they are present simultaneously. This inherent limitation of the classical neural networks has generally been avoided by employing combination-coding schemes for encoding input representations (Rumelhart et al., 1986b). The combination-coding approach corresponds an extreme of the localist knowledge representation influenced by the neuron doctrine for perceptual psychology of Barlow (1972) that we discussed earlier in §2.1.2. For instance, this example will have inputs for each possible case (e.g. upper-triangle, upper-square, lower-triangle, lower-square). However, combination-coding by expanding the inputs to cover each case makes the number inputs grow exponentially with the number of interacting objects causing a combinatorial explosion when realistic number of features is considered. It can be said that the nature of the binding problem is in representational power rather than computational power. Von der Malsburg remarks that the ambiguity arising from the lack of binding information in inputs prevents neural networks from being trained faster. If the binding issue is overcome, he adds, the network should be able to learn input stimuli with a single presentation, instead of being trained over a large number of trials. Otherwise without binding information, the network has to guess appropriate correlations between inputs by observing a large number of samples from the statistical distribution of the data. Finally after presenting the limitations of different computational schemes, the binding problem of representation can be summarized by the question of how related inputs should be grouped together.3 The term binding is alternatively called fast links (Bienenstock, 1999).4 3
The bindings in the example are fairly simple with few elements, whereas in real world situations large numbers of bindings are required. 4 Bienenstock finds the term binding problem “imprecise and stale” which is consistent with the account given here. He speculates on naming the issue “. . . specific idiosyncratic short-lived functional links. In short, fast links.”
32
CHAPTER 2. BACKGROUND 2.2.3
Temporal Binding
Von der Malsburg (1994) supports the arguments against the combination-coding approach associated with the localist representations discussed earlier. However, instead of proposing a strictly distributed approach as an alternative, he postulated that the brain uses dynamic representations for arbitrary conjunctive concepts such as the yellow Volkswagen. These representations are temporary since the brain may only need them during a task, such as analyzing a scene, dispelling the problem of combinatorial explosion. The composite concepts are formed by dynamically binding distributed groups of neurons that represent their elementary features.5 Employing distributed representations, temporal binding inherits some of their advantages, such as ability to generalize. However, these purely dynamical representations are also rather limited if they cannot be transformed into long-term storage, that is if novel concepts cannot be composed out of the binding structures (Feldman, 1990). Von der Malsburg’s proposal is best known as the theory of temporal binding, that is binding via synchronous activity of cells, to prevent the problems described.6 This theory can be briefly described as to temporarily associate entities that are active simultaneously to coherently represent an object. Conversely, explicitly separated, or desynchronized, activity represents different objects. Temporal binding, by using time as coding space, requires only elementary feature units to be present and allows combinations to be formed dynamically via transient potentials at interconnecting synapses. In terms of the number of units needed to represent entities that a cognitive system is exposed to, the magnitude is thus lowered from being exponential to quadratic with respect to the number of features. 5
In contrast, these simpler features are assumed to have localist representations (von der Malsburg and Schneider, 1986). 6 The term ‘temporal binding’ should not be confused with the description of bindings required for maintaining continuity in temporal events of Treisman (1996).
33
CHAPTER 2. BACKGROUND Different from a classical artificial neural network, the computational system to recognize the scene needs to be augmented with the notion of time. Labeled patterns, forming training examples, in classical neural networks are presented to the network one at a time without any relational information. Here, a training example is presented to the network for a continuous time duration. The propositions that appear synchronously are bound together and said to represent a single concept or object. Temporal binding is motivated by the study of the brain. In the context of computations that take place in the brain, functionally and physically separate areas of the sensory cortex (e.g., visual, auditory, somatosensory) analyze different stimulus features in the environment. Temporal binding can explain how these physically distributed feature representations are combined to form coherent unitary percepts. This proposal is further supported by psychological evidence that human subjects exhibit binding errors of detecting illusory conjunctions if they are given insufficient time to analyze a scene. This suggests that timing may employ an important part in perceptual processing in the brain (Treisman and Gelade, 1980; Treisman, 1996). Neuroscientific studies of Singer and Gray (1995) provide supporting evidence for temporal binding in their temporal correlation hypothesis. Many other neuroscience (Gray et al., 1989; Singer, 1995; Singer and Gray, 1995; König and Engel, 1995; Ritz and Sejnowski, 1997; Engel et al., 1999) and simulation (von der Malsburg and Schneider, 1986; Hummel and Biederman, 1992; Shastri and Ajjanagadde, 1993; Schillen and König, 1994; Lisman and Idiart, 1995; Terman and Wang, 1995; Sougné and French, 1997) studies followed these proposals. Consider again the geometric-shapes-at-two-locations example. The use of temporal binding in Figure 2.6 should solve the ambiguity that is demonstrated earlier. The single-object scene of Figure 2.5(c) can be represented with the time profile of input activity
34
CHAPTER 2. BACKGROUND
square
square
triangle
triangle
upper
upper
lower
lower t
t (a) Simultaneous activity representing the scene in Figure 2.5(c).
(b) Two groups of simultaneous activity that form the necessary bindings for correctly representing the scene in Figure 2.5(d).
Figure 2.6: Demonstration of temporal binding on the example developed earlier in Figure 2.5 to overcome the binding problem that arise with propositional representations. Time profile of activity in inputs are depicted in the above figures. Impulses indicate activity of the inputs as neuronal spikes. shown in Figure 2.6(a). Simultaneous activity in the inputs triangle-object and object-in-upper-part results in forming the concept of the triangle object taking the role of being at the upper part. Such a binding is not necessary in a single-object scene as discussed before. However, the advantage of temporal binding becomes more obvious with the multiple object scene that created ambiguous inputs to the earlier propositional system. The scene depicted in Figure 2.5(d) is represented with the activity in the inputs as shown in Figure 2.6(b). Here, two groups of desynchronized activity represents unambiguously the two separate objects in the scene. The recognition mechanism is not mistaken any longer by detecting a triangle at the upper part when temporal binding is employed.
2.2.4
Dynamic Connections versus Temporal Binding
At about the same time as von der Malsburg, Feldman (1982) independently proposed an equivalent solution to temporal binding in a neural networks (or connectionist modeling)
35
CHAPTER 2. BACKGROUND
Shastri (1999−2001) − Biological grounding of recruitment
Diederich (1988−1991) High−level learning
Shastri (1988) − Recruitment of relational expressions
Valiant (1988−2000) Neuroidal architecture for cognition
Shastri & Ajjanagadde (1991−1999) − Reflex reasoning with synchrony and oscillations
Crick (1984) Searchlight hypothesis
Feldman (1982) − Dynamic links (Recruitment learning)
Wickelgren (1979) Chunking and consolidation
Maass (1999) Computation with pulses
Treisman and Gelade (1980) Feature integration theory
Gray, Koenig, Engel & Singer (1989−1995) Temporal correlation hypothesis
Von der Malsburg (1981) Temporal binding
Barlow (1972) − Neuron doctrine (Problem: combinatorial explosion)
Rosenblatt (1961) − The binding problem
Hebb (1949) Cell assemblies
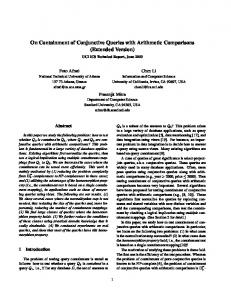
Figure 2.7: Historical progress described by a citation graph. The graph shows ideas of researchers contributing to the notion of concept representation and composition in Valiant’s neuroidal model. Feldman and von der Malsburg apparently proposed similar approaches independently. For simplicity in the graph, most direct influences from hierarchically lower items are not repeated if there is an indirect path connecting them.
36
CHAPTER 2. BACKGROUND context. However, von der Malsburg (1995), in a recent article that reviews the binding problem, and others (Shastri and Ajjanagadde, 1993) seem to misinterpret Feldman’s model and unfairly categorize it as a type of static, combination-coding structure. These structures are classically criticized as plagued by combinatorial explosion. Even though von der Malsburg lead the temporal binding proposal, there appears to be conflict in his opposition to Feldman’s dynamic connection networks. The precedence of these two proposals is unclear to the author since there is no cross citation in the original articles of either party (see Figure 2.7). Instead, the situation is assumed to be the independent consequence of having the same idea due to the scientific environment of the time. It is apparent that the work of both parties was influenced by the cell assemblies of Hebb (1949) as were others who independently proposed similar solutions to the binding problem (Milner, 1974). Feldman’s dynamic connection network was similar to a “phone switching network” that can avoid crosstalk when creating conjunctions of concepts. These conjunctive concepts are required, for instance, when forming bindings of objects in visual scenes, such as reviewed above when the binding problem is explored. In order to better explain the conflict with opposing views to Feldman’s approach, his original proposal is reviewed here. Feldman progressively described these three architectures seen in Figure 2.8 (Feldman, 1982).
Uniform Interconnection Networks Feldman’s initial formulation defines a uniform interconnection network. This network is designed to dynamically link two units, each from a different set of size N . In other words, the network works as a temporary memory keeping relational information of binary conjunctive elements. Whenever two end-units are activated simultaneously, an assembly is
37
CHAPTER 2. BACKGROUND
End units
Intermediate units
a
End units c
ac ad bc
b
d
bd
(a) The uniform interconnection network. Solid lines show excitatory connections and dashed lines indicate mutually inhibitory circuits.
Columns of intermediate units interconnected randomly
End units a
.. .
.. .
.. .
.. .
End units
.. .
.. .
··· .. .
A
.. .
z
Z
(b) The random interconnection network.
a
p
b
.. .
v g
(c) The random chunking network where no distinction is made between end- and intermediate units.
Figure 2.8: Architectures describing mechanisms for binding binding conjunctions of end-units from Feldman (1982). See text for details. 38
CHAPTER 2. BACKGROUND formed by strong activation of an intermediate unit connected directly to each of the end units. A network which has N = 2 end-units and 4 intermediate units is depicted in Figure 2.8(a). The intermediate units form mutually inhibitory circuits with each other that suppress competing intermediate units when a link is established. This short term memory is stable until the activation of the units fades away and the link is undone. Notice that, activations of units and their respective states are used to represent an assembly, rather than changes of synaptic organization or weights. This approach is influenced by the assumption that synaptic reorganization of the brain is a relatively slow process. However, the scheme described here requires N 2 intermediate linking units, each devoted to maintaining a specific pair of association between the two input sets. The network, as Feldman explains, is capable of maintaining N dynamic associations simultaneously without crosstalk. Other features of the network include employing bidirectional connections, and using residual7 activation of assemblies. If Feldman’s uniform interconnection architecture is compared with von der Malsburg’s temporal binding theory, similarities can be drawn. The uniform network acts as a temporary memory device based on activation fluctuations and therefore no permanent storage is allocated for any assembly.8 This is consistent with the approach of von der Malsburg (1994) for representing binding assemblies temporarily. The second similarity between the approaches is the use of correlated activity for forming assemblies. Nevertheless, the criticism of combinatorial explosion is appropriate for Feldman’s uniform networks due to the requirement of a large number of intermediate units. The number of required intermediate units is N 2 for associating two size N sets of end-units.9 7
An intermediate unit can only be activated if it receives activation from both its end-units, meaning that the threshold of the intermediate unit is set to be exceeded only in this case. 8 Feldman also discusses how to allocate permanent storage if desired with appropriate weight changing algorithms. 9 Even though Feldman did not aim to enable conjunctions of more than two at this point, it can be deduced
39
CHAPTER 2. BACKGROUND Feldman describes a slight improvement to the architecture by reducing the number of intermediate units to 4N 3/2 while augmenting the units to have dendritic fingers that calculate the maximum activation received from different sites. Furthermore, the approach can be considered wasteful since intermediate units are required for any arbitrary combination of inputs that may actually never have to be bound together. Feldman argues that although the approach has biological plausibility due to the √ ratio of projections (each end-unit projects to about N intermediate units), it has superhuman ability to maintain a large number of associations simultaneously. The statement about biological plausibility is justified by the total number of neurons in the human brain √ N = 1011 and the average number of projections from each neuron 104 ' N which is originally stated by Wayne Wickelgren (1979). However, this hypothesis lacks statistical √ support for general brain-like structures to contain projections proportional to N . This is because the claim is made by a single general observation of the number of principal cells in the human brain, and not calculated statistically from brains with varying N .
Random Interconnection Networks The second architecture suggested by Feldman was a random interconnection network inspired by the work of Fahlman (1980). The intermediate units in this network are in the form of layers of randomly interconnected units, where the outer layers connect to each set of end-units (See Figure 2.8(b)). This architecture is similar to that of a uniform network, except that it reduces the number of required intermediate units to a constant factor of N rather than N 2 . In this architecture, the mutual inhibitory circuits are also removed since they are biologically implausible. that the uniform architecture would need N m intermediate units for satisfying conjunctions between m sets, each of size N .
40
CHAPTER 2. BACKGROUND Since the connections are random, Feldman uses statistical calculations to justify the generation of binding assemblies in this architecture, even though the performance is not as stable as the case in uniform networks. Here, arbitrary combinations of end-units activate a multiple number of intermediate units in each layer. There is no longer a combinatorial explosion in the number of intermediate units, since some are shared in linking different end-units. However, this results in degraded performance as the number of simultaneous links maintained increases, losing the superhuman performance featured by the uniform connection network. Feldman’s random interconnection networks do not require a combinatorially prohibitive numbers of units. Therefore, this design is not a valid target for the criticisms made later (Shastri and Ajjanagadde, 1993; von der Malsburg, 1995). It is interesting to note that the alternative proposals do not have any mechanism that takes the place of Feldman’s dynamic links. Both the approaches of von der Malsburg (1994) and of Shastri and Ajjanagadde (1993) use correlations to indicate bindings between units. Von der Malsburg gave an account of a plasticity mechanism that strengthens the synapse in the presence of correlated activity and weakens it otherwise. Although it is implicit in this statement that there exist units that receive activation from all participants of the binding, von der Malsburg did not specify where these synapses reside, nor possible schemes of wiring and their complexities unlike Feldman’s proposal. On the other hand, Shastri and Ajjanagadde (1993) assumed bound pairs are directly connected with uni- or bidirectional links and that the network has mutual inhibitory circuits between competing or interfering units. They did not explain how to acquire these structures through learning or as a result of network organization unlike Feldman’s proposal. However, Feldman’s approach was also fairly treated in other proposals (Shastri, 1988, pp.181–191), Shastri (2001, 1999b) and Valiant (1994, 1988). Both had adopted the third
41
CHAPTER 2. BACKGROUND architecture developed in Feldman’s original article which is discussed next.
Random Chunking Networks The random interconnection networks have valuable features, but they are limited to representing conjunctions of only two elements. In order to support conjunctions of more elements, Feldman extended the model to use a ‘random chunking network’ which can represent bindings that associate many elements. This network is similar to previous random interconnection networks except that it is not structured in layers and all elements reside in a randomly connected network as seen in Figure 2.8(c). This is inspired by and consistent with previous work on chunking and consolidation of Wickelgren (1979). Wickelgren proposed that vertical associations can be obtained with a chunking process. In this model, the memory consists of neurons which can either be free or bound. As vertical associations between pairs of bound neurons are created, the new information is chunked by free units which become bound thereafter. Wickelgren assumes that the genetic connections of the brain are sufficient for finding intermediate units in this process. He claims there should be a path connecting every pair of cells. In particular, due to the known facts of the time about the connection density of the brain (104 synapses/neuron) and total number of cells in the human cerebral cortex (109 neurons, more recent reports approximate this number to be 1011 ), the path connecting two bound neurons can be as short as containing only a single intermediary neuron (104 × 104 ' 109 ). However, this is still an oversimplification since it assumes that projections do not overlap. Feldman carried Wickelgren’s chunking process onto a randomly connected network with √ projection factor of N as in his previous models, but where N now stands for the total number of units in the network, rather than the number of units in the intermediate layer or
42
CHAPTER 2. BACKGROUND end-unit set. He showed statistically that, in these random chunking networks, one can always activate a number of new units by initially activating two or more units if the connection density is high enough. This key point was later adopted by Valiant in his neuroidal architecture. This statistical mechanism allows formation of binding assemblies of any number of units. In order to evaluate the network in this task, Feldman empirically analyzed the different connection density parameters versus the performance of maintaining associations of different number of units. In order to fortify the probability of finding binding structures that connect activated inputs, Feldman proposed using sets of units in the order of ∼ log N . With this redundancy introduced, the network is able to encounter the unreliability criticisms made against localist representations. In summary, an important improvement in this architecture is that the units can be used to represent associations between any inputs, and they are not constrained to represent an arbitrary combinations of inputs. Feldman names the procedure of assigning novel concepts to free units in the random chunking network recruitment learning.
2.2.5
Discussion
As mentioned earlier, both von der Malsburg and Feldman’s solutions to the binding problem are analogous, although possibly being proposed independently. Whereas von der Malsburg approaches the problem from the neurological perspective by emphasizing synchronous firings reported in the brain, Feldman discusses more systems and computational aspects. Von der Malsburg formulates the problem successfully since his work has been most influential (Crick, 1984; Singer and Gray, 1995). Feldman’s proposal has mostly been criticized for combinatorial explosion and unreliability due to the localist representation. Only later, Feldman (1990) defends his view against each of these criticisms.
43
CHAPTER 2. BACKGROUND Feldman’s stance was at neither end of the localist-distributed dilemma reviewed back in §2.1.2. The representations with c log N redundant units is a middle point between localist and distributed extremes, essentially still advocating a localist approach. The redundancy and randomness, as Feldman (1990) argues, encounters arguments made against localist representations. This mode of representation is also called distributed localist or modularly distributed (Browne and Sun, 2001). Even though in both approaches the mechanisms are triggered by synchronous activity, in Feldman’s approach this is not necessarily temporal synchrony. In Feldman’s units, the output reflects the average frequency of firing and not a single firing event. This puts Feldman’s network into the category of second generation neural networks discussed earlier. It was Valiant who later pursued Feldman’s approach to change the interpretation of its outputs to single firings, even though in a simplified binary form (Maass (1997) acknowledges that this type of network conforms better to the third generation of neural networks). This leads to the unification of the two theories of temporal binding and recruitment learning, both of which so far had been developed separately. Even Shastri (2001, 1999b), who has worked on synchronous firings in semantic networks, did not put recruitment learning into the picture until later. See the Figure 2.7 depicting the historical development of the above discussed ideas. To reiterate, the similarities and distinctions between the temporal binding and the most recent proposed recruitment learning approaches can be given as follows: 1. Both use synchronous activity to indicate tuples to be bound; 2. Temporal binding is purely dynamical and simply associates the tuples together, whereas recruitment composes a novel concept representing the binding; and 3. Temporal binding does not specify an interconnection scheme, some implementations
44
CHAPTER 2. BACKGROUND use full or local excitatory and global inhibitory connectivity, whereas recruitment learning uses properties of random graphs with redundant representations to achieve a feasible concept production scheme without causing a combinatorial explosion. Von der Malsburg and Feldman’s proposals influenced many researchers in different fields. One of Feldman’s students, Shastri (1988, 2001, 1999b), adopted temporal binding for representing relations between objects in a neural network as a logical inference system. This network employed temporal binding, and therefore used phase-coding, for representing features of objects. A number of significant methods were proposed within this framework, including a method for representing relational expressions in a neural network context and drawing inferences via reflexive reasoning. The model incorporated synchronous firing and oscillatory activity similar to that of the brain, with neurally-inspired units and arbitrary connection topologies crafted for solving various logic problems (Shastri, 1988; Shastri and Ajjanagadde, 1993; Shastri, 1999a). However, the biological plausibility of this system was criticized (Dawson and Berkeley, 1993). We revisit this line of study later when discussing reasoning in the next section. Other applications of temporal binding include invariant shape recognition (Hummel and Biederman, 1992), and binding in multiple feature domains (Schillen and König, 1994).
2.3
Learning and Reasoning
So far we have briefly reviewed neural network research and discussed relevant knowledge representations for a cognitive architecture. The material covered earlier only gives a partial background for the daunting task of modeling cognition. In this section we extend this coverage on the issues of learning and reasoning. We first discuss the computational significance of learning in intelligent systems, and then review the limitations of learning 45
CHAPTER 2. BACKGROUND capabilities of neurally inspired systems.
2.3.1
Learning
The recent experience in the field of artificial intelligence (AI) shows that the classical approach to AI using symbol-processing or physical symbol systems has important limitations. These systems commonly feature logical reasoning with a deduction method that operates on memory stores of declarative knowledge. The declarative knowledge is often expressed in first-order logic or in a language with similar representational power. These systems were shown to be successful in practical applications such as:
DENDRAL ,
an organic
molecule predictor using mass spectrogram analyses; MYCIN, a medical diagnosis program; and, DEEP BLUE, a chess player that can stand up against world champion human players. However, a weakness of these systems is, due to their knowledge-based approach, the need of a broad knowledge of the environment to be preprogrammed into them prior to operation (Nilsson, 1998). Even though the systems were successful in solving toy problems with limited scope, they sometimes failed when they are faced with real-world scenarios. Coping with natural phenomena requires a large body of knowledge preventing these systems from scaling up. A preprogrammed system fails to give a correct response if it encounters a situation for which it has not been programmed, which makes it brittle (Valiant, 1984, 2000a).
Learning in the Probably Approximately Correct Sense A system becomes more robust if the knowledge is learned through training, rather than programming. For instance, the human cognitive system has some preprogrammed knowledge from its inherited genetic code, but acquires most of its knowledge by learning. Even though learning systems are advantageous in some aspects, using them requires solving
46
CHAPTER 2. BACKGROUND important principal problems. There is still too much to learn to exhaust a domain of knowledge. It has been shown that a learning system can operate on a probably approximately correct (PAC) basis by learning whole classes of concepts in a feasible amount (i.e., polynomial) of time without having to exhaust all instances of the class (Vapnik and Vezirani, 1971; Valiant, 1984; Blumer et al., 1989). The premise of this learning approach is that the system may have small errors, but operates correctly most of the time.
Incomplete Knowledge, Nonmonotonic Phenomena and Noisy Inputs In coping with real world phenomena, a system needs to be capable of operating with incomplete knowledge about its environment. Also other phenomena, such as nonmonotonic information which contradicts previously existing knowledge in the system, need to be handled correctly. In classical AI systems, either a closed-world assumption or a circumscription approach is employed to work with manageable amounts of knowledge about the environment as to avoid these obstacles (McCarthy, 1980; Horty, 2001). These provide limited solutions to the problems of incomplete knowledge and nonmonotonic information. Closed-world systems assumes no incomplete knowledge, and circumscription copes with nonmonotonic information using special constructs. The PAC learning semantics offers a solution to both these problems by offering values for queries at all times (Valiant, 1994, 2000a). That is, for a query on unknown information, the system will attempt to guess a value using the past experience on other information. This allows conflicting, or nonmonotonic, information to be correctly categorized. Another issue with intelligent systems is that learning models tolerate noisy inputs whereas preprogrammed systems prove to be brittle. Statistical approaches like PAC learning offer advantages in dealing with noisy and inconsistent knowledge, especially when
47
CHAPTER 2. BACKGROUND employing linear separators like the linear threshold gates in neural networks.
Neural Networks Neural network architectures have shown extraordinary capabilities for acquiring knowledge by learning. These networks of linear threshold elements with non-linear output functions (such as the sigmoid) are robust in presence of noise, allow generalization from a limited set of input samples, and work in a parallel fashion. Introduction of the back-propagation technique with the second generation neural networks (Rumelhart et al., 1986b), in particular, was viewed as a strong alternative to classical AI approaches. In the historical context, this caused the separation of the AI community into two parts, as discussed earlier. In spite of their empirical successes, Rumelhart et al. (1986b) were heavily criticized by the followers of the more classical AI approach such as Fodor and Pylyshyn (1988) and others. However, nowadays these two fronts appear to have agreed that both approaches offer significant advantages that should be combined together (Nilsson, 1998; Wermter and Sun, 2000a). Neural networks have some caveats that must be mentioned. Even though they showed success in some pattern recognition tasks, they also failed in others. The reasons for the failure of neural nets were apparent in some tasks, such as in the case of the tank recognition network.10 For this task, the network learned to pay attention to some unexpected features, which caused erroneous classification of the test samples. The main reason for this is the loose theoretical basis of neural network learning, even though some theoretical work on neural networks have been done (Maass, 1995). For instance, it has been shown that a 10
This task involves classification of scenes that may or not contain military tanks. After training with a set of sample images, the network is tested with previously unseen images to indicate if an image contained a tank. However, the test failed miserably since apparently the network learned to distinguish the tanks by using peripheral clues rather than the image of the tank itself. The reason for this was that all the training images with tanks were shot during a bright weather, whereas the images without tanks featured a gloomy weather.
48
CHAPTER 2. BACKGROUND multilayer network with at most with two hidden layers can compute any Boolean function, given that it has sufficient number of units (Cybenko, 1988). Also, a single hidden layer is enough to approximate any continuous function (Cybenko, 1989; Hornik et al., 1989). However, it is not well understood how many hidden units are required for approximating an arbitrary function in general. There are many issues with multilayer neural nets that still remain to be solved. It is still not well known how long it takes to train a neural net or the conditions that result in failure of convergence of the learning algorithm (local minima) for the back-propagation technique. Because of these unknowns, sometimes the neural network research is labeled as being a black art or dark magic. They are also criticized for being biologically unrealistic in some senses, such as an error back-propagation procedure being employed in the brain. Some variations of the back-propagation technique, which were recently introduced, improve the biological feasibility of the approach, such as the perturbation-based methods. There is an issue of unreliability, in the sense of trustworthiness, attributed to these layered feed-forward or recurrent neural nets. In these networks, only inputs and outputs are meaningfully labeled, and the net is trained with a large number of exposures to input and output patterns. After training, it is not straightforward to understand the inner representations and rules governing its output. Thus, such a net is sometimes called a black-box that can solve a problem but cannot explain how the solution is achieved (McCloskey, 1991). However, recent advances in the analysis of trained neural nets have improved the situation considerably (Berkeley et al., 1995; Bullinaria, 1997; Niklasson and Bodén, 1997). Still, if an explanation is sought by analyzing the structure of a neural net, the answer may be as complicated as the original question (Bullinaria, 1997). One particular network in the history of neural network (or so-called connectionist)
49
CHAPTER 2. BACKGROUND research is worth mentioning due to both the praise and the criticisms it received. Soon after introduction of the second generation neural nets, a network for reading English words, NETtalk, attracted attention for being one of the first success stories of the new multi-layer neural nets (Sejnowski and Rosenberg, 1987). Following the success of the approach, Seidenberg and McClelland (1989) pursued this research further to make claims that the network performs well at lexical decision and naming, and also that the data is consistent with specific phenomena observed in human subjects. However, they were criticized by McCloskey (1991, p. 387), who argued “. . .that connectionism should not be thought of theories or simulations of theories [on human cognition], but may nevertheless contribute to the development of theories.” McCloskey argues that using connectionism for understanding of cognition is different than the more standard view of testing theories with simulations. In testing theories, the researcher explicitly designs a computer simulation that employs the theory. However, connectionist networks are not built based on a theory, rather they are “grown” to find solutions to a given problem by adjusting their weights and connections. Therefore, the final network cannot be said to implement or prove the theory. McCloskey criticizes Seidenberg and McClelland (1989) for not describing the methods employed by their network as solution to the problem of word recognition and pronunciation. Neither can Seidenberg and McClelland (1989) leave the user to analyze the simulation results to understand the method of the network due to the complexity of the representations in the network. Actually, it is not clear which of the specific details and parameters employed in the simulation is relevant to the cognitive processes that they are trying to model. In summary, connectionist modeling cannot be used to prove cognitive theories. However, it can be used as valuable tools to generate and analyze these theories.
50
CHAPTER 2. BACKGROUND Structured Connectionist Modeling The unreliability due to the black box phenomenon of neural networks can be contrasted with the operation of symbolical systems. Upon arriving at a particular answer, a classical symbolic system can explain its reasoning by showing the chain of preprogrammed rules that resulted in the inference. In many real world applications, such a verification is desirable for reasons of security, matters of legality, or reliability (Bullinaria, 1997). In other words, “Can we trust a system that we do not fully understand?” (Bullinaria, 1997, p. 3). In order to alleviate the black box paradigm, one can use a structured approach in constructing neural nets. This can be accomplished by organizing the internal structure of the neural net as in a symbolic system. In particular, semantic nets can provide the necessary context to build such a neural net. Researchers like Feldman and Shastri in the neural net field are thus motivated to design models that can act similarly to classical semantic nets (Feldman, 1982, 1990; Feldman and Ballard, 1982; Fanty, 1988; Shastri, 1988; Shastri and Ajjanagadde, 1993; Feldman and Bailey, 2000). They term this approach structured connectionist modeling (SCM). The SCM approach has conventionally been compared and contrasted with the layered feed-forward or recurrent neural net models (Rumelhart et al., 1986b). Even though now this approach is successful in many difficult pattern recognition and classification tasks, it is unable to account for representing structural or relational knowledge efficiently, especially when distributed representations are employed (Feldman, 1990; von der Malsburg, 1995; Feldman and Bailey, 2000). SCM is successful in both failures of layered models, that is in representing structural and relational knowledge. In fairness, there are weaknesses of the SCM approach where the layered models are successful. The main weakness of SCMs is that, since they are manually
51
CHAPTER 2. BACKGROUND designed resembling classical AI models, they inherit their failures in coping with real world problems, as well. The maintenance cost of designing such nets is very high and the task may sometimes be computationally intractable. As a solution, a PAC learning method can be employed to alleviate this problem. The recruitment learning paradigm, that we discussed in the section on representational issues, attempts to fulfill this necessity. Recruitment learning allows allocating units of a network to represent conjunctions of inputs or other network units. The allocation can be either temporary or permanent. These allocations can systematically be labeled at the time of their recruitment to correspond to tokens or concepts (Feldman and Bailey, 2000). A new allocation can be considered as a working hypothesis of a target concept. These hypotheses can undergo a number of transformations, such as merging multiple hypotheses or dividing existing ones to yield a final form (Diederich, 1989, 1991; Valiant, 1998; Feldman and Bailey, 2000). The resulting network will comprise of a hierarchy of these concepts resulting in an observable structure.
2.3.2
Reasoning
Another weakness of the classical AI approach with symbol systems is the time complexity of reasoning tasks. Executing these reasoning algorithms on a serial computing device takes exponential time with respect to the depth of the inference. Taking inspiration from the speed of human cognitive mechanisms, Shastri and Ajjanagadde (1993) have shown that a reflexive, evidential reasoning system can have significant savings in the time-complexity of reasoning for real-world problems. A reflexive reasoning system uses chains of condition-response type of rules to model simple reasoning tasks (as opposed to complex tasks such as planning). Their SHRUTI architecture is based on using the spreading activation principle of a connectionist architecture in order to implement
52
CHAPTER 2. BACKGROUND reflexive reasoning. They feature a special SCM that acts as a backward-chaining inference mechanism. Some previously intractable reasoning tasks can be attempted within this framework in time proportional to the shortest chain of reasoning leading to the conclusion. That is, time to reason is independent of the size of the knowledge base. This kind of reasoning can operate, similar to cognitive systems, on a long-term knowledge base of millions of items (Shastri and Ajjanagadde, 1993; Shastri, 1999a). They have also demonstrated real-time rapid reasoning of language understanding by mapping their system onto a massively parallel computer architecture (Mani and Shastri, 1994; Shastri, 1999a). Their results showed a 500 milliseconds response time to draw an inference of up to eight stages deep. Interestingly for us, their model successfully employs temporal binding in achieving such time savings. However, the model has also been criticized from a number of points. A major concern has been its biological plausibility (Dawson and Berkeley, 1993). The SHRUTI model also does not include a mechanism to acquire its systematic structure. A problem arises in employing temporal binding, where keeping information in separate phases in deep inference tasks becomes problematic (Shastri and Ajjanagadde, 1993; Hayward and Diederich, 1996; Shastri, 1999a). Another limitation of the architecture is using a restricted from of first-order logic where unification is replaced by ensuring systemacity between predicate arguments and matching processes (Hayward and Diederich, 1996). This results in a penalty when trying to express equality among the arguments of a rules antecedent. If there is no corresponding argument in the rules consequent, the bindings of the variables of the antecedent cannot be ensured to be consistent. We can analyze the SHRUTI model in terms of description levels in order to assess its relation with respect to other models. This type of analysis is a commonly used method in life
53
CHAPTER 2. BACKGROUND sciences, adopted by many researchers in the neural network field, as well (Marr, 1982; Feldman, 1990; Valiant, 1994). We specifically adopt the five-level description of Feldman and Bailey (2000). The SHRUTI model can be seen at the connectionist level with special computing elements. To implement a model from this level, one may translate to a computational neural level and subsequently to a description on neural hardware. Another model, the neuroidal framework of Valiant (1988, 1994), being at a computational neural description level, is interesting for providing a suitable low-level substrate to implement SCMs such as SHRUTI. Among others, common mechanisms such as employing temporal binding, makes the two models suitable candidates for collaboration. Shastri (1988, 2001), in accordance with this view, independently proposed using recruitment learning to acquire the structure for their models.
A Computational Model Valiant (1994) wanted to model the brain with a general computational model. He adopted principles in computational theory for understanding and modeling cognition, since the former have been invaluable in design and analysis of a large body of computational models in the past decades. In accomplishing this goal, he viewed the cognitive architecture as a whole from psychological behavior to biological data, and proposed a computational formalism that can work with the given hardware and resource bounds. Valiant’s cognitive architecture was accompanied later by logical formalisms (Valiant, 1995, 2000b). He shows that the framework can address a number of significant problems of the AI field, such as nonmonotonic reasoning. Valiant uses the resource and hardware constraints implied by the known cognitive systems to his advantage, to restrain the freedom in choosing model parameters to a manageable amount. Some of these major constraints can be summarized as follows:
54
CHAPTER 2. BACKGROUND Regarding the speed of processing, neurons are slow (maximum 10 spikes per second), but processing is fast (response within few 100 ms, that no current computer can achieve); very few bits of information are transported between computational elements (neuronal spikes are stereotypical); and computation is massively parallel in stark contrast to the single processor paradigm of the von Neumann machines. Many of these constraints are common sources of motivation for Shastri’s model, as well. Valiant’s neuroidal model is mostly a technical description at the computational level. It can also be seen as providing functional descriptions at places intended to satisfy a neural implementation. In doing this, Valiant specified an environment like a programming language where one can model cognitive functions. Valiant (1994) fortified the recruitment learning mechanism with results from the field of random graphs. There are other researchers who also showed interest in drawing similarities between cortical networks and random graphs. Bienenstock (1996), being one of these, suggests that the connection topology of the human brain is most similar to that of a random graph, due to reasons of the graph-theoretic measure of dimensionality and reasons from a cognitive developmental aspect. Together with Valiant, Gerbessiotis (1993, 2003) showed that recruitment learning can be used for inferences up to four levels deep and rigorously formalized the expected size of the recruited set. However, these results only apply asymptotically when the number of neurons in the network tends to infinity. Valiant also introduces a reflexive reasoning mechanism that operates on the network as part of the model. Principles for representing relational concepts and employing reflexive reasoning to achieve a broad range of simple cognitive tasks are similar to the SHRUTI of Shastri and Ajjanagadde (1993). In summary, the predecessors of the ideas of concept representation and composition
55
CHAPTER 2. BACKGROUND features of the Valiant’s neuroidal model can be traced as shown in Figure 2.7.
2.4
Our Approach
Our approach in this thesis aims to complement Valiant’s attempt to define a neuroidal model, and shares his motivations, in the sense of providing a computational substrate capable of cognitive functions, and one which is suitable for implementing SCMs such as Shastri’s. It can be seen as a unified hybrid neural model (Wermter and Sun, 2000b), because we symbolically interpret the circuits of our neuroidal network. We elaborate on the model and analyze certain principle problems. As a starting point, we investigate the effect of delayed lines on converging direct-indirect pathways on the synchronization requirement of proposed mechanisms. Delays are employed since they are artifacts of any kind of realistic theory or implementation. We believe that it would be a significant refinement, if properties of signals that indicate temporal binding is maintained as they travel a multiple-stage cortical path, that may also improve the limitations of other architectures. For instance, the SHRUTI architecture was reported to be capable of drawing inferences of only a few stages of propagation deep before losing synchronization (Shastri and Ajjanagadde, 1993; Shastri, 1999a). To investigate the effects of delays, a more biologically realistic neuroidal model is employed, by translating the discrete-time recruitment model to continuous-time, in order to profit from research and data with spiking neural models. We aimed to assess the theoretical bases of maintaining temporal binding in a minimal multi-stage architecture that exhibits a principal threat to synchronization (Günay and Maida, 2001, 2002). Then, simulations were run to test the hypotheses put forth (Günay and Maida, 2003a,b,c,d). These simulations feature Valiant’s neuroidal model augmented with mechanisms and neural algorithms. 56
CHAPTER 2. BACKGROUND Our second major concern is improving the stability of the recruitment learning procedure. Recruitment learning becomes unstable when it is used to recruit a chain of concepts in cascade. The size of recruited sets becomes increasingly perturbed due to the statistical variance of its expected value. We proposed a mathematical boost-and-limit model to improve the stability of recruitment, and verified the applicability of this method with a rudimentary software model in a spiking neuroidal net simulator (Günay and Maida, 2002). We then proposed a biologically supported mechanism that may serve to implement the previously proposed boost-and-limit method in neural hardware. This model also offers the advantage of recruiting multi-place conjunctions that were difficult with the original recruitment learning mechanism. In this context, we attempt to provide solutions using the properties of such models, using for instance, inherent delays, inhibitory effects, and other mechanisms.
57
Chapter 3 Recruitment Learning with the Neuroidal Network 3.1
Introduction
This section describes the recruitment learning procedure. The following subsections progressively build the context of the recruitment learning simulation for later sections. §3.1.1 starts by giving a brief summary of the key points of recruitment.
3.1.1
What is Recruitment Learning?
Briefly, recruitment learning is a scheme for allocating on demand representations for new concepts (Feldman, 1982). The key feature of recruitment learning is that it operates within a static random graph. Vertices in the graph correspond to neural units that participate in representing concepts. The recruitment learning method addresses the question of how localist concepts might be allocated in a graph structure like the brain. The method allows for novel concepts representing conjunctions of concepts to be allocated by synchronous 58
CHAPTER 3. RECRUITMENT LEARNING WITH THE NEUROIDAL NETWORK stimulation of existing concepts. These existing concepts, upon stimulation, coincidentally activate units where signals converge due to random interconnections. The two points to emphasize in recruitment learning are random connections and synchronous activity, both of which have some biological support (Wickelgren, 1979; Feldman, 1982; Valiant, 1994). Recruitment is an unsupervised learning method. However, once concepts are acquired through recruitment, supervised learning methods can be used to associate related concepts (Valiant, 1994). Recruitment can be accomplished with a single example, therefore allowing one-shot learning. Novel concepts are added to the system only if necessary, similar to the adaptive resonance theory (ART) model Carpenter and Grossberg (1987). The latter is an important feature that distinguishes recruitment from the monolithic nature of standard artificial neural networks. This summary is intended to stand as a starting point and we illustrate the procedure in the following subsections. §3.1.2 introduces Valiant’s neuroidal architecture employing recruitment learning. §3.1.3 describes how we organize our network differently from Valiant’s simple random network to test toleration and segregation. §3.1.4 describes the type of neural representation that is employed. §3.1.5 makes the relation to temporal binding explicit. §3.1.6 gives a simple example to illustrate recruitment. This example is revisited in §3.1.7 to analyze the inner workings of the network during recruitment.
3.1.2
A Neuroidal Architecture
Valiant (1994) describes recruitment learning in the framework of his neuroidal architecture. In its simplest form, the neuroidal network is formed by a simple random interconnection network as seen in Figure 3.1(a). Each node represents a neuroid which is the elementary building block of the network.
59
CHAPTER 3. RECRUITMENT LEARNING WITH THE NEUROIDAL NETWORK
NTR
(a) Random interconnection network of neuroids which does not yet store any information. Also known as the neuroidal tabula rasa (NTR). Inputs
Weights
0
1
0
1
0
1
Output
No firings
P
Initial State
A
T =∞
1 0
T =∞
p
State:
(b) The LTG of the neuroid.
Memorized State
p: potential (net input)
(c) State machine of the neuroid.
Figure 3.1: Valiant’s neuroidal network.
60
M
T : threshold p T)
(f )
δ(t − tj )
Figure 3.6: Circuit equivalents for the SRM components. (Left) A synapse, and (Right) the membrane. VCCS stands for a voltage controlled current source. first k units to fire and be allocated for a given target concept (also called a k-WTA). The limit imposed on the recruited set is the replication factor, r, discussed earlier. Using a WTA for maintaining recruitment stability in a network has been proposed earlier by Shastri (2001). Also, a similar WTA mechanism for separating assemblies representing items in spiking associative memories has been proposed by Knoblauch and Palm (2001). Notice that the increase proposed for the connection density determines the properties of the static network and the density need not change dynamically.
3.2
Definitions and the Spiking Neuron Model
Formal definitions for the neuroidal network is given in the appendix §A.1.
3.2.1
The Spike Response Model
The SRM we employ is based on an integrate-and-fire (I/F) model. The SRM is equivalent to the standard I/F model with appropriate parameter selections (Gerstner, 1999). In the model employed here, a synapse is modeled as a low pass filter and the membrane as an RC couple as seen in Figure 3.6.
70
CHAPTER 3. RECRUITMENT LEARNING WITH THE NEUROIDAL NETWORK The approximate time response of the membrane potential is (f )
pi (t) = ηi (t − ti ) +
X X
(f )
wji �ji (t − tj )
(3.4)
j∈Γi t(f ) ∈F j j
where η(·) is the refractory kernel and �(·) is the excitatory synaptic kernel, given in Eq. (4.2). Notice that there are no differential equations to integrate in using the SRM kernels. This is because the time response of the system is used instead of frequency dynamics, and hence the name “response model.” The time response for the membrane potential in (3.4) is obtained by using the exact solution of the differential equations for the effects of single spikes and approximating the interaction inside and between neurons.
3.2.2
Pros and Cons of Using a Spiking Model
We prefer using spiking neurons because of the following reasons: • They are richer and have more features (e.g., spikes allow using temporal binding, modulators and ion channels serve different purposes not found in ANNs, etc.) • Easier to implement in parallel hardware since electrical equivalent circuits can be given and neurons are independent as opposed to centralized matrix operations required by ANNs. • Better suited to modeling neuroscientific, biological, and psychological data. However, there are also disadvantages of using spiking neuron models. Spiking models, being more complex, require more sophisticated simulation environments, and they are computationally expensive. Yet the SRM saves some computation time by allowing larger step sizes. This is because the integrated time responses are used instead of differential equations which often need very fine step sizes for maintaining their accuracy. 71
CHAPTER 3. RECRUITMENT LEARNING WITH THE NEUROIDAL NETWORK 3.3
Simulator Software and Tools Used
We use a JAVA simulator, N EUROID N ET, for conducting experiments. We choose JAVA because it is a flexible object-oriented low-level language (Gosling et al., 2000) as contrasted to imperative high-level languages like M AT L AB (http://www.mathworks.com). JAVA is platform independent and has a standard library, reasons which are important for sharing ideas and results in an academic research environment. Some distinctive features of our simulator are: • Uses B EAN S HELL (Niemeyer, 2001), a JAVA scripting environment for source-level user interaction. This allows flexible debugging of our simulations. • Allows distributed processing for simulations using the JAVA RMI library (Downing, 1998). • Introduces a grapher independent plotting library in JAVA that allows graphs to be visualized using either M AT L AB or GNUP LOT (http://www.gnuplot.info). This helps the researcher to concentrate efforts on the simulator rather than on providing visualization. The visualization is left to the capabilities of external programs seamlessly launched within the simulator application. Other tools we use for this research include but are not limited to: • M AT L AB for prototyping: Transfer function of a synapse and its effect on the membrane potential for input current in the complex frequency domain,
F (s) =
V (s) = 2 I(s) s +
1 τs Cm τm +τs +Rm Cs s τm +τs
+
1 τm +τs
,
can be linearly summed for finding final membrane potential profile in S IMU L INK. • GNUP LOT and M AT L AB for plotting results using our JAVA grapher library. 72
CHAPTER 3. RECRUITMENT LEARNING WITH THE NEUROIDAL NETWORK • HS PICE for validation of electrical circuit models. An overview of the software design is given in the appendix §B.
73
Chapter 4 Robust Recruitment over Delayed Lines 4.1
Timing Issues in Recruitment
So far we have explained the simplest recruitment learning algorithm. We showed that this algorithm depends implicitly on temporal binding. Some problems with timing arise when certain learning conditions are considered with temporal binding, such as hierarchical learning and learning in direct/indirect connection topologies with delays.
4.1.1
Timing in Hierarchical Learning
The phase-coding approach for temporal binding suggests that activity pertaining to different objects occurs in separate phase windows. From the aspect of hierarchical learning, evaluating a higher-level concept composed of the conjunction of two lower-level objects that occur in different phases requires detecting the conjunction of temporally separate events. This forces us to extend the meaning of temporal binding. Consider the example shown in Figure 4.1. On the left, a hypothetical connection circuit in the brain is shown. The right hand side shows the timing in activity in the circuit nodes. 74
CHAPTER 4. ROBUST RECRUITMENT OVER DELAYED LINES
Figure 4.1: Hierarchical learning example. (Left) Structure of concepts. (Right) Time profile of activity. The circuit represents the neuroidal substrate that integrates the features in a visual scene. There are two objects in this scene: A blue square and a green circle. Since we assume temporal binding, both objects are attended to by the brain during separate phases. The first object attended to at phase t = 1 has blue and square active simultaneously. You can see the blue square detector unit (b&s) is also active in the same phase on the time profile on the right. At phase t = 2, the same happens for the green circle object. Having constructed the lower-level primitives of the perceived scene, assume that, a concept that represents the whole scene is needed. That is, a node should represent “the scene with a blue square and a green circle.” Notice from the figure that such a node cannot depend on detecting simultaneous activity at its inputs because the b&s and g&c units are active at
75
CHAPTER 4. ROBUST RECRUITMENT OVER DELAYED LINES separate phases, with no overlapping activity. Intuitively as a solution, it can be suggested that the scene detector unit observes activity in adjacent phases during an interval and gives a decision. This can be justified by claiming that different levels of cognitive activity work at different speeds. In this case, while a primitive feature binding happens fast, the scene can only be perceived after all objects are scanned. The idea here is motivated by and consistent with other proposals (Valiant, 1994, Ch. 11). Such a scenario is solved in Valiant’s architecture by detecting timed conjunctions. These are conjunctions of inputs that appear at different times. Valiant examined forming hierarchical structures when a recruitment-style learning algorithm is employed. In particular, each level of hierarchy is shown to be slower than the previous one by a factor of the number of objects allowed. In our case, there were two objects which imposes that the scene recognition unit waits for both objects. In general, the operation of the scene unit has to accommodate as many objects that need to be represented. Valiant showed that, for m possible objects, and a base τ0 time window for synchrony at the lowest level, a new level needs a τ1 = mτ0 time duration to integrate results from the previous level. In general, this becomes τi = mτi−1 = mi τ0 for a level i. Newell (1990) has also proposed many time scales to explain different cognitive phenomena across levels.
4.1.2
Delays in Converging Direct/Indirect Pathways
We proceed to explore further cases which require timed conjunctions. So far, we ignored delays in our examples for simplicity. However, a realistic system should at least consider or maybe depend on unavoidable delays in its components and transmission lines. We treat both kinds of delays similarly and study them by focusing on one exemplar case containing varying length converging pathways as shown in Figure 4.2. In this case, a tolerant
76
CHAPTER 4. ROBUST RECRUITMENT OVER DELAYED LINES
Source
Destination
Intermediate
Figure 4.2: Direct/indirect pathways from a source converging at a destination. way of conjoining is needed for integrating signals covering different length pathways before coming to the final destination due to varying delays (Günay and Maida, 2001). This specific situation is addressed in (Valiant, 1994, Ch. 5), where the following approaches were discussed: • Ignoring this case by assuming that all paths converging from a source to a destination are of equal length, or • Having peripheral systems which can provide persistent firings until computations terminate. Our work follows the second proposal by defining the peripheral systems that help computations in these structures.
4.1.3
Detecting Temporally Separate Coincidences
The hierarchical learning scenario shows the difficulty in passing information across time scales. The difficulty is in detecting activities that appear for a duration shorter than the higher-level time scale, and which do not overlap in time. The no-overlap problem also appears in the case of direct-indirect connection topologies with delays. Without simultaneous activity, the net input of a neuroid cannot provide the information for detecting the desired timed conjunctions. That is, without memory of the past, the state machine we proposed for recruitment learning in §3.1.7 cannot handle timed conjunctions. 77
CHAPTER 4. ROBUST RECRUITMENT OVER DELAYED LINES
(a) By increasing spread of activity for each spike.
(b) By persistent firing with a fixed spread of activity.
Figure 4.3: Possible solutions for tolerant conjoining by changing behavior of high-level concept representations. Two possible solutions can be proposed to the problem of tolerant conjoining temporally separate but related activity, or timed conjunctions. The first, seen in Figure 4.3(a), is by increasing the spread of the activation on the membrane caused by inputs, at the unit representing the high level concept. Since the activity on the membrane is long enough to overlap in time, the unit can detect simultaneous activity to learn the features of the scene. The second method, seen in Figure 4.3(b), is by persistent or repetitive firing of units representing the low-level concepts. In this case, the inputs need to fire repetitively until an overlapping effect is caused on the destination higher-level concept. Both solutions are based on the same principle of causing overlapping activity to be detected at the target unit, only differing in implementation. In this work, we only consider the first method of increasing the spread of activation at the destination membrane. We assume the default effect of spikes on the membrane give the desired behavior at no extra computational cost. Implementing the second method would have 78
CHAPTER 4. ROBUST RECRUITMENT OVER DELAYED LINES required an external controller.
4.1.4
Defining Peripherals for Timing with Delays
When delays are considered, tolerant conjoining is needed for simple conjunctions even within the same time scale. Consider the example shown in Figure 4.4 with two objects, similar to the previous example. Each object now has three features; shape, color, and movement type. We assume that the shape information needs an additional level of processing than the movement needs. Even though this lacks direct biological evidence, it is known that the movement is perceived faster through the magnocellular pathways in the visual system. The increase in the transmission speed in the magnocellular pathway is due to the larger axons. A direct connection line may model this increased speed in transmitting movement information. When the subject attends to the shaking blue square object, all three inputs are available simultaneously at t = 1. The blue square detector will only become active after a delay from this time (a unit delay for simplicity), thus requiring tolerant conjoining with shaking input. The main aim of this example is to introduce another constraint, the phase segregation parameter. In multiple object scenes tolerance should be limited to avoid crosstalk with the next object attended. On the one hand, if tolerance is too long, successively attended objects will crosstalk. On the other hand, if tolerance is too short, the system will suffer from limited speed of processing due to inefficient use. An optimal setting is possibly maintained dynamically by the brain. Therefore in the figure, shaking blue square (sh. bl. sq.) should not tolerate any signals arriving after t = 2, or it will result in spurious detections. Next, we define constraints on formal tolerance and segregation parameters for overcoming the problems described here.
79
CHAPTER 4. ROBUST RECRUITMENT OVER DELAYED LINES
Figure 4.4: Recruitment example with delays and direct/indirect connections.
80
CHAPTER 4. ROBUST RECRUITMENT OVER DELAYED LINES 4.2
Defining Measures of Tolerance and Segregation
This section extends the constraints on the tolerance and phase segregation parameters presented earlier for maintaining object coherency with respect to temporal binding (Günay and Maida, 2001). For a given connection topology with converging inputs over pathways of varying delays, two requirements were studied: one for the duration of the tolerance window Γ, and a second for the duration of the phase segregation parameter Φ. We first consider the tolerance constraints. Definition 4.2.1 A tolerance window Γi , for a neuronal unit xi , is the longest time duration, or interval, during which the unit can integrate a train of incoming spikes that all contribute to emit a single action potential (AP). The unit is said to delay-tolerantly conjoin the inputs received during this interval. In this work, Γi does not change for different units; therefore, we simply use Γ. Definition 4.2.2 A neuronal unit x, is said to cover a set of distributed sources only in case all synchronized spikes at those sources arrive within the interval Γ. Lemma 4.2.3 Let neuronal unit x receive incoming signals from a set of distributed sources at varying distances. x covers this set of sources if
Γ ≥ dmax − dmin ,
(4.1)
where dmax and dmin are the longest and shortest transmission delays from the sources, respectively. We first employ a simple model, where the effect of an incoming spike on the membrane potential is a discrete pulse with constant magnitude.
81
CHAPTER 4. ROBUST RECRUITMENT OVER DELAYED LINES Theorem 4.2.4 Delay-tolerant conjoining of two disparate spikes from sources covered by a neuroidal unit xi is possible, if each spike causes a Γ-long constant potential of magnitude P on the membrane pi . Proof. Let the first spike reach xi at time t1 and second spike at time t2 , where t2 − t1 ≤ Γ according to Def. 4.2.2. Potentials caused by the disparate spikes on the membrane pi would overlap for some interval 0 < I ≤ Γ. Since xi is an LTG, the net input pi will reach 2P during the interval I. A threshold T can be set to detect the sum of the overlap value and ignore non-overlapping spikes by choosing P < T < 2P . Crossing the threshold can cause an AP and trigger the recruitment of a concept representing the conjunction, satisfying Def. 4.2.1. �
4.2.1
Implementing with a Continuous-time Model
Thus far, we used a discrete-time model, consistent with the original proposal for recruitment learning. This was also the case in the previous examples used for illustration, where we employed unit delays. However, considering timing dynamics of the brain, unit delays and discrete models can only provide a coarse approximation. A simple integrate-and-fire (I/F) spiking neuron model is more appropriate. For computational reasons we employ the spike response model (SRM) of Gerstner (1999, 2001). This model naturally allows delay-tolerant conjoining of disparate signals by generalizing Thm. 4.2.4, relying on increasing the spread of higher-level concept activation discussed in §4.1.3 (see Figures 4.3(a) and 4.5). Using the SRM, a tolerance window for direct/indirect connection topologies can be implemented by adjusting the length of the EPSP on the destination neuroid membrane. This allows lagged spikes to have an overlapping effect on the destination membrane that can be detected with a threshold device as depicted in the figure. Here we attempt to find constraints for the SRM EPSP, in order to assess its parts which are significant for tolerance or 82
CHAPTER 4. ROBUST RECRUITMENT OVER DELAYED LINES
1
Γ
Threshold
0.8
Direct
∆+τs
Temporal summation
∆+τm
potential
0.6 0.4
Indirect
Γ
Direct spike
Indirect spike
0.2
0
10 20
t (msec)
0 0
(a) Initially synchronous signals cross direct and indirect pathways, and arrive early and late, respectively. The Γ-long shaded window duration needs to be tolerated.
5
10
15 20 time (msec)
25
30
(b) The 10 ms tolerance within the shaded window can be demonstrated with SRM neurons. Early and late arriving spikes cause overlapping excitatory post synaptic potentials (EPSPs) that sum to exceed a detection threshold. Obviously, non-overlapping EPSPs do not reach this threshold.
Figure 4.5: SRM helps tolerate delayed signals. segregation. This is similar to the study of Shastri (2001) to discretize an EPSP to three regions; a rising part, a plateau, and a decaying part. This allows making formal claims. In the SRM, an EPSP caused by a single spike at t = 0 and an axonal delay ∆ax i is given by the kernel � � � 1 t − ∆ax i �i (t) = exp − 1 − τs /τm τ � �� m ax t − ∆i − exp − H(t − ∆ax i ) τs
(4.2)
where H(·) is the Heaviside step function, τs is the synaptic rise time constant, and τm is the membrane time constant. The rise and decay behavior of (4.2) depend respectively on the τs and τm parameters as shown in Figure 4.6 (Gerstner, 1999). We then propose parameters for implementing the tolerance window. For delay-tolerant conjoining, a neuroid should emit an AP when the effective parts of two EPSPs caused by
83
CHAPTER 4. ROBUST RECRUITMENT OVER DELAYED LINES 0.5 0.4
potential
0.3
∆+τs
Γ
0.2 ∆+τm
0.1 0 0
5
10
15 20 time (msec)
25
30
Figure 4.6: Shape of a SRM EPSP. separate incoming spikes overlap, whereas the EPSP caused by a single spike should not to cause an AP. The following definition is intended to restrict the SRM to satisfy these necessary conditions. Definition 4.2.5 An effective window is a time range t ∈ ω within the EPSP, where �i (t) > 0.5 maxt0 �i (t0 ). The maximum value of �(t) depends on the parameter selection of τs and τm , therefore we write �ˆτi s ,τm = max �i (t0 ) . 0 t
Theorem 4.2.6 Delay-tolerant conjoining of two disparate spikes is possible with a neuroidal unit xi employing the SRM, if a Γ-long effective window ω can be chosen. Proof. Proof of Thm. 4.2.4 applies when P = �ˆτi s ,τm . The effective windows from the two spikes would overlap during an interval I. Thus, a threshold T can be chosen to detect the overlap value with P < T < 2P .
�
The part of the SRM EPSP effective for tolerant conjoining can be given with a time range defined by a pair of lower and upper bounds. ax Theorem 4.2.7 The region t ∈ [∆ax i + τs , ∆i + τm ] is an effective window of �i (t).
84
CHAPTER 4. ROBUST RECRUITMENT OVER DELAYED LINES
Parameter range for the effective window 1 0.9 0.8 0.7 0.6 0.5 �(∆ + τs )/ maxt �(t) �(∆ + τm )/ maxt �(t)
0.4 0.3 0
0.1
0.2
0.3
0.4
0.5
0.6
0.7
0.8
0.9
1
τs /τm
ax Figure 4.7: Numerical analysis of �(t) at the boundaries of the region t ∈ [∆ax i + τs , ∆i + τm ]. We are interested in finding an appropriate parameter selection for τs and τm that satisfies the condition �(t) > 0.5ˆ�τi s ,τm for the definition of the effective window. The solid line showing the time t = ∆ax i + τs indicates that the condition is satisfied independent of the parameter ratio τs /τm . However, for dashed line showing t = ∆ax i + τm , the effective window condition can only be guaranteed when τs /τm > 0.1. It can further be shown that the value of �(t) within the boundaries is always greater than the values at the two boundaries.
Proof. Numerical analysis of �i (t) in (4.2) within the given region satisfies Def. 4.2.5 when 0.1 < τs /τm < 1 (cf. Fig. 4.7 ).
�
This theorem can be interpreted as that τm needs to be long enough to include the rising time τs before the effective magnitude of the EPSP is reached (see Fig. 4.5). Assuming that the rise time τs is constant, and the membrane time constant τm can be varied by biological processes that modify the membrane conductance, we offer the next corollary. Corollary 4.2.8 Delay-tolerant conjoining can be achieved if the membrane time constant1 is chosen as τm = τ s + Γ .
85
(4.3)
CHAPTER 4. ROBUST RECRUITMENT OVER DELAYED LINES 4.2.2
Phase Segregation
The second requirement for temporal binding concerns the phase segregation measure for separating activity pertaining to different objects. Definition 4.2.9 Phase segregation Φ is the time separation between the synchronized activity pertaining to two different objects represented successively. We first employ a discrete model as in Thm. 4.2.4 for delay-tolerant conjoining, for asserting that tolerance windows are exclusive to each object. Theorem 4.2.10 Segregation should obey Φ > 2Γ, to prevent crosstalk between elementary features of different objects at a neural unit x covering the sensory sites for these features. Proof. Let S1 , S2 be the sets of spike timings pertaining two successively presented objects o1 , o2 , respectively. Assume, for t0 , t1 ∈ S1 , the earliest spike arrives at t0 = ∆1 , and the latest spike arrives at t1 = ∆1 + Γ. According to Thm. 4.2.4, the effect of a spike arriving at t1 will cause a constant potential until t1 + Γ. Thus, the earliest t2 ∈ S2 can arrive at t2 > ∆1 + 2Γ. According to Def. 4.2.9, the segregation is the difference between the originating times of spikes pertaining to each object, yielding Φ = (t2 − ∆1 ) − (t0 − ∆1 ) > 2Γ .
�
Informally, if each spike has a Γ-long spread on the destination membrane, then the latest arriving spike at the end of the tolerance window will be effective for another Γ amount. The next tolerance window cannot start until the effect from this previous spike has ended. After defining requirements for segregation in the discrete model, we generalize for the spiking model. Tolerant conjoining should apply to spikes emitted during a tolerance window, 1
An refinement is made to the earlier paper (Günay and Maida, 2001) where it was proposed that τm = Γ is sufficient.
86
CHAPTER 4. ROBUST RECRUITMENT OVER DELAYED LINES
Parameter range for the effective window 0.8 0.7 0.6 0.5 0.4 0.3 0.2
�(∆ + 2τm )/ maxt �(t)
0.1 0
0.1
0.2
0.3
0.4
0.5
0.6
0.7
0.8
0.9
1
τs /τm
ax ax Figure 4.8: Numerical analysis of �(∆ax i + 2τm ) at the end of the region t ∈ [∆i , ∆i + 2τm ]. We are interested in finding an appropriate selection of the parameters τs and τm that does not satisfy the condition �(t) > 0.5ˆ�iτs ,τm for the definition of the effective window. The data in the figure shows that the condition fails when τs /τm < 0.5. It can be further shown that the value of �(t) always fails to satisfy the effective window condition when t > ∆ax i + 2τm .
but not spikes emitted in two different tolerance windows. We again restrict the SRM EPSP to satisfy these conditions to give a reciprocal of Thm. 4.2.6. Lemma 4.2.11 Delay-tolerant conjoining of separate groups of spikes pertaining to different objects is possible at a neuroidal unit xi employing the SRM, if no effective windows of EPSPs from spikes pertaining to different objects overlap in time. The part of the SRM EPSP excluded from tolerant conjoining can be given with a time range. Theorem 4.2.12 There is no effective window in the region of �i (t) outside the time range ax t ∈ [∆ax i , ∆i + 2τm ].
Proof. �i (t) = 0 for t < ∆ax �τi s ,τm for i , and numerical analysis shows that �i (t) < 0.5ˆ t > 2τm when τs /τm < 0.5 (cf. Figure 4.8 ).
�
Notice that the above theorem can be further optimized. We then give the segregation measure adopted for use with the SRM to achieve the effect depicted in Figure 4.9.
87
CHAPTER 4. ROBUST RECRUITMENT OVER DELAYED LINES 1.5 ∆+τs
potential
1
Γ
Φ
Threshold
0.5
0 0
20
40 time (msec)
60
80
Figure 4.9: Phase segregation of SRM EPSPs. Two sets of spikes pertaining to two separate objects are depicted. Shaded areas show the effective windows of the EPSPs that form the tolerance windows. Theorem 4.2.13 The segregation for the SRM should obey
ΦSRM > Γ + 2τm = 3Γ + 2τs .
(4.4)
Proof. Using t0 , t1 ∈ S1 from proof of Thm. 4.2.10, the arrival time of the earliest spike t2 ∈ S2 should be outside any effective windows pertaining to o1 . According to Thm. 4.2.12, t2 > t1 + 2τm should be satisfied in order to avoid overlaps. This yields ΦSRM = (t2 − ∆1 ) − (t0 − ∆1 ) > t1 + 2τm − t0 = ∆1 + Γ + 2τm − ∆1 .
�
Corollary 4.2.14 The amount of segregation predicts the maximal firing frequency of the destination neuroid by f < 1/ΦSRM . Phase segregation or desynchronization can be implemented by having a globally inhibitory projection (Schillen and König, 1994; Lisman and Idiart, 1995; Terman and Wang, 1995; Günay and Maida, 2001), which suppresses the source units for the duration of an inhibitory time constant τi = ΦSRM .
88
CHAPTER 4. ROBUST RECRUITMENT OVER DELAYED LINES 4.2.3
State Machine for Continuous-Time Neuroids
The recruitment learning algorithms we discussed earlier are based on discrete sampling times. It turns out that finding a simple way to upgrade the existing discrete-time algorithm is difficult. This is because in a continuous-time system there is no fixed sampling time but a changing continuous value. We decided to use another state machine that operates on continuous parameters seen in Figure 4.10 that determines the sampling time for the existing discrete-time recruitment algorithm. This proves to be a very elegant and simple way to upgrade the existing discrete-time model, without obscuring it with continuous-time parameters. This state p0 ≤ 0/− Q
p0 > 0/−
p0 > 0/−
R
p0 > 0/− p0 = 0/1
P
p0 < 0/−
Figure 4.10: New continuous-time state machine working in conjunction with the discrete-time state machine for recruitment. The three states are; Quiescent (Q) for no activity on potential, Rising (R) when potential is increasing, and Plateau (P ) when a local maximum is reached. Sampling time is set by the transition R → P . machine detects peaks (local maxima) of neuroid’s membrane potential p according to its derivative p0 , thereby providing the sampling time for the discrete-time learning algorithm (see Figure 4.5). In this way, we have a simple addition to the system and we can use the previously defined discrete-time machine without modification. As summary, the transition R → P in the continuous state machine in Figure 4.10 triggers the discrete-time state machine in Figure 3.1(c). Using a system with discrete and continuous parts together is sometimes termed a hybrid approach. 89
CHAPTER 4. ROBUST RECRUITMENT OVER DELAYED LINES 4.3
Methods and Results
The hypotheses from the previous section make the prediction that the lower bounds calculated for each of the tolerance and segregation parameters should give acceptable performance. The calculation of the parameters depends, as previously discussed, on the connection topology of the circuit. Simulations are conducted to test this prediction. Furthermore, in order to assess the correctness of the recruitment method independent of the timing hypotheses, we test the network for correct storage of multiple concepts. Recruitment learning makes predictions about the maximal capacity of the network. The tests are conducted by presenting a sequence of hypothetical perceptual objects to the system in each simulation (cf. Figure 1.3(b)). The number of objects, tolerance and segregation parameters are varied between different simulation runs. Hundreds of simulations are run to collect statistical data for each test, since both the connections within the network, as well as the feature combinations for objects are chosen from a uniform random distribution in each simulation. Details of the methods are given in subsequent sections for each of the specific tests. The performance of a simulation is evaluated by observing the network’s internal organization. We expect to find, at the final layer, units recruited to represent the hypothetical objects presented at the input layers as a combination of features. Each of the concepts for elementary features is represented redundantly with a replication factor of r = 10 neuroids (discussed in §3.1.4). In turn, each of the recruited concepts for intermediate representations, and for the objects that occur at the final layer, is expected to have roughly r neuroids. If all assemblies representing concepts at the final layer are allocated r neuroids as expected, the predicted maximal capacity of a network can be defined as follows. Definition 4.3.1 The maximal capacity of a network for recruitment learning is N/r, where 90
CHAPTER 4. ROBUST RECRUITMENT OVER DELAYED LINES N is the total number of units available, and r is the replication factor. In the simulations, N is the number of units present in the final destination area of the network. This area is where all paths converge and final concept assemblies appear in the simulation testbed, as described further in §4.3.1. Theoretically, the maximal capacity of the network cannot be achieved easily. As the network is populated with concept assemblies, fewer neuroids will be available for recruitment for new concepts. Thus, the probability of finding random connections to the few available neuroids left will be lower. Nevertheless, simulations indicate that the assumption about recruiting r neuroids for each final concept may not always hold, which causes the network capacity to be higher than expected. Successful recruitment depends on both the timings within the neural circuits and the statistical properties of the random graph projecting across the areas. The simulations explore whether the proposed parameter values actually yield this desired performance. In the simulations, successful recruitment provides evidence that both subsystems, timing and recruitment, are working correctly. To test the success of the binding scheme employed, the artifacts of binding errors are investigated. The binding errors cause perception of illusory conjunctions among features of separate objects and result in the appearance of spurious concepts to be recruited in the network. Therefore, the quantitative performance measure for a network is given by the quality of both correct and spurious concepts that were formed at the end of the simulation, for providing a comparison. The relative magnitudes of quality can indicate if a threshold can be set to distinguish the correct concepts from spurious ones. For instance, this threshold can be in the form of a winner-take-all mechanism. We assume this is a necessary condition for the network to perform correctly. We define the quantitative measures as follows. To assess the quality of a single object,
91
CHAPTER 4. ROBUST RECRUITMENT OVER DELAYED LINES we give the following definition. Definition 4.3.2 Let the quality measure for an object i represented in the network be
qi =
ci , r
where ci is the number of units allocated for the object. The quality qi of an object i is maximally 1, if r units are allocated to represent it, and minimally 0 if no units represent it. In order to evaluate the set of correct or spurious concepts in a simulation, we define the aggregated quality of a set of objects as follows. Definition 4.3.3 Let the aggregated quality of an object set O be
Q=
1 X qi . |O| i∈O
(4.5)
We can now use (4.5) to calculate the aggregated qualities Qc and Qs using the object sets Oc and Os , for correct and spurious objects, respectively.
4.3.1
Testbeds for Observing Timings
The framework for the simulation testbed consists of choosing a number of input Ii and middle Mi areas as seen in Figure 4.11, where i = 1, . . . , k, and k ≥ 2. Signals appear synchronously at input areas as the system attends to a sensory stimulus corresponding to a perceptual object. Synchronized signals representing each object are presented to the network successively, segregated by the interval ΦSRM calculated according to Eq. (4.4). Indirect pathways are created by the signals crossing the middle areas. All timings indicated are simulated milliseconds, and not actual time measurements. More information on the structure
92
CHAPTER 4. ROBUST RECRUITMENT OVER DELAYED LINES
Figure 4.11: The type of testbed used to measure the tolerance and segregation required for coherent representations. The middle areas serve to create indirect pathways with more synapses than the direct pathways (compare the path I2 → M2 with I1 → M2 ). The number of input and middle areas is varied for testing. of the input representations is given in §4.3.2. All areas are assumed to be monolaminar with only one synapse to cross an area. Axonal delays are designed to conform to the topological organization of the testbed, increasing linearly with distance. Therefore, the difference in pathway length (cf. Lem. 4.2.3) is caused only by synaptic delays. We vary the number of input and middle areas, k, to create larger differences in delays. If k = 2, this 2-layer topology creates a two-synapse indirect pathway compared to a single-synapse direct pathway to the destination. Therefore, for a given topology the tolerance window can be chosen as Γ = (k − 1)τs , since the shortest path always contains a single synapse. We chose model parameters estimated according to timing data from visual cortex (Nowak and Bullier, 1997; Lamme and Roelfsema, 2000). The time it takes to cross an area is assumed to be ∼ 10 ms. In turn, axonal delays are estimated to be about δ = 3 ms according to their diameter and physical distance. This leaves τs = 7 ms for the synaptic rise time (including the dendritic delays), which is a slower process than the axonal transmission. Employing these parameters, when segregation values are calculated for a 2-layer topology similar to the circuit formed by cortical areas V1, V2 and V3, we get 35 ms for segregation.
93
CHAPTER 4. ROBUST RECRUITMENT OVER DELAYED LINES The segregation value predicts the maximum oscillation frequency in this circuit to be 28 Hz, which falls within the gamma band (20–70 Hz). The activity in the gamma frequency band is suggested to be used for object representations. Each area contains N = 100 neuroids with the replication factor r = 10 for representing concepts. The connection probability of two neuroids from connected areas is given by p p = µ/rN . This probability is calculated by extending the methodology described in (Valiant, 1994) for simple random graphs. The parameter µ stands for the amplification factor. We employ µ = 6 for increasing the expectation of the set of recruited neuroids for stability reasons discussed in §3.1.8. This value is determined empirically to yield satisfactory recruitment in deep hierarchies. If it is increased further, it results in creating interference between objects and therefore causing more spurious concepts. The learning algorithm used is a multiplicative weight adjustment method2 consistent with Hebbian learning, inspired by the Winnow algorithm (Littlestone, 1991). Its state machine and parameters are designed to give a simplified model of permanent recruitment by a one-shot drastic weight modification. Recruitment can also allow creating non-permanent long-term memories via gradual weight adjustment mechanisms. Other parameters used in the simulation include the refractory reset after each spike with a 10 ms time constant. The spike threshold for the middle areas, T = 1.5P , is chosen according to the proof of Thm. 4.2.6.
4.3.2
Behavior of the Inputs and Concepts
Inputs to the network are formed by pre-allocated sensory concepts represented by assemblies of r neuroids. The sensory concepts are located in the input areas of the network. Each input area provides for the representation of a primitive sensory feature type. In turn, the sensory Very briefly, for active inputs w0 = 1.5w and for inactive inputs w0 = 0.5w weight update rules are applied at the time of recruitment. 2
94
CHAPTER 4. ROBUST RECRUITMENT OVER DELAYED LINES concepts within an area represent different values on the dimension of the specific feature type. For instance, a feature value, such as square versus circle, will be represented by sensory concepts in the shape input area. These sensory concepts are named numerically as Sij , where j is the concept number in area Ii . To model the system as it attends to a particular object whose shape, say, is circular, attentional controllers cause the circle sensory concept to be activated. When a sensory concept is activated, each of the neuroids in the assembly representing the concept emits a single synchronous spike. Attention to multi-object scenes is modeled by activating a sensory concept from each input area synchronously for each perceptual object in the scene. As an exception to this rule, two concepts need to be chosen from input area I1 , since middle area M1 is only connected to I1 , and the recruitment mechanism used here requires simultaneous activation by two separate concept assemblies. Separate objects are attended to at different times, separated by the amount of the segregation parameter ΦSRM given in (4.4). The total number of unique objects that can be represented using this scheme can be calculated by �n� 2
nk−1 ,
where n is the number of sensory concepts in each input area, and k is the total number of input areas. For the simulations in this work, n = 4 sensory concepts are allocated in each input area Ii , where i = 1, . . . , k, and 2 ≤ k ≤ 4. Thus, there are 24 and 96 possible objects to choose from, for 2- and 3-layer topologies, respectively. Assemblies representing concepts are recruited in the middle areas upon activation of sensory concepts. A new concept is labeled according to the sensory concepts that caused its recruitment. For instance, the concept recruited in in middle area M1 upon simultaneous activation of the sensory concepts S10 and S11 is labeled as S10 ∧ S11 . 95
CHAPTER 4. ROBUST RECRUITMENT OVER DELAYED LINES A simulation consists of presenting a sequence of multiple perceptual objects to the network, segregated in time. At the end of the simulation, the set of concepts created in the network is analyzed. Correct concepts are the conjunctions of the originally presented sensory concepts for each perceptual object. On the other hand, spurious concepts are all the concepts created, except the correct concepts and the anticipated intermediate concepts recruited in the middle areas.
4.3.3
Intuitions on Tolerance Window Parameter from the Simulations
Here, we describe a simulation run to illustrate delay-tolerant conjoining in the neuroids of the network. The simulation was successful when the tolerance parameter Γ was selected according to the proposed measure in (4.1) and accordingly selecting the membrane time constant τm as in (4.3). Potential [V] 2
Membrane potential of PeakerNeuroid #10 (in Area: M1)
1.5 1 0.5 0
0
10
20
30
40
50
60
Membrane potential of PeakerNeuroid #93 (in Area: M2)
2 1.5 1 0.5 0
0
10
20
30
40
50
60
Membrane potential of PeakerNeuroid #59 (in Area: M3)
3 2 1 0 −1
0
10
20
30 Time [ms]
40
50
60
Figure 4.12: Membrane potentials from a selected neuroid from each middle area, from M1 to M3 , shown from top to bottom, respectively. The resets on the membrane potential show the time of spikes emitted. The action potentials are not depicted since they are ideal Dirac delta functions in the SRM.
96
CHAPTER 4. ROBUST RECRUITMENT OVER DELAYED LINES The three profiles in Figure 4.12 show the membrane potential time profiles of a selected recruited neuroid from each middle area. This gives a graphical explanation of the progress of signals from sources Ii , i = 1, . . . , 3 to the destination M3 : 1. Initially the neuroid in M1 (profile at top of figure) receives a signal from the input area I1 . After a δ = 3 ms onset delay due to axon transmission, and τs = 7 ms synaptic rise and dendritic delay, the neuroid fires at t ∼ 15 ms. 2. A recruitment candidate in M2 (profile at middle of figure) receives a signal from the input area I2 with 6 ms onset delay and another signal from the recruited neuroids in M1 after a 3 ms transmission delay, at t ∼ 18 ms. The cumulative effects of both these signals make the neuroids fire at t ∼ 25 ms. Notice that the first spike’s effect is not sufficient to recruit the M2 candidates, even though a triggering local maximum is reached on the way (see figure and the state machine for recruitment in §4.2.3). 3. An effect similar to M2 is obtained in M3 (profile at bottom of figure). This time the effect of signals from input area I3 arrive after a 9 ms delay. On the other hand, the signals from M2 arrive at t ∼ 28 ms and neuroids are recruited and fired at t ∼ 32 ms. However, there is an anomaly in M3 worth mentioning. On close examination of the membrane potential plot, one can see that the signal coming from M2 does not raise the potential above a value higher than what has been reached by input I3 . This may seem contradictory to the tolerant conjoining described so far, which distinguished the effect of multiple inputs from the effect of an individual input, by using the potential level to discriminate between them. In this case, this may indicate that the input signal from I3 is sufficient to cause recruitment without waiting for the results of the computation coming from M2 . The reason that recruitment and spiking are not observed is because there is a recruitment limit in our simulation for maintaining the stability of recruitment. Since there are already 97
CHAPTER 4. ROBUST RECRUITMENT OVER DELAYED LINES neuroids in M2 , representing active inputs in I3 , no neuroids in M3 are allowed to join the recruitment. The artificial recruitment limit imposed by the boost-and-limit mechanism is discussed in §3.1.8.
4.3.4
Quantitative Results
In the following subsections, results are given for observing the effects of different parameter values for the number of objects presented, the tolerance window, and the segregation parameters. For each of these parameters, figures are given with simulations on varying-size network architectures. These networks are constructed with varying levels of indirect pathways as described in §4.3.1. An architecture with a two-level indirect pathway is depicted in Figure 4.11. The performance measure is the aggregated quality given by Definition 4.3.3, simply referred to as quality hereafter. In each figure, qualities for correct and spurious concepts are plotted while a parameter is varied. The graph plots the average quality value over a number of trials indicated on each figure. The variation in the quality values is displayed by showing the maximum and minimum values from the trials with the error-bar limits. In the figures, an x-axis value for the parameter varied may be marked by a dash-dotted vertical limit bar for a noteworthy value. Other network parameters employed are included in the figure legends. As defined earlier, a network is successful if the correct concept quality can be distinguished from spurious concept quality via a threshold value.
98
CHAPTER 4. ROBUST RECRUITMENT OVER DELAYED LINES
Performance with 2 Layers over 10 Trials, τ = 14
Performance with 3 Layers over 10 Trials, τ = 21
m
1 0.9
0.9
0.8
0.8
0.7
0.7
Correct concepts Spurious concepts Half capacity
0.6
Quality
Quality
0.6 Correct concepts Spurious concepts Half capacity
0.5
0.5
0.4
0.4
0.3
0.3
0.2
0.2
0.1
0.1
0
m
1
0
1
2
3
4
5
6
7
Number of Objects
8
9
0
10
0
1
2
(a) In a 2-layer testbed.
3
4
5
6
Number of Objects
7
8
9
10
(b) In a 3-layer testbed. Performance with 4 Layers over 10 Trials, τm = 28
1
Correct concepts Spurious concepts Half capacity
0.9 0.8 0.7
Quality
0.6 0.5 0.4 0.3 0.2 0.1 0
0
1
2
3
4
5
6
Number of Objects
7
8
9
10
(c) In a 4-layer testbed.
Figure 4.13: Concept quality as a function of the number of objects presented to the network. Plots show the robustness on the expected capacity of the network. See §4.3.4 for reading the plots.
99
CHAPTER 4. ROBUST RECRUITMENT OVER DELAYED LINES Network Object Capacity The quality of concepts in the network, as the number of objects presented to the network is varied, for simulation testbeds of two, three and four indirect layers are given in Figure 4.13. The maximal capacity for each topology is given as N/r (cf. Definition 4.3.1), where N is the total number of units at the final destination area. It can be seen that the approach does not scale very well with the number of indirect pathways, even though the maximal capacity is achieved for topologies with a low number of indirect pathways, such as the ones shown here. Surprisingly, the network behaves gracefully as the maximal capacity is approached. The quality of correct concepts is still distinguishable from spurious ones even for capacities at the maximal limit (see Figure 4.13).
Tolerance Window Parameter The variation in the quality of concepts in the network as the tolerance parameter is varied, for simulation testbeds of two, three and four indirect layers, is given in Figure 4.14. The tolerance parameter τm for a topology is calculated by (4.3) on page 85. As with the results on network capacity the method is successful with the architectures employed, even though the correctness performance does not scale well as the number of indirect pathways is increased. The reason is not apparent for the sudden trough on the correct concept quality of the two-layer testbed in the figure. Since the same behavior can later be seen in the two-layer network results of the phase segregation plots, we claim that it does not depend on any one of the parameters, but maybe depends on both of them. In other words, this temporary loss of quality may be due to a resonance behavior between the tolerance and segregation parameters which becomes only significant in the two-layer architecture. 100
CHAPTER 4. ROBUST RECRUITMENT OVER DELAYED LINES
Performance with 2 Layers over 10 Trials, 5 Objects
1 0.9
0.9
0.8
0.8
0.7
0.6
Quality
Quality
0.7
Correct concepts Spurious concepts Calculated τm
0.6 0.5
0.4
0.3
0.3
0.2
0.2
0.1
0.1
5
10
15
20
25
Membrane Time Constant τm
Correct concepts Spurious concepts Calculated τm
0.5
0.4
0
Performance with 3 Layers over 10 Trials, 5 Objects
1
30
0 10
15
(a) In a 2-layer testbed.
20
25
30
Membrane Time Constant τm
35
40
45
(b) In a 3-layer testbed. Performance with 4 Layers over 10 Trials, 5 Objects
1 0.9 0.8 0.7
Correct concepts Spurious concepts Calculated τm
Quality
0.6 0.5 0.4 0.3 0.2 0.1 0 20
25
30
35
40
Membrane Time Constant τm
45
50
55
(c) In a 4-layer testbed.
Figure 4.14: Concept quality as a function of the membrane time constant τm . In the simulations, the tolerance window Γ is varied, implying that τm and segregation between activity Φ (the SRM index is dropped for simplicity) is calculated according to (4.3) and (4.4), respectively. The predicted operating value of Γ is given by (4.1). See §4.3.4 for reading the plots.
101
CHAPTER 4. ROBUST RECRUITMENT OVER DELAYED LINES Phase Segregation Parameter The variation in the quality of concepts in the network as the tolerance parameter is varied, for simulation testbeds of two, three and four indirect layers, is given in Figure 4.15. The segregation parameter Φ for a topology is calculated by (4.4) on page 88. We expect the degree of the stability of network correctness increase with the segregation. However, the quality of correct concepts initially increase and then decrease. While this decrease is an undesirable effect due to a deficiency in the model, possible due to selection of SRM parameters, our calculated segregation values seem to be at an optimal operating range for the architectures tested. The decrease in the quality possibly occurs because the tolerance value is kept fixed while the segregation is increased. This reduces the interference between successive phases. Apparently, the interference causes activation effects of a previous phase to help activate the next stage without causing disruption. We report that this kind of interference can sometimes be useful rather than disruptive, even though this was not our intention. However, since we cannot guarantee when this interference is going to be useful, we cannot depend on this feature.
4.3.5
Discussion
Spurious Concepts The results we presented so far indicated that the amount of spurious activity in the network increases with the number of indirect layers. This may raise the suspicion that our calculations for the tolerance and segregation parameters do not scale up well. However, here we show that the increase in the number of spurious concepts is not due to the tolerance and segregation parameters, but it is the artifact of the recruitment learning method. Briefly, when
102
CHAPTER 4. ROBUST RECRUITMENT OVER DELAYED LINES
Performance with 2 Layers over 10 Trials, 5 Objects, and τm = 14
1 0.9
0.9
Correct concepts Spurious concepts Calculated Φ
0.8
0.7
0.7
0.6
0.6
Quality
Quality
0.8
0.5
0.4
0.3
0.3
0.2
0.2
0.1
0.1
0
10
20
30
40
Segregation Φ
50
60
70
Correct concepts Spurious concepts Calculated Φ
0.5
0.4
0
Performance with 3 Layers over 10 Trials, 5 Objects, and τm = 21
1
80
0
0
10
20
(a) In a 2-layer testbed.
30
40
50
Segregation Φ
60
70
80
90
100
(b) In a 3-layer testbed.
Performance with 4 Layers over 10 Trials, 5 Objects, and τm = 28
1 0.9 0.8 0.7
Quality
0.6 Correct concepts Spurious concepts Calculated Φ
0.5 0.4 0.3 0.2 0.1 0
0
20
40
60
80
Segregation Φ
100
120
140
(c) In a 4-layer testbed.
Figure 4.15: Concept quality as a function of the segregation amount Φ. In the simulations, the segregation Φ is varied, while the tolerance Γ and τm is kept constant at a value calculated according to (4.1) and (4.3), respectively. The predicted operating value of Φ is given by (4.4). See §4.3.4 for reading the plots.
103
CHAPTER 4. ROBUST RECRUITMENT OVER DELAYED LINES Potential [V] Synapse Activities of PeakerNeuroid #28 (in Area: M2) with Concept: S1−1, S1−0, S2−0 3 Weighted potential of Synapse #0 of PeakerNeuroid #28 (in Area: M2) from PeakerNeuroid #20 (in Area: I2) Concept: S2−0 2 1 0 0 10 20 30 40 50 60 70 80 90 Weighted potential of Synapse #4 of PeakerNeuroid #28 (in Area: M2) from PeakerNeuroid #50 (in Area: I2) Concept: S2−0 3 2 1 0
0
10
20
30
40
50
60
70
80
90
3 Weighted potential of Synapse #11 of PeakerNeuroid #28 (in Area: M2) from PeakerNeuroid #16 (in Area: M1) Concept: S1−1, S1−0 2 1 0
0 10 20 30 40 50 6Membrane potential of PeakerNeuroid #28 (in Area: M2)
60
70
80
90
60
70
80
90
4 2 0
0
10
20
30
40 50 Time [ms]
Figure 4.16: Presynaptic activities (top 3 plots) and total membrane potential (bottom plot) of a neuroid representing a correct concept in area M2 . A sensory concept Sij is written as Si-j. The neuroid represents the intermediate concept S10 ∧ S11 ∧ S20 . recruiting concepts in a cascade, if some spurious concepts appear at one stage, they cause the recruitment of more spurious concepts in further stages, based on the conjunction of the spurious concept with other legitimate concepts. Consider a simulation with a 2-layer topology. Two hypothetical perceptual objects are presented to the network at separate times. The first object is represented by the sensory concept conjunction S10 ∧ S11 ∧ S20 , and the second by S11 ∧ S12 ∧ S20 . Figure 4.16 gives the presynaptic activities and the total membrane potential for a neuroid that belong to the assembly of a correct concept S10 ∧ S11 ∧ S20 in area M2 . The figure shows 3 incoming synapses from neuroids in areas I2 and M1 . These presynaptic neuroids belong to the assemblies of concepts S10 ∧ S11 , and S20 . Note that there are two synapses from the assembly for S20 , but only a single synapse from the assembly for S10 ∧ S11 . The neuroid is recruited for
104
CHAPTER 4. ROBUST RECRUITMENT OVER DELAYED LINES S10 ∧ S11 ∧ S20 at t ' 25, when 3 synchronous spikes, received from synapses 0, 4, and 11, approach their maxima. The sudden increase in the synaptic potentials reflects the change in the weight values. The sudden decrease in the membrane potential (bottom plot in figure, time t ' 25) at this time, on the other hand, is due to the reset after the neuroid fires. When the second object S11 ∧ S12 ∧ S20 is presented to the network at t ' 55, we expect this neuroid to stay silent. However, the neuroid produces an action potential seen from the reset at t ' 70. The reason for this erroneous action is that the combined effect from two strong synapses from assembly S20 produces enough activation to cross the threshold calculated for the recruited concept. The culprit is both the learning algorithm for not weakening the synapses enough, and the uneven distribution of synapses from different concept assemblies. Both issues are not resolved in this work since they are artifacts of the theory behind recruitment learning and not the tolerance and segregation parameters. We are working on making the network more noise tolerant rather than tweaking the parameters to suppress this kind of natural outcome. The important consequence of this erroneous activity is that the spike caused by this neuroid is going to cause more spurious effects in the downstream areas (see Fig. 4.17). The postsynaptic neuroid will assume that it received a spike from a synapse representing the concept S10 ∧ S11 ∧ S20 , even when the second object does not represents the concept S10 . In the simulator, recruited concepts are labeled at the time of their recruitment according to their incoming neuroids. This may be another point that requires revision. Afterwards, the simulator reads the previously assigned label, rather than actually observing the neuroid’s activity. As a solution, it may be argued that, since the neuroid fired in phase with the second object, it should represent an intermediate concept for the second object. Another possibility is to dynamically change the concept to which the neuroid belongs. This implies using a more
105
CHAPTER 4. ROBUST RECRUITMENT OVER DELAYED LINES
Potential [V] Synapse Activities of PeakerNeuroid #28 (in Area: M3) with Concept: S1−2, S1−1, S1−0, S2−0 Weighted potential of Synapse #4 of3PeakerNeuroid #28 (in Area: M3) from PeakerNeuroid #28 (in Area: M2) Concept: S1−1, S1−0, S2−0 2 1 0
0
20
40
60
80
100
120
Weighted potential of Synapse #7 of 3PeakerNeuroid #28 (in Area: M3) from PeakerNeuroid #49 (in Area: M2) Concept: S1−2, S1−1, S2−0 2 1 0 0 20 40 60 80 100 120 Weighted potential of Synapse #11 3of PeakerNeuroid #28 (in Area: M3) from PeakerNeuroid #75 (in Area: M2) Concept: S1−2, S1−1, S2−0 2 1 0
0
20
40
60
80
100
120
100
120
4 Membrane potential of PeakerNeuroid #28 (in Area: M3) 2 0
0
20
40
60 Time [ms]
80
Figure 4.17: Presynaptic activities (top 3 plots) and total membrane potential (bottom plot) of a neuroid representing a spurious concept in area M3 . This concept S10 ∧ S11 ∧ S12 ∧ S20 is caused by the correct concept S10 ∧ S11 ∧ S20 in Fig. 4.16 firing in the wrong phase. A sensory concept Sij is written as Si-j.
106
CHAPTER 4. ROBUST RECRUITMENT OVER DELAYED LINES advanced learning algorithm that allows gradual adjustment of weights after the initial memorization, or n-shot learning.
Implementation of the Tolerance Window We suggested that lower bounds on the tolerance and segregation parameters can be calculated for a direct/indirect connection topology. According to the results, the degree of stability of network correctness increases with the tolerance, as expected. Excessive stability is not especially desirable since it results in a trade-off with speed performance. We prefer to have the lowest tolerance value to achieve the fastest speed without compromising network correctness. For this purpose, the values chosen for tolerance seem to be appropriate, since correct concept quality values can be distinguished from spurious ones. In this respect, there even seems to be room for further optimization of the tolerance parameter. We proposed that the membrane time constant can be dynamically adjusted (possibly by biological processes that vary the membrane resistance), to accommodate the calculated tolerance window. An alternative to varying the membrane time constant may be the use of persistent firing by inputs occurring at separate times, for creating an overlapping effect on the destination read-out site (Cannon et al., 2002; Günay and Maida, 2003d) (see discussion in §4.1.3). Yet another alternative is by adjusting the threshold (excitability) of the destination unit. However, there are other views to solve the problem of variable delays. In particular, it was proposed that introducing synapse-specific delays and integration times adopted during development can accommodate for differences in delays (Senn et al., 2002). If cortical circuits can adapt to varying delays, this may solve the problem with the direct/indirect connection
107
CHAPTER 4. ROBUST RECRUITMENT OVER DELAYED LINES topologies, as well.3
Implementation of Segregation The calculated segregation, however, needs to be applied at the initial source (possibly by attentional mechanisms). Therefore, feedback connections from the destination site should inhibit the source areas for the desired segregation amount. For instance, the dense feedback connections from visual area V1 back to the lateral geniculate nucleus (LGN) may be responsible for this kind of modulation (see the direct/indirect connection topology in Figure 1.4). However, it is difficult to assume that there is a direct feedback connection to the initial source in all such topologies. Instead a more complex attentional mechanism may be responsible for segregating signals. The segregation also predicts the maximum firing frequency in the local circuit. The field of signals and systems has also contributed to the theory and application of timing issues in interconnected circuits. In particular, the industry for fabricating integrated circuits (ICs) nowadays gives high importance to timing properties of circuits with the need to produce faster computers. Some of the theory from this field may apply to the issues we discuss in this work. The problem of synchronizing varying-length or varying-delayed paths is especially important in fabricating ICs. Three mainstream approaches can be identified in the current literature as a solution to the problem (Chandrakasan et al., 2001, Chs. 9,11). The first solution is achieved by using a central global clock signal to synchronize events at different parts of the circuit. The clock signal governs the time when the computational units start processing their inputs. Buffering devices are required to keep the inputs arriving at various 3
Due to personal communication with Benjamin Rowland and comments from an anonymous referee.
108
CHAPTER 4. ROBUST RECRUITMENT OVER DELAYED LINES times for each unit. For structures with varying delays between the source and destination stages, synchronization can be achieved if the clock period is made large enough to tolerate the maximally-delayed signals.4 This solution is equivalent to the approach we take to calculate the tolerance window Γ with (4.1). A major disadvantage to this approach is that even faster computations need to wait for this longer duration. The second approach proposes using circuits without a global clock signal. These circuits are called asynchronous, where each unit produces an output as it completes its computation. Here, a special effort must be made for ensuring that the varying-delay pathways do not appear. To achieve this, paths between different stages of computations are shortened and unified. The major disadvantage of this approach is that this type of fine tuning is expensive and susceptible to errors caused by noise or slight variations in component properties due to fabrication artifacts. The third approach attempts to combine the strengths of the both previous approaches. Each interconnected processing stage consists of interacting components. Results of a computation from a stage is only transmitted to the next stage after receiving a release signal. This approach is most interesting for our purposes because it is easier to model it with biological circuits. This method does not require a global clock and the nature of connections are more localized. Modeling this approach into our system is left as future work.
109
CHAPTER 4. ROBUST RECRUITMENT OVER DELAYED LINES 4.4
Chapter Conclusions and Future Work
4.4.1
Chapter Conclusions
Our previous work proposed lower bounds for the tolerance window Γ and the phase segregation Φ parameters. Here, we improve these hypotheses, and show their viability with simulations. We ran simulations on networks with varying size direct/indirect connection topologies. We tested for binding errors among multiple hypothetical objects presented, while the tolerance and segregation parameters were swept over a range including the predicted values. We conclude that appropriately chosen tolerance and segregation parameters enable use of temporal binding for recruitment learning in direct/indirect connection topologies. Furthermore, using a spiking neuron model is appropriate for recruitment learning, which is originally proposed with simpler discrete-time neuron models. A recent study is consistent with our view (Shastri, 2001). We also improved the stability of recruitment with aid of a stabilizing mechanism proposed in §3.1.8. As a result, our simulations indicate that up to roughly half of the predicted capacity can be achieved with reasonable performance. The statistical variance inherent in the recruitment method prevents recruiting a chain of concepts in cascade. This problem is especially apparent in smaller network sizes, such as we employ here with a low number of neuroids (N ∼ 102 ) for each area. Earlier work on the stability of the recruitment method for larger network sizes such as N ∼ 108 (Valiant, 1994), and under asymptotic conditions N → ∞ (Gerbessiotis, 1993, 2003) indicate recruitment can be used up to 4 levels deep. Our stabilizing method can potentially be applied to these larger networks. 4
The clock is assumed to control the source and destination stages of the computation. Intermediate stages of computation between the source and destination need to be controlled by an independent and faster clock signal or function asynchronously.
110
CHAPTER 4. ROBUST RECRUITMENT OVER DELAYED LINES 4.4.2
Chapter Future Work
We still need to design neural circuits that adaptively adjust the tolerance and segregation parameters, rather than calculating and setting them to fixed values according to each topology. Since cortical circuits are known to change, tolerance and segregation should be managed dynamically according to changing conditions. For managing tolerance, it can be shown that, if only the membrane resistance is externally manipulated to vary the membrane time constant, the desired effect can be achieved (see Appendix A.3). Another mechanism that deserves further work is the neural circuits that may be responsible for managing the proposed stabilizing machinery for hierarchical recruitment. There are a number of neural circuits that can be proposed for realizing this boost-and-limit function. For instance, it can be proposed that global inhibition by itself, or local lateral inhibition with noisy delays to trigger an inhibitory circuit to shut off all activity after sufficient recruitment is reached, can be used to control recruitment (see Chapter 5). This may also improve the robustness of recruitment. In this chapter we do not intend to propose or implement such a circuit since it increases the complexity of the system, where we need to observe other parameters closely. This boost-and-limit mechanism is solely implemented by software techniques in our simulator. An advantage of this mechanism is the result discussed in §4.3.3.
111
Chapter 5 A Stochastic Population Approach to the Problem of Stable Recruitment Hierarchies 5.1
Introduction
Recruitment learning is prone to instability when a chain of concepts is recruited in cascade as seen in Figure 3.5 on page 68. The statistical variance inherent in the recruitment method causes increasing perturbations to the recruited set size, and thus instability (Valiant, 1994). We previously proposed a boost-and-limit algorithm to improve recruitment stability (see Section 3.1.8), and verified the applicability of this method with a software model in a spiking neuroidal net simulator (Günay and Maida, 2001, 2003d). In that model, excess recruitment candidates were rejected to enforce a stable recruitment level. This chapter proposes a biologically supported mechanism that may serve to implement the previously proposed boost-and-limit method in neural hardware. 112
CHAPTER 5. A STOCHASTIC POPULATION APPROACH TO THE PROBLEM OF STABLE RECRUITMENT HIERARCHIES A
B Boost Limit
Figure 5.1: Basic structure of the boost-and-limit mechanism. Boosting signifies increased connectivity between A and B. Limiting applies to the size of the recruited set via a negative feedback effect (possibly lateral inhibition). The boost-and-limit method, sketched in Figure 5.1, works by increasing the statistical expectation of the recruited set size. This limits the probability of under-recruitment. Then, to control this increase, negative feedback is applied by setting a hard limit on the size of the recruitment set. This limits the possibility of over-recruitment. We propose a biological model with similar functionality, using both the noisy delays inherent in cortical networks, and lateral inhibitory effects between principal neurons as the negative feedback. In this model, the initially synchronized spike volley intended to cause recruitment is assumed to be subject to varying delays in the individual spikes. The delays are caused by spikes travelling through axons of slightly varying lengths and by dendritic placement of synapses. The varying delays in the spike arrival times cause the destination neuroids to be recruited in a temporally dispersed sequence. During this process, we propose using the local lateral inhibition as a mechanism that saturates to fully inhibiting the localized area after enough neuroids are recruited. This is possible if each recruited neuroid emits a delayed lateral inhibitory signal within a properly connected structure. In other words, recruitment causes the neuroid to fire (as proposed by Valiant) and emit a lateral inhibitory spike (our proposal), thereby slowing down further recruitment. In this work, we assume that neuroids are capable of having both excitatory and inhibitory synapses. In Section 5.3, we describe the stochastic population approach that we employ to study the properties of the proposed boost-and-limit mechanism within the context of an
113
CHAPTER 5. A STOCHASTIC POPULATION APPROACH TO THE PROBLEM OF STABLE RECRUITMENT HIERARCHIES integrate-and-fire (I/F) neuroidal network. We are interested in variations of the expected population size of recruited neuroids with respect to perturbations to the input population size. We first introduce a feedback control system where the recruitment is modeled with a monopolar excitatory synaptic population. The expected size of the recruited neuroid set has an equilibrium point ro . In Section 5.4.1 we confirm that in the original open-loop recruitment system, the equilibrium point is unstable. That is, for perturbations in the size of the input set, the size of the recruited set diverges from the equilibrium point. In the closed-loop system, for an ideal instantaneous feedback condition, the equilibrium point becomes stable, but the model is prone to oscillations. However, since we encounter inconsistencies in the steady-state behavior of this model, we switch to a more detailed model using dipolar excitatory-inhibitory synaptic populations. This model shows an improved convergence rate to the stable equilibrium point for the less restricted uniform-delay feedback condition. Section 5.5.5 describes the low pass filter that is required at the output of both these models to prevent unwanted oscillations in the activity level. The final model allows choosing the desired recruitment size, ro , for representing concepts, and the number of neuroids per localized area N , arbitrarily. Another free parameter of the model is the feedforward excitatory connection density. This is calculated for a given ro and N according to the definition of recruitment learning. The connection density can also be adjusted with a positive gain constant λ. The choice of λ affects the rate of convergence to the stable equilibrium point. Given these parameters, we can calculate the required lateral inhibitory projection density for stable recruitment in hierarchies.
114
CHAPTER 5. A STOCHASTIC POPULATION APPROACH TO THE PROBLEM OF STABLE RECRUITMENT HIERARCHIES 5.2
Related Work
The problem of recruitment instability was originally explored by Valiant (1994) in the so-called vicinal algorithms in randomly connected graphs. Valiant proposed that hierarchical recruitment with a depth of three to four levels can be achieved if the parameters of the system are chosen appropriately, based on the work of Gerbessiotis (1993, 2003). This study assumed a replication factor of r = 50 neuroids for representing each concept. It is also assumed that the total number of neuroids in the system was large, approaching infinity, which is reasonable given the large number of principal neurons (pyramidal cells) in the cerebral cortex. Gerbessiotis (2003) provided a rigorous formalism of the expected recruited set size in random graphs. Gerbessiotis (1998) also showed that a constructed graph can guarantee the replication factor to be a constant r only for a graph with 3r vertices (neuroids), and not for a graph with an arbitrary size. Our earlier work (Günay and Maida, 2003d) suggested that the instability becomes graver when the total number of neuroids in the network is low (e.g., on the order of hundreds). In our case, networks that are divided into localized areas with small number of neuroids are interesting because they are better suited for computer simulation. Even though the mammalian brain contains a large number of neurons in total, there are smaller substructures where our analysis could be applied. For instance, cortical areas and microcolumns are possible candidates. Levy (1996) presented a hippocampal-like model for sequence prediction which used a recurrent network having random asymmetric connectivity. They analyzed parameters statistically, in a manner similar to our work, to find appropriate neural threshold and weight parameters for maintaining stable activity levels (Minai and Levy, 1993, 1994). Their model differs from ours in having excitatory feedback connections, and employing a rate model with 115
CHAPTER 5. A STOCHASTIC POPULATION APPROACH TO THE PROBLEM OF STABLE RECRUITMENT HIERARCHIES discrete time steps, unlike the continuous spiking model used in the present work. Yet, our model lacks effects of spike rates and variable thresholds since these are of secondary importance in our framework (Günay and Maida, 2003a). Previous work using statistical analysis on network parameters goes back to Amari (1974). Shastri (2001) modeled recruitment learning based on the biological phenomena of long-term potentiation (LTP) and long-term depression (LTD) with idealized I/F neurons. Then, assuming that recruitment learning is employed in the interactions between the enthorinal cortex of the medial temporal lobe, and the dentate gyrus of the hippocampal formation, he calculated the probability of finding a sufficient number of recruitment candidates according to the anatomical properties of these structures and a suitable selection of parameters. Shastri also extended the recruitment learning method to: 1) allow multiple redundant connections from each of the input concepts, which makes the method more robust; and, 2) allow a recruited neuron to take part in representing other concepts, which increases the concept capacity of a network containing a finite number of units. An interesting point made by Diesmann et al. (1999) is the connectivity conditions for stable propagation of synchronized spike packets over multiple stages, similar to our analysis here. Their architecture is composed of feedforward layers of I/F neurons with each neuron having convergent inputs from the previous layer. According to their results, for a synchronized spike packet to propagate undisturbed, there are lower bounds for the size of the packet and the connection density.
5.2.1
Relation to Winner-Take-All Mechanisms
In the brain, neural firings result in stereotypical action potentials (APs) with constant magnitude. However, the firing times and spike rates carry important information (Gerstner,
116
CHAPTER 5. A STOCHASTIC POPULATION APPROACH TO THE PROBLEM OF STABLE RECRUITMENT HIERARCHIES 1999). In our model, since all neuroids are assumed to fire at most once during the period of analysis, the time-to-first-spike is the most significant variable. In this sense, our model can be considered as a winner-take-all (WTA) mechanism (Feldman and Ballard, 1982) if the winners are chosen according to temporal precedence, similar to the work of Indiveri (2000). Specifically, our model is a k-WTA, because it allows roughly k winners to be fired and recruited, where k is the number of neuroids redundantly representing a concept. It is also a soft WTA, which sorts k real valued outputs according to the magnitude of the corresponding real valued inputs, in contrast to a hard WTA whose outputs are binary (Maass, 2000). Regarding the computational power of WTA networks, Maass (2000) showed that networks that use lateral inhibition as a WTA mechanism have the same universal computing power as layered feedforward networks. Using WTA networks in a biological context goes back to Elias and Grossberg (1975). Shastri (2001) suggested that the set of recruited neurons should be controlled by a soft WTA mechanism, without actually implementing it. Knoblauch and Palm (2001) use a terminating inhibition similar to Shastri’s model for ensuring the retrieval of only a single item from a spiking associative network. In a related work, Gao and Hammerstrom (2003) provide performance comparisons for the Palm network (Palm et al., 1997) which is an earlier neural associative memory model that also features a k-WTA component. However, the latter study uses digital circuits to calculate the output of the k-WTA, separating it from our approach. There is much previous work on WTA networks studied by Hopfield (1982), in the context of associative attractor networks with symmetrical connections. Recent work includes WTA networks (e.g., Tymoshchuk and Kaszkurewicz, 2003), and k-WTA networks (e.g., Calvert and Marinov, 2000) which feature stable equilibrium points, based on other results on global stability in neural networks (Kaszkurewicz and Bhaya, 1994; Arik, 2002). These differ
117
CHAPTER 5. A STOCHASTIC POPULATION APPROACH TO THE PROBLEM OF STABLE RECRUITMENT HIERARCHIES A
B
Yellow RA
RB
Yellow Volkswagen Volkswagen
sB
(a) Original case, as a conjunction of two inputs.
(b) General case, resulting from single input.
Figure 5.2: Type of recruitment learning employed. Original recruitment (a) requires two inputs to create an output concept. (b) We generalize recruitment to require a single set of neuroids to create an output set of neuroids by adjusting the connection probability. The set sB represents the set of activated synapses in area B. from our approach because they employ full-recurrent-connection networks and use sigmoidal rate-coded neurons. They also require iteration until converging to a stable solution and some may suffer from local minima. WTAs built with competitive learning networks are superior to Hopfield-type networks, because they do not have the local minima problem (Urahama and Nagao, 1995). There are efforts to analyze and implement various types of WTA networks (Indiveri, 2000; Calvert and Marinov, 2000; Badel et al., 2003; Ganapathy and Titus, 2003).
5.3
The Model Framework
We start with a simple model of the recruitment process at a destination area B, caused by inputs from an initial area A, where A and B are disjoint sets of neuroids. The reason for choosing this two-area model is to assess the stability in the size of the recruited set when the process is repeated. The input RA , which represents a concept of interest, is some subset of neuroids in area A that projects to area B. Inputs from the neuroids in set RA in area A(1) ,
118
CHAPTER 5. A STOCHASTIC POPULATION APPROACH TO THE PROBLEM OF STABLE RECRUITMENT HIERARCHIES which project to area B (1) , cause a set RB (1) of neuroids to be recruited (see Figure 5.2(b)). This process can be repeated by assuming the set RB (1) is in an area A(2) and it is used to recruit a new RB (2) set in the next area B (2) . We are interested to show that the variance of |RB (k) | is sufficiently small after k iterations using our proposed method. We call this the variance problem.
Generalized Recruitment
Notice that we employ a generalized recruitment learning
method to generate an output set from a single input set (see Figure 5.2(b)). This general solution can later be transformed into specific networks requiring multiple inputs. Recruitment learning is originally designed to require two input sets to be activated for creating an output set (Feldman, 1982, 1990; Valiant, 1994). Synchronous activation from two input sets indicating a temporal binding causes the neuroids receiving inputs from both sets to be recruited as seen in Figure 5.2(a). Recruitment learning requires the connections between the source and the destination to form a random graph with connection probability chosen to satisfy recruitment of a set to be equal in size to that of the input sets. Here we adjust the probability for the random connections such that a set RA causes the recruitment of a set RB with equal sizes, rA = |RA | ' |RB | = rB . The probability of having an excitatory connection between a neuroid in A and a neuroid in B is given with p+ AB =
p
λ/NB (ro − 1) ,
(5.1)
where λ ∈ R+ is the amplification factor, NB = |B| is the total number of neuroids in B and ro = rA = rB is the desired size of the neuroid set representing a concept. Equation (5.1) ensures that the expected size of a recruited set has an equilibrium point rB = ro when rA = ro and λ = 1. The derivation of this property is described in Appendix A.2.2. However,
119
CHAPTER 5. A STOCHASTIC POPULATION APPROACH TO THE PROBLEM OF STABLE RECRUITMENT HIERARCHIES A RA
B RB
A RA
Spikes
B RB
Spikes µAB time
0 rB = |RB |
0
µAB
time
rB = |RB |
(a) Uniform delays cause an uncontrollable event of instant recruitment.
(b) Noisy delays allow gradual recruitment of neuroids which can be used as a feedback signal in the system.
Figure 5.3: The cases with (a) and without (b) noisy delays and their effect on the controllability of the recruitment process. ensuring the expectation does not solve the variance problem in hierarchical learning.
The Boost-and-Limit Mechanism
To solve the variance problem by keeping the recruited
set size rB in a stable equilibrium, we propose a boost-and-limit mechanism. This mechanism assumes an increased connection density (by manipulating λ) between the source A and destination B to ensure sufficient recruitment at B, and then dynamically limits the recruitment with a negative feedback component (controlled by the current value of rB ) projecting via lateral inhibition within B.
Purpose of Noisy Delays
It is reasonable to propose that the negative feedback is applied
via lateral inhibition when recruited neuroids in B fire. This ensures neuroids to be actually recruited before feedback is applied. The negative feedback should inhibit further recruitment candidates after the desired number of neuroids is recruited. Assuming that the initial input is a single synchronous spike volley from the set RA and that the delays between A and B are uniform, then the recruitment process in B becomes instantaneous. This does not leave time for the inhibitory feedback mechanism to sense the controlling quantity rB due to delays (see 120
CHAPTER 5. A STOCHASTIC POPULATION APPROACH TO THE PROBLEM OF STABLE RECRUITMENT HIERARCHIES Figure 5.3(a)). However, if the recruitment process is temporally dispersed, then the inhibitory feedback strengthens continuously with increasing number of recruited neuroids. This continues until a balance is reached between the input excitation and lateral inhibition to yield a desired recruitment level as in Figure 5.3(b), assuming the feedback is fast enough. A realistic dispersion of recruited neuroids can be achieved if the connections between A and B have slightly varying delays. We model these delays with a normal distribution having mean µAB and standard deviation σAB . The instantaneous spike rate of activity originating from A and received by excitatory synapses in B, nAB (t), is given with nAB (t) = rA p+ AB NB G(µAB , σAB ; t) ,
(5.2)
where rA = |RA |, the normal distribution is given by the Gaussian kernel G(µ, σ; t) =
√1 σ 2π
exp[− 12 ( µ−t )2 ], and p+ AB is defined in (5.1). σ
A Non-leaky Spike Integrator
A spiking neuron model is employed, which causes
incoming action potentials at the excitatory synapses to have a prolonged excitatory postsynaptic potential (EPSP) on the somatic membrane component of the neuroids. In this model, we assume the decay constant of the membrane is larger than the transmission delays, or no decay is present at all. Therefore, all incoming spikes to a neuroid cause a constant EPSP, and the EPSPs are accumulated over the course of the recruitment process, which is roughly a few tens of milliseconds (namely, the interval [0, 40] in the analyses below).
The Recruitment Process
The main variable of interest rB (t) is the total number of
recruited neuroids in area B at time t. According to the definition of recruitment learning (Valiant, 1994), if a neuroid receives two spikes at its excitatory synapses, it is recruited and
121
CHAPTER 5. A STOCHASTIC POPULATION APPROACH TO THE PROBLEM OF STABLE RECRUITMENT HIERARCHIES therefore emits an action potential (AP). Therefore the threshold of each neuroid is adjusted to fire at the sum of two input EPSPs. Statistical methods can be used to estimate the number of recruited neuroids under a spatially uniform synapse distribution. It is desired that this number asymptotically approaches a maximum level r¯B , and exhibits a stable equilibrium at a fixed point rA = r¯B = ro . That is, for perturbations to the input size rA , the variation of rB should converge to the fixed point when the process is repeated. Presumably in the present model, all effects of the activation caused by excitatory synapses may be disrupted at the soma of a neuroid when an inhibitory synapse is activated, if the effect of the inhibitory synapse is divisive rather than subtractive (Koch et al., 1983). In other words, an inhibitory synapse positioned on an axon hillock (spike initiation zone) of a neuron can act as a veto mechanism to an arbitrary excitatory input. The following sections incrementally build models to achieve the stable equilibrium described above. In the analyses, the system parameters are chosen as NB = 100 neuroids, ro = 10 neuroids, µAB = 20 ms, and σAB = 5 ms, unless otherwise indicated. The time window for the recruitment process is taken as the period [0, 40] ms. The λ values used range from unity, λ = 1, where p+ AB = 0.03, to various degrees of amplified connectivity (e.g., for λ = 20 causes p+ AB = 0.15).
5.4
The Monopolar Synaptic Population Model
The first model, the monopolar synaptic population model, represents the network behavior only with the size sB of an excitatory synapse population. The block schema of the model is depicted in Figure 5.4. The total number of activated excitatory synapses sB (t) at area B increases in proportion
122
CHAPTER 5. A STOCHASTIC POPULATION APPROACH TO THE PROBLEM OF STABLE RECRUITMENT HIERARCHIES rA Projection nAB P A→B + − κ
sB R t
Recruit Neuroids in B
rB
× nBB
Lateral Inhibition B→B
Rectify
d dt
rA = neuroid count in input RA [neuroids]. nAB , nBB = instantaneous spike rates of excitatory and inhibitory projections, respectively [spikes/s]. sB = activated excitatory synapse count in B [synapses]. rB =recruited/fired neuroid count in B [neuroids]. Figure 5.4: Block schema of the boost-and-limit control mechanism for the monopolar synaptic population model. The input rA is a scalar indicating the magnitude of a one-time synchronous input to the system, whereas other quantities are functions of time t. For the instantaneous spike rates, it should be taken into account that source neuroids presumably only fire once during the recruitment process. Therefore the rate indicates the spike throughput of the population. to the net sum of spike rates described with the differential equation dsB (t) = nAB (t) − κnBB (t) , dt
(5.3)
where nAB (t) is defined in (5.2), nBB (t) represents the inhibitory feedback, and κ is the proportionality constant of the effect of an inhibitory synapse. We assume that both the excitatory and inhibitory synapses have equal weights such that they cancel each other on a destination neuroid by taking κ = 1. Note that, in this model we only observe the cancellation effect of inhibitory synapses on the excitatory synapse population size sB and not the inhibitory synapse population itself.1 Another point is that it is not possible to run out of synapses in (5.3) because the feedforward excitatory spike rate distribution nAB is defined in (5.2) according to available synapses from the static connectivity of the network given with 1
Refer to the dipolar model in Section 5.5 for a more detailed excitatory-inhibitory synapse population model.
123
CHAPTER 5. A STOCHASTIC POPULATION APPROACH TO THE PROBLEM OF STABLE RECRUITMENT HIERARCHIES (5.1). Thus, each new excitatory spike activates a new excitatory synapse, but then each inhibitory spike will cancel out a fraction of an excitatory synapse. nBB will be defined in detail later with the closed-loop system. Given sB (t), the number of recruited neuroids in area B, rB (t), can be obtained by using a statistical expectation operator. Using a synapse-count s, we argue that for every two excitatory synapses activated in B, the probability of them being on the same neuroid is 1/NB2 . The synapses are guaranteed to be activated by different source neuroids from area A � because a source neuroid only fires once. Since there are 2s possible synapse pairs, then the probability for a neuroid in B to fire can be given with
p∗ =
�s� 1 s2 ≈ . 2 NB2 2NB2
(5.4)
Thus, rB (t) can be given as the expected number of neuroids recruited in B, rB (t) = p∗ NB ≈
s2B (t) . 2NB
(5.5)
To assess the behavior of rB (t) with respect to time and changes in the input rA , one can observe sB (t) since these two quantities are directly related by (5.5).
5.4.1
The Open-loop Characteristics
For comparing the performance of the proposed model, we first look at the open-loop system characteristics without the negative feedback. This scenario is similar to the method originally described by Valiant (1994), except that we use the generalized recruitment method defined above. The open-loop system is obtained by taking nBB (t) = 0 in (5.3). Integrating this 124
CHAPTER 5. A STOCHASTIC POPULATION APPROACH TO THE PROBLEM OF STABLE RECRUITMENT HIERARCHIES Open loop numeric integration of rB (λ = 1.80) 25 20 rB
15 10 r = 15 5 rA A = 10 rA = 5 0 0 5 10
15
20 25 time [ms]
30
35
40
Figure 5.5: Open-loop simulation for the change in the size of the recruited set rB with different selections for the size of the input set rA . equation, we get Z sB (t) =
t
nAB (τ )dτ .
(5.6)
0
Values of rB (t) obtained from (5.5) and (5.6) are plotted in Figure 5.5 for three choices of rA . We can estimate the upper limit asymptote, or steady-state value, of sB by s¯B = lim sB (t) ' rA p+ AB NB , t→∞
since limt→∞
Rt 0
(5.7)
G(µAB , σAB ; τ )dτ ' 1 when µAB > 2σAB , and the term rA p+ AB NB is
constant. Using this, the final expected number of recruited neuroids r¯B , as a function of the number of activated input neuroids rA , becomes 2 r¯B = (rA p+ AB ) NB /2 ,
(5.8)
which is plotted in Figure 5.6. r¯B is the maximum of rB (t) for this recruitment process, since all the spikes initiated at area A have reached area B. Numerical integration of (5.6) to find rB given in Figure 5.5 verifies the return map of 125
CHAPTER 5. A STOCHASTIC POPULATION APPROACH TO THE PROBLEM OF STABLE RECRUITMENT HIERARCHIES Return map for r¯B = f (rA ) (Open-loop system) 25 20 r¯B
15 10 r¯B for λ = 1.80 rB = rA Unstable fixpoint
5 0
4
6
8
10 rA
12
14
16
Figure 5.6: Return map of the change in the r value from rA to rB of the open-loop system according to (5.8). Note that the chosen fixed point with the parameters indicated in the plot is unstable. Figure 5.6.2 As expected, perturbations to the value of rA cause rB to diverge from the desired value ro = 10, which is the cause of recruitment instability.
5.4.2
The Closed-loop System with Negative Feedback
We now proceed to define the negative feedback effect, the instantaneous inhibitory spike rate nBB (t) within B, used earlier in (5.3). This quantity depends on the number of recruited neuroids emitting APs, thus (5.5). However, since rB (t) is the total number of neuroids recruited, nBB (t) only depends on its derivative representing the instantaneous rate of recruitment at a time t. A recruited neuroid emits a single AP. Therefore, the recurrent inhibitory projection3 can be represented by
n ˜ BB (t) = p− BB NB
drB (t − µBB ) , dt
2
(5.9)
A simple forward-Euler method is used for integration. Instead of featuring inhibitory interneurons, we assume that projections can be either excitatory or inhibitory. Using actual inhibitory interneurons is a matter of adapting the calculations here. 3
126
CHAPTER 5. A STOCHASTIC POPULATION APPROACH TO THE PROBLEM OF STABLE RECRUITMENT HIERARCHIES where µBB is the magnitude of the uniform recurrent delays,4 and p− BB is the density of inhibitory recurrent projections. n ˜ BB (t) gives the expected number of newly activated inhibitory synapses in all of area B. To find the number of activated excitatory synapses that can be vetoed by the activated inhibitory synapses, we use the number of activated excitatory synapses per neuroid in B, sB (t) . NB
Since, for each activated inhibitory synapse on a distinct neuroid causes all its activated
excitatory synapses to be subject to cancellation, we get the total number of activated excitatory synapses in B affected by the new inhibition as
nBB (t) = n ˜ BB (t)
sB (t) drB (t − µBB ) = sB (t) p− . BB NB dt
(5.10)
The exact number of affected excitatory synapses is obtained according to the proportionality constant κ in (5.3). The derivative at the right hand side of (5.10) can be obtained by differentiating (5.5) to yield drB (t) 1 dsB (t) = sB (t) , dt NB dt which can be substituted into (5.10) and rewriting (5.3) gives the closed-loop form of the system with fixed-delay feedback dsB (t) p− dsB (t − µBB ) = nAB (t) − BB sB (t) sB (t − µBB ) . dt NB dt Note that, zero initial conditions are assumed for sB (t) = 0 for all t ≤ 0. 4
For simplicity, we assume recurrent delays are of fixed duration.
127
(5.11)
CHAPTER 5. A STOCHASTIC POPULATION APPROACH TO THE PROBLEM OF STABLE RECRUITMENT HIERARCHIES 5.4.3
Instantaneous Feedback Condition
From (5.11), taking the instantaneous recurrent feedback condition µBB = 0 as a simplifying assumption, we get dsB (t) nAB (t) = , p− 2 dt s 1 + NBB (t) B B
(5.12)
where nAB (t) is the delay distribution given in (5.2). Note that, sB increases asymptotically according to (5.12) since limt→∞
dsB (t) dt
dsB (t) dt
= 0 and
> 0, always.
The solution to (5.12) yields two roots. We are only interested in the positive root, � 23 2 C(t) + + 4 − 23 sB (t) = q � � 13 p p− BB 2 2C(t) + 2 C (t) + 4 NB �
p
C 2 (t)
(5.13)
where C(t) =
3 rA p + AB
q
p− BB
Z
t
G(µAB , σAB ; τ )dτ .
NB
(5.14)
0
The derivation of this solution is given in Appendix A.4. The steady-state value of C(t) can be calculated similarly to (5.7), C¯ = lim C(t) = 3 rA p+ AB t→∞
q
p− BB NB .
¯ steady-state solutions s¯B and r¯B can be calculated. The resulting return map of r¯B , From C, given rA , is plotted in Figure 5.7. Different from the open-loop return map, this time the fixed point at rA = r¯B = 10 is stable. That is, for variations in the rA value, the value of r¯B always approaches the fixed point. Note that the lateral inhibitory connectivity is chosen as κp− BB = 0.5. As seen from the figure, as the A → B projection density factor λ value is increased, the convergence rate to the fixed point marginally increases. However, this causes 128
CHAPTER 5. A STOCHASTIC POPULATION APPROACH TO THE PROBLEM OF STABLE RECRUITMENT HIERARCHIES The return map for r¯B = f (rA ) 16 14 r¯B
12 10 λ = 34, κp− BB = 0.50 λ = 97, κp− BB = 0.95 r¯B = rA Stable fixpoint
8 6 4
4
6
8
10 rA
12
14
16
Figure 5.7: Return map of the change in the r value from rA to r¯B of the closed-loop system with the instantaneous feedback condition. Note that the chosen fixed point with the parameters indicated in the plot is stable. Convergence speed increases from moderate connectivity case − (λ = 34 and κp− BB = 0.5) to high connectivity case (λ = 97 and κpBB = 0.95), but requires higher feedback connectivity. the inhibitory feedback density to increase to keep the fixed point at the desired location. Verifying the closed-loop system with numerical methods is more difficult. This is because (5.12) fails the Lipschitz condition5 that is required for the convergence proofs for numerical methods based on the Euler method (e.g., Runge-Kutta). Simulation results obtained with another numerical algorithm6 to solve the ordinary differential equation (5.12) are given in Figure 5.8. Note that the instantaneous feedback condition is an ideal case. With delays, more realistic effects of feedback can be observed for stabilizing the system.
129
rB
CHAPTER 5. A STOCHASTIC POPULATION APPROACH TO THE PROBLEM OF STABLE RECRUITMENT HIERARCHIES
Instant-feedback with λ = 34.00, κp− BB = 0.50, ∆t = 0.100 14 r = 15 12 rA A = 10 10 rA = 5 8 6 4 2 0 0 5 10 15 20 25 30 35 40 time [ms]
Figure 5.8: Closed-loop simulation in the instantaneous feedback case for the change in the size of the recruited set rB with different selections for the size of the input set rA .
Delayed-feedback with λ = 9.00, κp− BB = 0.50, µBB = 0.50, ∆t = 0.010 100 rA = 15 80 rB
60 40 20 0
0
5
10 15 time [ms]
20
25
Figure 5.9: Closed-loop simulation in the uniform-delay feedback case for the change in the size of the recruited set rB with different selections for the size of the input set rA . The model is plagued with oscillations.
130
CHAPTER 5. A STOCHASTIC POPULATION APPROACH TO THE PROBLEM OF STABLE RECRUITMENT HIERARCHIES
rB
Delayed-feedback with λ = 9.00, κp− BB = 0.50, µBB = 0.50, ∆t = 0.100 30 rA = 15 25 rA = 10 rA = 5 20 15 10 5 0
0
5
10
15
20 25 time [ms]
30
35
40
Figure 5.10: Profiles of rB with uniform-delay feedback case and rectified drdtB with different selections for the size of the input set rA . rB no longer decreases but the effects of the oscillatory feedback can still be seen by sudden increases in rB . 5.4.4
Fixed-Delay Feedback Condition
For a more realistic feedback condition, uniform delays are used by choosing non-zero values for µBB in (5.11). However, there is no simple way to find a solution of this delayed differential equation. Numerical integration of the equation shows that the model introduces another type of instability to the system which causes rB to oscillate uncontrollably as seen in Figure 5.9. The oscillations are caused by the feedback delay. Increasing the time resolution or decreasing the feedback delay does not prevent the oscillations. Since rB is the total number of recruited neuroids, we assume that it should be a monotonically increasing quantity. Therefore we augment the model by rectifying the feedback as seen in the block schema of Figure 5.4. Even though the oscillations no longer occur in the numerical simulations of Figure 5.10, rB increases without being affected by the negative feedback as intended. Increasing the time resolution or decreasing the feedback delay does not prevent the oscillations, either. The stabilizing effect from the inhibitory 5
Given in Appendix A.4.1. Hindmarsh’s ODE solver lsode (Hindmarsh, 1983) in the GNU Octave package (Eaton, 2002) is used to solve this system. 6
131
CHAPTER 5. A STOCHASTIC POPULATION APPROACH TO THE PROBLEM OF STABLE RECRUITMENT HIERARCHIES rA
sP (t)
Projection nAB (t) R t A→B
Lateral Inhibition B→B
Rectify
Recruit Neuroids in B
rB (t)
sN (t) R t
d dt
Delay
Figure 5.11: Block schema of the dipolar synaptic population model. In the diagram, rA is the neuroid count in the input RA in [neuroids]; sP , sN are the activated excitatory and inhibitory synapse counts in B, respectively, in [synapses]; and rB is the recruited/fired neuroid count in B in [neuroids]. Note that, the input rA is a scalar indicating the magnitude of a one-time synchronous input to the system, whereas other quantities are functions of time t. feedback is thus lost. To analyze this failure, assuming a steady-state is reached eventually, we test if the value of rB , and therefore sB , stays at a stable level, i.e. limt→∞
dsB (t) dt
= 0. However, applying this
to (5.11) yields an inconsistent result of limt→∞ nAB (t) = 0. Thus, we proceed to a more detailed model to control the undesired oscillations.
5.5
The Dipolar Synaptic Population Model
To describe a more realistic model of inhibitory feedback, we change to a dipolar synaptic population model. This model has two populations of synapses, sP and sN , for excitatory and inhibitory synapses, respectively. The block schema of this dipolar synaptic model is given in Figure 5.11. Note that the feedback loop via the sN variable is separated from the excitatory input unlike the monopolar synaptic population model. This simplifies the feedback equations. The model is given with the following equations. The number of activated excitatory
132
CHAPTER 5. A STOCHASTIC POPULATION APPROACH TO THE PROBLEM OF STABLE RECRUITMENT HIERARCHIES synapses is given with t
Z sP (t) =
nAB (τ )dτ ,
(5.15)
0
similar to sB in (5.6). The number of activated inhibitory synapses caused by the feedback is given with t
Z sN (t) = pBB N
� Θ
0
where
drB (τ − µBB ) dτ
� dτ ,
x, x ≥ 0 Θ(x) = 0, x < 0
is the rectification function, and µBB is the feedback delay, pBB is the lateral inhibitory connectivity parameter, and N ≡ NB for simplicity. Finally, the expected number of recruited neuroids is s2 (t) rB (t) = P 2N
�
sN (t) 1− N
� .
(5.16)
The initial conditions are taken as rB (t) = 0 for t ≤ 0, as before. The form of rB in (5.16) can be justified probabilistically, similar to the method followed with the monopolar model description in Section 5.4. To reach this equation we use the probability p∗ from (5.4) for a neuroid to be recruited dependent on the number of activated synapses. Then we combine the probability of not finding a activated inhibitory synapse which has veto power on the same neuroid by
p
∗∗
=p
∗
�
sN (t) 1− N
� .
The expected number of recruited neuroids can then be calculated as rB (t) = p∗∗ N given in
133
CHAPTER 5. A STOCHASTIC POPULATION APPROACH TO THE PROBLEM OF STABLE RECRUITMENT HIERARCHIES (5.16). Yet a more realistic method of computing the expected number of neuroids is given in Appendix A.2.3, but it is not implemented here. This method counts neuroids with two or more activated excitatory synapses and no inhibitory synapses. The model already contains a rectifier for managing oscillations, since the purpose of the model was to better control the feedback quantity before it was summed with the excitatory input. However, simulations indicate that the instability imposed by the oscillations cause problems in this model as well. Even with very low delays (µBB = 0.2 ms) and low feedback (p− BB = 0.07) the system does not perform well (see Figure 5.12). If the amplification factor is reduced, the oscillations can be controlled, however the boost-and-limit mechanism loses its advantage in providing stability in rB with respect to variations in rA (see Figure 5.13).
5.5.1
Non-Rectified Model
Since simply rectifying is not useful, we fall back to the original model with no rectification, where the inhibitory population equation can be simplified to Z sN (t) = pBB N 0
t
drB (τ − µBB ) dτ = pBB N rB (t − µBB ) . dτ
(5.17)
Thus, (5.16) can be written in the recursive form s2P (t) rB (t) = (1 − pBB rB (t − µBB )) . 2N
(5.18)
If the value of rB is projected to its steady-state, its behavior can be observed by changing rA to find the return-map of the iterative hierarchical recruitment process as in Section 5.4.1.
134
CHAPTER 5. A STOCHASTIC POPULATION APPROACH TO THE PROBLEM OF STABLE RECRUITMENT HIERARCHIES
rB
Delayed-feedback with λ = 10.00, p− BB = 0.07, µBB = 0.20, ∆t = 0.100
14 r = 15 12 rA A = 10 10 rA = 5 8 6 4 2 0 0 5 10
15
20 25 time [ms]
30
35
40
rB
(a) Profiles of rB with different selections of rA .
160 140 120 100 80 60 40 20 0
Delayed-feedback with λ = 20.00, p− = 0.07, µBB = 0.20, ∆t = 0.100, rA = 10 BB rB sP sN
0
5
10
15 20 25 time [ms]
30
35
40
(b) The sP and sN components of rB when rA = 10. The amplification factor is increased for illustration.
Figure 5.12: The dipolar population model behavior, with uniform-delay feedback and rectified drB . (a) It can be seen that rB approaches the desired level, but fails to maintain its regime dt due to the effects of rectified oscillations. (b) The component view show the ladder-stepping effect on sN and rB . The effect is not due to the numeric method employed, since lowering the simulation step-size to ∆t = 1 µs did not prevent the problem.
135
CHAPTER 5. A STOCHASTIC POPULATION APPROACH TO THE PROBLEM OF STABLE RECRUITMENT HIERARCHIES Delayed-feedback with λ = 2.00, p− BB = 0.07, µBB = 0.20, ∆t = 0.100
10
rA = 15 8 rA = 10 rA = 5
rB
6 4 2 0
0
5
10
15
20 25 time [ms]
30
35
40
Figure 5.13: The dipolar population model behavior, with uniform-delay feedback case and rectified drdtB . If the feedback delay and amplification is low enough the oscillations disappear, but no convergence can be observed in the profile of rB with respect to varying rA . Assuming T is sufficiently large, we define the steady-state value of rB (t) as
r¯B = rB (t)|t>T , and the steady-state value of sP (t) as s¯P = s¯B ' rA p+ AB NB from (5.7). Then, for t > T + µBB we can write (5.18) as
r¯B =
2 (rA p+ AB N ) (1 − p− ¯B ) . BB r 2N
Solving for r¯B , we get r¯B (rA ) =
2N (rA p+ AB ) 2 2 1 + (rA p+ AB )
p− BB N 2
.
An immediate implication of this is that r¯B has an upper bound for large rA . This upper bound can be calculated by lim r¯B (rA ) =
rA →∞
136
∞ , ∞
(5.19)
CHAPTER 5. A STOCHASTIC POPULATION APPROACH TO THE PROBLEM OF STABLE RECRUITMENT HIERARCHIES The return map for r¯B = f (rA ) 16 14 r¯B
12 10 λ = 20, p− BB = 0.09 λ = 40, p− BB = 0.10 r¯B = rA Stable fixpoint
8 6 4
4
6
8
10 rA
12
14
16
Figure 5.14: Plots of the return map of r¯B (rA ) for iterative application of the recruitment described here. Note that the indicated fixed point at r¯B (10) = 10 is stable. Increasing the amplification factor λ that affects the value of p+ AB from (5.1) results in a more flattened curve, thus a faster convergence to a stable fixed point. (The second curve with λ = 40 actually features p− BB = 0.095 which is rounded up in the display.) using l’Hôpital’s rule, we get
=
2N limrA →∞ (rA p+ AB ) 2 � � − 2 pBB N limrA →∞ 1 + (rA p+ ) AB 2
N 2 2(p+ 1 AB ) rA 2 = = − . + 2 N − pBB 2(pAB ) rA 2 pBB
Another corollary of (5.19) is that the lateral inhibitory connectivity parameter pBB can be calculated in terms of other network parameters for a given fixed point ro . For an equilibrium at the fixed point r¯B (ro ) = ro , we get p− BB
2 ro (p+ AB ) N − 2 = 2 ro2 (p+ AB ) N
(5.20)
defined in terms of λ, ro , and NB due to the definition of p+ AB in (5.1). Note that, the latter are the free parameters of the network that can be chosen arbitrarily.
137
rB
rB
CHAPTER 5. A STOCHASTIC POPULATION APPROACH TO THE PROBLEM OF STABLE RECRUITMENT HIERARCHIES
160 140 120 100 80 60 40 20 0
160 140 120 100 80 60 40 20 0
Delayed-feedback with λ = 20.00, p− BB = 0.07, µBB = 1.00, ∆t = 0.100, rA = 10 rB sP sN
0
5
10
15 20 25 time [ms]
30
35
40
Delayed-feedback with λ = 20.00, p− = 0.07, µBB = 2.00, ∆t = 0.100, rA = 10 BB rB sP sN
0
5
10
15 20 25 time [ms]
30
35
40
Figure 5.15: The nature of the oscillations using the dipolar population model: rB component profiles with uniform-delay feedback. The two plots with different feedback delays suggest that the oscillation period is proportional to the delay. Plots of (5.19) in Figure 5.14 confirm the behavior of r¯B and show effects of several parameters on the convergence speed. These results show that if oscillations can be avoided, the system behaves as desired. Note that the stability of the fixed point is improved in comparison to the return maps of the monopolar synaptic population model with the instantaneous feedback condition, plotted in Figure 5.7.
138
CHAPTER 5. A STOCHASTIC POPULATION APPROACH TO THE PROBLEM OF STABLE RECRUITMENT HIERARCHIES 5.5.2
Oscillations in Activity Levels
The nature of the oscillations and their relation to the feedback delay are visualized with simulation plots in Figure 5.15. The oscillatory behavior in the system is expected from control system analysis as delays in feedback often result in instabilities. However, conventional control system tools for analysis of oscillations do not apply to our non-linear model (Phillips and Harbor, 1991). For excessive inhibitory feedback, the recruitment level rB can decrease, causing this instability. It may seem counter-intuitive for rB to decrease, since it represents a monotonically increasing quantity by definition. However, notice that rB is simply the expected value of a stochastic variable representing the recruitment level, and no special effort has been made to make this value monotonic in this model. It is important that, during oscillations, the mean value of rB stays constant, which indicates that it may potentially settle to a stable level as predicted from its steady-state analysis if the oscillations can be prevented. The oscillations appear because rB can change infinitely fast; i.e., the change of recruitment rate, drB /dt, has no upper bound. To stop the oscillations, it is reasonable to suggest that the model of a physical system must have an upper bound for a parameter like this. A natural candidate for imposing an upper bound is using a low-pass filter which slows down the rate of change.
5.5.3 A Decaying Inhibitory Synapse Population A filter mechanism can be used to attenuate the unwanted oscillations in the model. Since the oscillatory activity occurs in the negative feedback loop, we can filter either one of the rB or sN variables. A low-pass filter, such as the exponential decay, which attenuates higher frequency components in a signal, is appropriate for this task. A biologically justifiable 139
CHAPTER 5. A STOCHASTIC POPULATION APPROACH TO THE PROBLEM OF STABLE RECRUITMENT HIERARCHIES sP (t) sN (t)
R
Recruit Neuroids in B
rB (t)
C
Figure 5.16: Block schema of the decay effect on sN for preventing oscillations in the dipolar synaptic population model. low-pass filter can be modeled as a decaying effect in the size of the inhibitory synapse population, by assuming that the inhibitory effects are lost after a short time span. We choose to apply the decay to sN rather than rB , since the latter needs to be a monotonically increasing variable. This decaying effect on sN is represented by a capacitor and resistor in parallel, shown in the the schema of Figure 5.16. The filter can be represented with the differential equation sN (t) dsN (t) =− , dt RC
(5.21)
which models the proportional decay in the population size sN (t). This model approximates that the inhibitory synapses in the population lose their potential by a uniform probability, without considering the exact duration of activation. Taking the derivative of the original definition of increase in sN (t) from (5.17) as drB (t − µBB ) dsN (t) = p− , BB N dt dt and adding it to (5.21) as external input, we get dsN (t) p− N drB (t − µBB ) sN (t) = BB − , dt C dt τ 140
CHAPTER 5. A STOCHASTIC POPULATION APPROACH TO THE PROBLEM OF STABLE RECRUITMENT HIERARCHIES where τ = RC, the decay time constant. Simulation results in Figure 5.17 indicate that the decay indeed reduces the gain of the oscillation. Nevertheless, it is not sufficient to prevent oscillations altogether, since the best case shown in Figure 5.18 is free of oscillations, but rB never settles to a stable level. More importantly, the steady-state value of rB is governed by an unstable balance of the decay parameters with the input.
5.5.4
Lateral Excitatory Feedback
Assuming the only cause of the oscillations is the fragile balance between the sN and rB , we test the effects of adding a complementary excitatory feedback. The necessary amount of excitatory feedback p+ ¯B at the desired level is calculated for two different BB for keeping r cases. First, we look at the case where there is no external input from A. In this case, the positive feedback input to the system is given as
sP (t) = rB (t − µBB )p+ BB N .
By looking at the steady-state values, we can calculate the positive feedback amount as
− p+ BB = 2/ro N (1 − ro pBB ) .
− Notice that p+ BB is only defined when ro pBB < 1, and otherwise becomes negative.
The second case we used to calculate p+ BB includes the external input from rA , and defines Z sP (t) =
t
nAB (τ )dτ + rB (t − µBB )p+ BB N .
0
141
rB
CHAPTER 5. A STOCHASTIC POPULATION APPROACH TO THE PROBLEM OF STABLE RECRUITMENT HIERARCHIES
160 140 120 100 80 60 40 20 0
Delayed-feedback with λ = 20.00, p− = 0.07, µBB = 2.00, ∆t = 0.100, rA = 10 BB rB sP sN
0
5
10
15 20 25 time [ms]
30
35
40
rB
(a) Non-rectified dipolar model, without the decaying sN . Decaying sN with R = 5.00, C = 1.00, λ = 20.00, p− BB = 0.07, µBB = 2.00, ∆t = 0.100, rA = 10 160 r B 140 sP 120 sN 100 80 60 40 20 0 0 5 10 15 20 25 30 35 40 time [ms]
(b) Same conditions with decaying sN .
Figure 5.17: Effect of a decaying sN population on the oscillations. The plot features a dipolar population model, with uniform-delay feedback case and a decaying sN . It can be seen that the gain of the oscillation in the original model (a) is reduced in the case with the decaying sN (b).
142
rB
CHAPTER 5. A STOCHASTIC POPULATION APPROACH TO THE PROBLEM OF STABLE RECRUITMENT HIERARCHIES Decaying sN with R = 1.00, C = 5.00, λ = 20.00, p− BB = 0.07, µBB = 2.00, ∆t = 0.100, rA = 10 160 r B 140 sP 120 sN 100 80 60 40 20 0 0 5 10 15 20 25 30 35 40 time [ms]
Figure 5.18: The dipolar population model behavior, with uniform-delay feedback case and a decaying sN population. This best case to stop oscillations is obtained with R = 1 and C = 5, that is, a time constant of τ = 5 ms. This time, dependent on rA , we find s p+ BB
=
−rA p+ AB
+
2ro N (1 − ro p− BB )
!, ro ,
which is also undefined (takes complex values) for ro p− BB ≥ 1. For both cases, simulations indicate failure to control the oscillations and no further insight was gained.
5.5.5
Low-Pass Filter
Since none of these more biologically-motivated methods helped prevent the oscillations, we now take the path of applying an effective engineering approach and then discussing its biological implications. Here, we apply a non-decaying low-pass filter on rB as seen in the block diagram of Figure 5.19. The low-pass filter attenuates high-frequency components of the original rB signal. The cut-off frequency is inversely proportional to the RC constant of the low-pass circuit shown in the figure.
143
CHAPTER 5. A STOCHASTIC POPULATION APPROACH TO THE PROBLEM OF STABLE RECRUITMENT HIERARCHIES Low-pass filter
sP (t) Recruit r˜B (t) Neuroids sN (t) in B
R
rB (t)
C
Figure 5.19: Block schema of the low-pass filter on rB for preventing oscillations in the dipolar synaptic population model. The dynamics of the circuit is represented by the differential equation drB (t) r˜B (t) − rB (t) = , dt τ where τ = RC is the time constant of the circuit, and r˜B is the recruitment level as previously defined by (5.16). Simulations plotted in Figure 5.20 indicate that the circuit is attenuating unwanted oscillations. By adjusting τ , rB can be flattened while still maintaining the stability with respect to varying input rA as seen from Figure 5.21.
5.5.6
Discussion
The low-pass filter successfully prevented the oscillations. We now provide a biological interpretation of these results. The filter defined above significantly limits the speed of the change in rB . Since rB represents the number of distinct neuroids fired, the filter can be interpreted as a mechanism that slows down the rate of new firings. This can happen only if some neuroids do not fire even though they receive enough excitation. This is exhibited if transmission at the synapses is unreliable (Dobrunz and Stevens, 1997), since the spike trigger mechanism is less likely to be unreliable (Mainen and Sejnowski, 1995). The stochastic process governing the synaptic release can be represented by a random variable. It is
144
CHAPTER 5. A STOCHASTIC POPULATION APPROACH TO THE PROBLEM OF STABLE RECRUITMENT HIERARCHIES
Delayed-feedback with λ = 20.00, p− BB = 0.09, µBB = 1.00, ∆t = 0.100
20
rB
rA = 15 rA = 10 15 rA = 5 10 5 0
0
5
10
15
20 25 time [ms]
30
35
40
(a) Non-rectified dipolar model, without the low-pass filter.
20
Disynaptic low-pass rB with R = 1.00, C = 5.00, λ = 20.00, p− BB = 0.09, µBB = 1.00, ∆t = 0.100
rB
rA = 15 rA = 10 15 rA = 5 10 5 0
0
5
10
15
20 25 time [ms]
30
35
40
(b) Same conditions with the low-pass filter with τ = 5 ms.
Figure 5.20: Effect of a low-pass filter on the oscillations. The plot features a dipolar population model, with uniform-delay feedback case and a low-pass filter on rB . It can be seen that the gain of the oscillation in the original model (a) is dramatically reduced in the case when the filter is applied (b).
145
CHAPTER 5. A STOCHASTIC POPULATION APPROACH TO THE PROBLEM OF STABLE RECRUITMENT HIERARCHIES
rB
Disynaptic low-pass rB with R = 5.00, C = 5.00, λ = 20.00, p− BB = 0.09, µBB = 1.00, ∆t = 0.100, rA = 10 12 rA = 15 10 rA = 10 rA = 5 8 6 4 2 0
0
5
10
15
20 25 time [ms]
30
35
40
Figure 5.21: The dipolar population model behavior, with uniform-delay feedback case and a low-pass filter applied to rB . The low-pass filter prevents oscillations. This result which stops oscillations is obtained with R = 5 and C = 5, that is, a time constant of τ = 25 ms. Even for lower values of τ , the oscillations die out eventually. As τ increases, rB flattens, but the dynamics of the system may be compromised if it is chosen too large. reasonable to assume that this variable models the limited resources in a localized area of the brain that may put an upper bound on the change in the local firing rate. Therefore, we propose that this random variable depends on the firing rate of a local neuroid population. This is unlike the work of Maass and Natschläger (2000) which assumes unreliable synapses can be modeled as independent random variables. There can be a number of possible responsible candidates for a renewable resource which is supplied in limited amounts to a localized area. For instance, this resource can be the energy supply in terms of ATP molecules or Oxygen content, or any of the neuromodulators or chemicals that are responsible for a synaptic release. Calcium is also a possible candidate since it plays an important role in the synaptic transmission process. The availability of this limited resource should be analyzed further to test if it can pose a limit as required by our model. Another question is whether the degree of synchrony can be maintained during propagation in the hierarchy. The noisy delays in our model may disrupt the initial synchrony 146
CHAPTER 5. A STOCHASTIC POPULATION APPROACH TO THE PROBLEM OF STABLE RECRUITMENT HIERARCHIES of inputs. Presumably, the window of synchrony widens at each stage of the hierarchy. However, spiking neurons are known to act as band-pass filters because they only fire when incoming spikes are within a short time interval (Diesmann et al., 1999). Therefore, the effects of spikes which stray too far away from the center of the synchrony window are lost. This stops the synchrony window from widening infinitely. Even though the lost spikes may decrease rB , we already showed that, for variations in the input, rB will always converge to the desired fixed point as the process is repeated. Thus, noisy delays do not disrupt recruitment of hierarchies.
5.6
Chapter Conclusions
In conclusion, the recurrent lateral inhibition helps keep spiking activity at a desired level. Our simulation results indicate that, in the closed-loop system, rB approaches the desired level ro for the generalized recruitment scenario from the source area to the projection area. This process reaches a stable recruitment level when iterated. That is, it solves the variance problem in recruitment hierarchies. The models predict system parameters that enable stable recruitment. The dipolar model allows calculating the lateral inhibitory feedback connectivity parameter p− BB with (5.20) in terms of the free parameters of the network. These free parameters are: the replication factor ro , the number of neuroids NB at a localized area, and the amplification factor λ for the feedforward excitatory connectivity between areas. It is also shown how the choice of λ affects the speed of convergence to a desired replication factor in Figure 5.14. These results complement the analytical study of Maass (2000) which shows that the computational power of a soft WTA does not diminish if there is no synaptic modification on the inhibitory synapses. 147
CHAPTER 5. A STOCHASTIC POPULATION APPROACH TO THE PROBLEM OF STABLE RECRUITMENT HIERARCHIES The aim of this work is to draw predictions on both operating parameters for a neural model and working principles of brain mechanisms. Therefore, further neural simulations using the predicted network parameters are needed. Our experiments uncovered complications with our initial proposal of the boost-and-limit mechanism. The nature of these complications, such as the unwanted oscillations, are described here. To compare the models and conditions tested in this work, it can be said that the dipolar synaptic population model offers the advantage of calculating the return-map of the uniform-delay feedback condition. As a result, the asymptote of the steady-state value r¯B of rB (t) can also be calculated with (5.19). This asymptote represents the theoretical limit of total firing activity in the destination area. We also analyzed the robustness of the model with respect to changes in the feedback delay. An increase in the delay implies that the period of oscillations increases, as described earlier. The frequency of oscillations, on the other hand, decreases and the low-pass filter dynamics needs to be adapted to suppress the lower frequencies by decreasing its cut-off frequency. Our tests indicated that small increases in the filter time constant can cope with preventing lower frequency oscillations. Nevertheless, the feedback delay should not be too large (e.g., < 10 ms) in any case. This is consistent with the fast shunting inhibition exhibited by the lateral inhibitory interneurons employed by models of CA3 region of the mammalian hippocampus (Minai and Levy, 1993, 1994). The undesired oscillatory activity is prevented in the model by a low-pass filter at the output. This may resemble a limited resource in the local neural circuit. The plausibility of such a mechanism requires further investigation. Another plausible solution may be achieved by employing noisy feedback delays for lateral inhibition. As another possible future direction of research, this kind of mathematical analysis can be useful in predictions for seizure control (e.g., by modeling the high excitatory connection density and burst behavior in
148
CHAPTER 5. A STOCHASTIC POPULATION APPROACH TO THE PROBLEM OF STABLE RECRUITMENT HIERARCHIES hippocampal region CA3 (Traub et al., 1999)).
149
Chapter 6 Summary of Conclusions I started working on this dissertation with the ambition of implementing an AI system that is based on the neuroidal framework of Valiant. However, it turned out that there are many smaller problems of interest before coming to the realization of such a large system. My work has focused on two major issues. First, the problems that arise when a spiking neuron model is used to augment the definition of Valiant’s neuroids with less restrictive timing assumptions is presented in Chapter 4. The results indicate that, for employing temporal binding, the delay and the connection topology parameters of the underlying circuit is important. I proposed constraints on theoretical parameters to build these circuits. Namely, the proposed lower bounds are for the tolerance window Γ, and the phase segregation Φ parameters. To verify these lower bounds, simulations were run on networks with varying size direct/indirect connection topologies. I tested for binding errors among multiple hypothetical objects presented, while the tolerance and segregation parameters were swept over a range including the predicted values. I conclude that appropriately chosen tolerance and segregation parameters enable use of temporal binding for recruitment learning in direct/indirect connection topologies. 150
CHAPTER 6. SUMMARY OF CONCLUSIONS Furthermore, using a spiking neuron model is appropriate for recruitment learning, which is originally proposed with simpler discrete-time neuron models. A recent study is consistent with this view (Shastri, 2001). I also improved the existing solutions to the variance problem in hierarchical recruitment with aid of a stabilizing mechanism proposed in §3.1.8. As a result, the simulations indicate that, up to roughly half of the predicted capacity can be achieved with reasonable performance. The statistical variance inherent in the recruitment method prevents recruiting a chain of concepts in a cascade. This problem is especially apparent in smaller network sizes, such as we employ here with a low number of neuroids (N ∼ 102 ) for each area. Earlier work on the stability of the recruitment method for larger network sizes such as N ∼ 108 (Valiant, 1994), and under asymptotic conditions N → ∞ (Gerbessiotis, 1993, 2003) indicate recruitment can be used up to four levels deep. This stabilizing method can potentially be applied to these larger networks. In this context, I still need to design neural circuits that adaptively adjust the tolerance and segregation parameters, rather than calculating and setting them to fixed values according to each topology. Since cortical circuits are known to change, tolerance and segregation should be managed dynamically according to changing conditions. For managing tolerance, it can be shown that, if only the membrane resistance is externally manipulated to vary the membrane time constant, the desired effect can be achieved (see Appendix A.3). Second, I propose a biologically realistic solution to the above variance problem in hierarchical recruitment learning in Chapter 5. Recruitment learning in hierarchies is an inherently unstable process (Valiant, 1994). Parameter conditions for a network that exhibits stable recruitment hierarchies are given. In conclusion, the recurrent lateral inhibition helps keep spiking activity at a desired level. Our simulation results indicate that, in the closed-loop
151
CHAPTER 6. SUMMARY OF CONCLUSIONS system, rB approaches the desired level ro for the generalized recruitment scenario from the source area to the projection area. This process reaches a stable recruitment level when iterated. That is, it solves the variance problem in recruitment hierarchies. The models predict system parameters that enable stable recruitment. The dipolar model allows calculating the lateral inhibitory feedback connectivity parameter p− BB with (5.20) in terms of the free parameters of the network. These free parameters are: the replication factor ro , the number of neuroids NB at a localized area, and the amplification factor λ for the feedforward excitatory connectivity between areas. It is also shown how the choice of λ affects the speed of convergence to a desired replication factor in Figure 5.14. These results complement the analytical study of Maass (2000) which shows that the computational power of a soft WTA does not diminish if there is no synaptic modification on the inhibitory synapses. The aim of this work is to draw predictions on both operating parameters for a neural model and working principles of brain mechanisms. Therefore, further neural simulations using the predicted network parameters are needed. Our experiments uncovered complications with our initial proposal of the boost-and-limit mechanism. The nature of these complications, such as the unwanted oscillations, are described here. To compare the models and conditions tested in this work, it can be said that the dipolar synaptic population model offers the advantage of calculating the return-map of the uniform-delay feedback condition. As a result, the asymptote of the steady-state value r¯B of rB (t) can also be calculated with (5.19). This asymptote represents the theoretical limit of total firing activity in the destination area. We also analyzed the robustness of the model with respect to changes in the feedback delay. An increase in the delay implies that the period of oscillations increases, as described earlier. The frequency of oscillations, on the other hand, decreases and the low-pass filter
152
CHAPTER 6. SUMMARY OF CONCLUSIONS dynamics needs to be adapted to suppress the lower frequencies by decreasing its cut-off frequency. Our tests indicated that small increases in the filter time constant can cope with preventing lower frequency oscillations. Nevertheless, the feedback delay should not be too large (e.g., < 10 ms) in any case. This is consistent with the fast shunting inhibition exhibited by the lateral inhibitory interneurons employed by models of CA3 region of the mammalian hippocampus (Minai and Levy, 1993, 1994). The undesired oscillatory activity is prevented in the model by a low-pass filter at the output. This may resemble a limited resource in the local neural circuit. The plausibility of such a mechanism requires further investigation. Another plausible solution may be achieved by employing noisy feedback delays for lateral inhibition. As another possible future direction of research, this kind of mathematical analysis can be useful in predictions for seizure control (e.g., by modeling the high excitatory connection density and burst behavior in hippocampal region CA3 (Traub et al., 1999)).
153
Appendix A Formal Definitions A.1
A.1.1
Neuroidal Network Model
Scalars and Sets
• N is the total number of neuroids in the network. It is a constant and can be chosen arbitrarily. It will initially be taken as N ∼ 104 for practical purposes.1 ˜ = (V˜ , E) ˜ is the directed random multipartite graph (see § 3.1.3 on page 62). G ˜ is • G composed of an arbitrary number of subgraphs of each of the form Gy = (Vy , Ey ) representing a cortical area y. Therefore we can define: S – V˜ is the set of vertices (neuroids) composed of V˜ = { y Vy }. S – E˜ is the set of connections between neuroids composed of E˜ = { y Ey }. Ey is the set of pairs (i, j) in which vertex i in cortical area y is connected to vertex j. Note that j can be located in any area. For a realistic implementation this number should be larger, so to say close to 1011 (Valiant, 1998, p.2). The success of taking a lower number depends whether the Valiant’s proposed architecture can be scaled down for small experiments. 1
154
APPENDIX A. FORMAL DEFINITIONS • ry is the number of neuroids allocated for a concept, i.e. the replication factor, for a cortical area. It is constant and can be chosen arbitrarily. It will be set to r = 10 for practical purposes.2 • p is the probability for a pair (i, j) to be connected in a simple random graph and is defined as p = (µ/N r)−1/2 . In case of having a random multipartite graph, this probability becomes q µr y2 1 py1 ,y2 = ry , where y1 , y2 are the source and destination area, respectively.3 Ny 1
2
• W is the weight size N × N matrix holding the values which connect neuroids. – An element wki ∈ W is the weight connecting neuroid k to neuroid i. The weight value can either be inhibitory or excitatory, but fixed-sign which means it can only take non-positive values or nonnegative values for the course of its existence.4 – The net input wi to a neuroid i is wi =
X
wki .
k firing ˜ (k,i)∈E
• si is the mode for node i, and is defined as (qi , Ti ), where qi is the state of the neuroid (1)
(2)
(γ)
and Ti = {Ti , Ti , . . . , Ti } is a vector of γ numbers. It is used differently for (1)
different algorithms. Ti
always holds the threshold value of the neuroid and will be
aliased as Ti in algorithms. The threshold value is used for entering the firing state. – qi can have any of the states given in set Q={“AR: Available Relay,” “BR: Busy Relay,” “AM: Available Memory,” “AM1,” “UM: Unsupervised Memory,” 2 Valiant chooses r = 50 for large N but doesn’t impose limitations on choosing this value. Therefore we use a lower value to be able to fit more information with less redundancy, for testing purposes, and simplicity (Valiant, 1994, p.69). 3 Random multipartite graphs are described in § 3.1.3 on page 62 and the derivation of the probability function is given in Appendix A.2 on the following page. 4 Having said this, the algorithms defined only make use of nonnegative weights (unless denoted otherwise), consistent with the discussion in (Valiant, 1994, p.59).
155
APPENDIX A. FORMAL DEFINITIONS “UMT: Unsupervised Memory of a Timed Conjunction,” “SM: Supervised Memory,” “AP: Available Probabilistic” “SL: Supervised Inductive Learning,” } as well as others.
A.1.2
Functions
• δ(si , wi ) = s0i is the mode update function which decides on the consequent state and parameters of the neuroid. 0 • λ(si , wi , wji , fj ) = wji is the weight update function which decides on the consequent
weights incoming to the neuroid.
A.1.3
The Area
The area is a collection of neuroids. • The area is defined as the tuple (Gy , W, X, δ, λ), using symbols defined above.
A.1.4 The Network The network is a collection of areas. ˜ W, X, δ, λ), using symbols defined • The neuroid network is defined as the tuple (G, above.
A.2
Derivation of Probability of Connection in Random Multipartite Graphs
We demonstrate here the mathematical deduction to find the probability of connection described in §3.1.3 for random multipartite graphs. This will be similar in essence to that of simple random graphs given by Valiant (Valiant, 1994, pp.70–71). The multipartite graph 156
APPENDIX A. FORMAL DEFINITIONS Source Area As Total: Ns Neuroids
Destination Area Ad Total: Nd Neuroids ps,d
x ˜
rs Nd ps,d
rs
rd y˜
z˜
rs Nd ps,d
rs
Figure A.1: Random multipartite graph demonstrating the recruitment process. Ensembles and their projections are shown with circles with their size printed inside. consisting of two areas, one source area, and a destination area as in Fig. A.1 is considered. The ensembles x˜ and y˜ of size rs in the source area As project to destination area Ad in order to recruit ensemble z˜. Definition 1. The probability of a neuroid in As being connected to a neuroid in Ad is ps,d . That is, ˜ i ∈ As , ∃nj ∈ Ad ) ps,d = P ((ni , nj ) ∈ E|∃n where ni , nj denote neuroids and E˜ is the set of edges, i.e. pairs of neuroids that are connected. Definition 2. Let the frontier EAd (˜ x) denote the set of neuroids that the ensemble x˜ project to in area Ad . Formally, ˜ . EAd (˜ x) = {ni |∃ni ∈ Ad , ∃nj ∈ x˜, ∃˜ x ⊂ As , (nj , ni ) ∈ E}
The set of neuroids recruited in Ad can then be represented as
z˜ = EAd (˜ x) ∩ EAd (˜ y) .
157
APPENDIX A. FORMAL DEFINITIONS We are interested in finding the probability ps,d given in Def. 1 so that the expected size of set z˜, is close or equal to replication factor rd of area Ad , that is
ε(|˜ z |) ' rd .
(A.1)
Definition 3. Let p∗ denote the probability that any neuroid in Ad being in set z˜ such that p∗ = P (ni ∈ z˜|ni ∈ Ad ) .
We construct p∗ by defining the following. Definition 4. The probability of a neuroid in Ad not being connected to a neuroid in As is ˜ j ∈ Ad , ∃ni ∈ As ) = p¯s,d P ((ni , nj ) 6∈ E|∃n = 1 − ps,d .
Definition 5. The probability of a neuroid in Ad not being connected to any of the neuroids of an ensemble of size rs in As is ˜ j ∈ Ad , ∀ni ∈ x˜, ∃˜ P ((ni , nj ) 6∈ E|∃n x ⊂ As ) = (1 − ps,d )rs .
Definition 6. The inverse of the above quantity is of interest. That is, the probability of a neuroid in Ad being connected to any of the neuroids of an ensemble of size rs in As is ˜ j ∈ Ad , ∀ni ∈ x˜, ∃˜ P ((ni , nj ) ∈ E|∃n x ⊂ As ) = 1 − (1 − ps,d )rs .
Extending this, the probability of a neuroid in Ad being connected to any of the neuroids of 158
APPENDIX A. FORMAL DEFINITIONS two ensembles of each size rs in As is ˜ j ∈ Ad , ∀ni ∈ x˜ ∪ y˜, ∃˜ P ((ni , nj ) ∈ E|∃n x, y˜ ⊂ As ) = (1 − (1 − ps,d )rs )2
(A.2)
which is p∗ given in Def. 3. This binomial can be expanded to yield
p∗ = rs2 p2s,d + O(p3s,d )
(A.3)
in which the second term is a quantity that diminishes proportionately with p3s,d . This is a sufficiently small value with the parameters used here and can be ignored. The expectation in (A.1) can now be calculated by
ε(|˜ z |) = Nd p∗
giving equal probability independently to all Nd neuroids in Ad . Solving for finding a ps,d for desired expectation yields
r d = Nd p ∗
ps,d
= Nd rs2 p2s,d r 1 rd = r s Nd
(A.4)
(A.5)
resulting in the calculation given in (3.3).
A.2.1
Probability of Merging Connections from Different Areas
We show, in this section, that the result in (A.5) apply in cases such as in Fig. A.2. Notice that
159
APPENDIX A. FORMAL DEFINITIONS Source Area As1 Total: Ns1 Neuroids
x ˜
Destination Area Ad Total: Nd Neuroids r s1 ps1 ,d rs1 Nd ps1 ,d rd
Source Area As2 Total: Ns2 Neuroids
z˜
rs2 Nd ps2 ,d ps2 ,d
y˜
rs2
Figure A.2: Random multipartite graph where connections are merging in from two distinct areas to the destination. The figure legend is the same as in Fig. A.1 on page 157. we need to calculate two probability parameters, one from each source area. However it can be shown that the earlier result can be used to calculate independently the probability of each connection to give the desired expected size for recruitment at the destination. Let r
ps1 ,d
1 = rs1
rd , Nd
r
ps2 ,d
1 = rs2
rd . Nd
and
The probability p∗ of a unit in Ad to be in the recruited set in Def. 3. We have used in (A.3) the binomial expansion and ignored higher order terms. We can expand the equation as
p∗ = rs ps,d rs ps,d
to show the combination of the independent probabilities of choosing the two source
160
APPENDIX A. FORMAL DEFINITIONS ensembles. In the case the connections are merging in from two source areas, As1 and As2 , it will be p∗ = rs1 ps1 ,d rs2 ps2 ,d which satisfies the equality in (A.4) yielding the desired output ensemble size.
A.2.2 Connection Probability in the Generalized Recruitment Scenario Here, we show the derivation of Eq. (5.1), which is the required connection probability p+ AB of a neuroid in area A to a neuroid in area B as shown in Figure 5.2(b). This derivation is adapted from the probability calculation for recruitment of conjunctions of two inputs by Valiant (1994). We assume the size of the input set is |RA | = ro , which is the desired replication factor. We use p ≡ p+ AB , r ≡ ro here for simplicity. First, we look at the probability of a neuroid in B to be recruited. Recruitment requires two connections from active sources. Since we only have one input set RA , a recruitment candidate in B needs to have two connections from neuroids in set RA . The probability of the candidate being in the projection set of RA can be calculated from its probability of not having connections to any neuroid in set RA with (1 − p)r . Thus, its probability of being in the projection set becomes 1 − (1 − p)r . Since we require the candidate neuroid to receive projections from at least two neuroids in RA , we can define the probability of a neuroid in B being recruited as � p∗ = (1 − (1 − p)r ) 1 − (1 − p)r−1 . Expanding (A.6), we get
p∗ = 1 − (1 − p)r−1 (2 − p) + (1 − p)2r−1 ,
161
(A.6)
APPENDIX A. FORMAL DEFINITIONS where the power terms can be expanded using the binomial theorem. Assuming p � 1, we can ignore terms with pk for k > 3 � (r − 1)(r − 2) 2 3 p = 1 − 1 − (r − 1)p + p + O(p ) (2 − p) 2 � � (2r − 1)(2r − 2) 2 3 + 1 − (2r − 1)p + p + O(p ) . 2 ∗
�
Simplifying, we get p∗ = −rp2 + r2 p2 + O(p3 ) .
(A.7)
The desired property of recruitment is to yield an output set with the same size of the input set. The expected size of the recruited set RB is |RB | = p∗ N ' (−rp2 + r2 p2 )N .
We aim to satisfy the equality p∗ N = r. Solving for p, we get 1
p' p
N (r − 1)
with an error decreasing with O(p3 ) as N increases. Adding an amplification factor
√
λ
similar to Valiant’s proposals yields the definition in Eq. (5.1).
A.2.3
A More Realistic Probability Calculation for the Dipolar Model
A more general way of computing the expected number of neuroids, given dipolar synaptic population sizes, is counting not just the occurence of necessary number of activated synapses, but also for more. This implies looking for conjunctions of two or more excitatory
162
APPENDIX A. FORMAL DEFINITIONS activated sysnapses from population sP ,and checking for one or more activated inhibitory synapses from sN , rather than only looking for the existence of one. As in Section 5.5, we give the expected value calculation with an error O(h3 ), h = 1/N , where we use N ≡ NB for simplicity. The probability of failure to recruit can be explained with having no or only one synapse from sP , that is p¯p = (1 − h)sP + h (1 − h)sP −1 .
Thus, the probability of finding two or more synapses from sP is pP = 1 − p¯P . The probability of finding no synapses from the inhibitory population sN on a neuroid is p¯n = (1 − h)sN .
The expected number of recruited neuroids is then calculated using the conjunctive probability of pp and p¯n , rB = N p¯n pp .
A.3
Time-to-spike Shortens if Membrane Time Constant is Increased by Only Varying the Resistance
Rowland (2002) has claimed that “the firing time and the time constant are linearly related” in criticising our previous work (Günay and Maida, 2001). Here, we clarify that if the time constant is increased by only varying the resistance and keeping the capacitance constant, then the claim is incorrect. We then give a formal proof of this. Since we previously did not define how the time constant was dynamically changed, we find the criticism just. However, this was our original intent in the previous work, where the membrane time constant is lengthened by 163
APPENDIX A. FORMAL DEFINITIONS v I R
C
Figure A.3: Membrane circuit equivalent for I/F model. manipulating membrane channels to increase the resistance rather than the capacitance. Another criticism of Rowland is that there is no observation for different time constants in higher cognitive areas of the brain to support our view. However, studies which show that the membrane time constant dynamically changes in the cortex (Koch et al., 1996) can explain how different time constants may be employed in different parts of the brain. These studies suggest that the change is due to variations in the membrane conductance, which is consistent with our view here.
Introduction The membrane equivalent circuit of a leaky Integrate-and-Fire (I/F) neuron is given in Figure A.3. The membrane equation for an I/F neuron is
C
dv v =I− , dt R
(A.8)
where R and C are the resistance and capacitance parameters of the membrane, respectively, and I is the constant external current. The membrane time constant is then defined as τ = RC. When (A.8) is integrated with
164
APPENDIX A. FORMAL DEFINITIONS initial conditions v(0) = v0 = 0, we get � v = RI 1 − e−t/τ .
(A.9)
In order to find the time-to-spike, from (A.9) we can calculate the time T it takes to reach a fixed threshold V as � T = τ ln
RI RI − V
� .
(A.10)
Looking at (A.10) it is possible to conjecture, as Rowland (2002) did, that T mainly depends linearly on the time constant τ . However, we prove here that this is not necessarily true. Especially if only the resistance R is varied and the capacitance C is kept contant in increasing the time constant τ , then the logarithmic term subdues the linearly increasing effect of the first term τ in (A.10). Therefore, contrary to Rowland’s claim, as R and so τ increases, the time-to-spike T decreases. We first give an intuitive explanation of this phenomenon with supporting information from neuroscience. We then give a formal proof and a computer simulation subsequently.
Justification There is an intuitive explanation to the refutation of Rowland’s claim, one which inspired this proof. We first explain the reason for choosing to increase the membrane time constant by only varying the resistance parameter R. Mainly, it is much more difficult to manipulate the capacitive properties of matter. The capacitance of a membrane depends primarily on the insulating properties and the thickness of the membrane, parameters which are static, thus unreasonable to suggest they vary over short periods of time. 165
APPENDIX A. FORMAL DEFINITIONS However, the resistance or the inversely related conductance parameter is easily varied by changing the volume of leakage between the inside and outside of the membrane. Most of the detailed neuron models, such as the Hudgkin-Huxley model, already use variable resistances to model the conductance of membrane channels. From our point of view Rowland’s claim is an unintuitive interpretation of the membrane behavior. The claim is that if the membrane time constant increases, it follows that the time it takes to charge the membrane potential is longer. However, when only the resistance is varied, we expect the membrane to only take longer to leak and not to charge. If the resistance is higher, intuitively, the current flowing through the resistance will be smaller and it will take a longer time to discharge the capacitor. However, when filling the capacitor, if the input current is an independent current source (such as a spike received from a remote neuron) then there is a fixed amount of current coming on the membrane. When the resistance is varied it changes how much of this curent is lost while charging the capacitor. That is, if we increase the resistance, then the leakage will be less and more current will stay on the capacitor. This behavior becomes clearer by interpreting (A.8). The amount of voltage increase for a capacitor C (left hand side) depends on how much current is supplied externally by I and how much current is lost over the resistance R given the current voltage v.
166
APPENDIX A. FORMAL DEFINITIONS Proof In order to mathematically asses the effect of varying R on the expression T in (A.10), we need to investigate the differentiation of T . That is, we calculate the derivative � � �� d RI dT = RC ln dR dR RI − V � � � �� � RI d RI +R C ln = C ln RI − V dR RI − V � � � � � � RI d RI RI = C ln + RC / RI − V dR RI − V RI − V � � � � RI I(RI − V ) − IRI RI − V = C ln + RC RI − V RI (RI − V )2 � � (−V ) RI = C ln +C RI − V RI − V � � � � RI V = C ln − . RI − V RI − V
(A.11)
Since RI is the asymptotic value for the membrane potential, it is trivial that the threshold should satisfy V < RI . If we observe the limit case where V → RI for (A.11), we get � � � � dT V V lim ' lim C ln − {qi = AM, wi ≥ 1} ⇒ {qi ← AM1, Ci ← 1, λi , Di ← wi } .
Ci will count down for too low activation if any presynaptic neuroids were firing. Then the suggested threshold Di is lowered and weights are also adjusted to make the neuroid come 3
The functionality of both Ci and Di are designed to be as simple as possible in order to find an equivalent LSM at later stages of this research. It can be argued that the functionality of Ci can be emulated by using a low-pass filter to detect stable activation for memorization (avoiding the need to have the state AM1 altogether).
195
APPENDIX C. ALGORITHMS ON NEUROIDS close to firing next time.
t1 ≡ t0 + ∆t :
< irrelevant > {qi = AM1, wi < Di , (∃j)fj = 1} ⇒ {Ci ← Ci − 1, λi , Di ← wi } .
Ci will count up when neuroid has enough activation but the fitness criterion is not reached. Then the suggested threshold Di is increased and weights are also adjusted to make the neuroid favor the current presynaptic firings next time.
t2 ≡ t1 + ∆t :
x˜2 < relevant > {qi = AM1, wi ≥ Di , Ci < α − 1} ⇒ {Ci ← Ci + 1, λi , Di ← wi } .
If the neuroid is fit enough it will go into state UM, the suggested threshold Di will be made actual by assigning it to the threshold Ti .
t3 ≡ t2 + ∆t : {qi = AM1, wi ≥ Di , Ci ≥ α − 1} ⇒ {qi = UM, Ti ← Di }
where α is the number of steps required to reach a stable state, satisfying α > 1 and Ci ≤ α.
196
APPENDIX C. ALGORITHMS ON NEUROIDS C.2
Supervised Training
C.2.1
Supervised Memorization—SM
Also known as the LINK operation as defined in (Valiant, 1994, Ch.14). An algorithm to be applied to the model has been given in (Valiant, 1994, pp.94–97). SM is superceded by the SL explained next in §C.2.2.
C.2.2 Supervised Inductive Learning—SL The Supervised Inductive Learning operation replaces the functionality of SM described above. The state SL is reserved for inductive learning. We are using the neuroid parameter (k)
Ti
to keep track of failure and trial counts, in order to have a fitness criterion. The neuroid
will go to mode SLL when it is fit enough, and will exhibit threshold firings. The neuroids have to be notified by the supervisor system with an external operation. We have two different states between which we switch to indicate if the neuroid’s output was correct or not. • SLR, where the output was correct and the neuroid will either do nothing or strengthen its excitatory synapses that received spikes. • SLW, where the output was incorrect and the neuroid has to correct itself. In this case, if (d − O) = 1 then vj ← vj α where α > 1, and vj ← vj /α if (d − O) = −1. According to the discussion in (Valiant, 1994, p.117), the threshold will not be modified in this algorithm. • SLN, where the inputs that are applied are irrelevant for the concept being learned, therefore the neuroid stays idle without making any changes in its state or weights.
197
APPENDIX C. ALGORITHMS ON NEUROIDS The overall progress of the states of the algorithm will be similar of the one described in the timed conjunction section above, in §C.1.2.
198
Appendix D Supplemental Compact Disc The attached Compact Disc (CD) contains details of the simulator software and electronic copies of this document.
199
Index Abeles (1991), 23, 26, 27, 208
Cannon et al. (2002), 107, 210
Abeles (1994), 12, 27, 208
Carlson et al. (1999), 189, 210
Amari (1974), 116, 208
Carpenter and Grossberg (1987), 59, 210
Anderson and Rosenfeld (1990), 21, 208
Chandrakasan et al. (2001), 108, 210
Anderson (1972), 20, 208
Cleeremans (2003), 210, 220, 223
Anderson (1983), 1, 26, 208
Crick (1984), 26, 43, 210
Arik (2002), 117, 208
Cybenko (1988), 49, 211
Badel et al. (2003), 118, 208
Cybenko (1989), 49, 211
Barlow (1972), 21, 32, 209
Dawson and Berkeley (1993), 45, 53, 211
Barlow (1995), 23, 209
Diederich (1989), 52, 211
Berkeley et al. (1995), 49, 209
Diederich (1991), 15, 52, 211
Berkeley (1997), 20, 209
Diesmann et al. (1999), 12, 116, 147, 211
Bienenstock (1996), 55, 209
Dobrunz and Stevens (1997), 144, 211
Bienenstock (1999), 28, 32, 209
Domany et al. (1994), 208, 211, 225
Blumer et al. (1989), 47, 209
Downing (1998), 72, 211
Boussaoud et al. (1990), 11, 13, 209
Eaton (2002), 131, 211
Browne and Sun (2001), 44, 63, 209
Elias and Grossberg (1975), 117, 212
Bullinaria (1997), 49, 51, 210
Engel et al. (1999), 3, 5, 26, 27, 34, 212
Calvert and Marinov (2000), 117, 118, 210
Ettrich et al. (2003), v, 212
Campbell et al. (1999), 9, 210
Fahlman (1980), 40, 212 200
INDEX Fanty (1988), 15, 51, 212
Gerbessiotis (2003), 14, 15, 55, 69, 110,
Feldman and Bailey (2000), 15, 51, 52, 54,
115, 151, 213
212
Gerstner (1999), 15, 16, 25, 26, 70, 82, 83,
Feldman and Ballard (1982), 51, 117, 212
116, 213
Feldman (1982), 1, 3, 7, 27, 35, 37, 38, 51,
Gerstner (2001), 82, 213
58, 59, 119, 212
Gosling et al. (2000), 72, 182, 184, 213
Feldman (1990), 22–24, 33, 43, 44, 51, 54,
Gray et al. (1989), 5, 26, 34, 213
119, 212
Grossberg (1976), 20, 214
Fodor and Pylyshyn (1988), 48, 212
Hagan et al. (1996), 21, 214
Günay and Maida (2001), 11, 15, 56, 77,
Hasselmo and Wunsch (2003), 209, 213,
81, 86, 88, 112, 163, 214
215, 224
Günay and Maida (2002), 56, 57, 214
Hayward and Diederich (1996), 53, 215
Günay and Maida (2003a), 56, 116, 214
Hebb (1949), 18, 23, 26, 37, 215
Günay and Maida (2003b), 56, 214
Hertz et al. (1991), 21, 215
Günay and Maida (2003c), 56, 214
Hindmarsh (1983), 131, 215
Günay and Maida (2003d), 56, 107, 112,
Hinton et al. (1986), 23, 215
115, 214
Hinton (1990), 24, 215
Ganapathy and Titus (2003), 118, 213
Hopfield (1982), 19, 20, 117, 215
Gao and Hammerstrom (2003), 117, 213
Hornik et al. (1989), 49, 215
Gazzaniga (1995), 209, 213, 222
Horty (2001), 47, 216
Gerbessiotis (1993), 14, 15, 55, 69, 110,
Hummel and Biederman (1992), 6, 34, 45,
115, 151, 213
216
Gerbessiotis (1998), 115, 213
Indiveri (2000), 117, 118, 216 Iserles (1996), 171, 216
201
INDEX Jensen and Lisman (1996), 9, 10, 12, 216
McCarthy (1980), 47, 218
König and Engel (1995), 5, 26, 27, 34, 217
McCloskey (1991), 49, 50, 219
Kaszkurewicz and Bhaya (1994), 117, 216
McCulloch and Pitts (1943), 18, 219
Knoblauch and Palm (2001), 12, 70, 117,
Milner (1974), 27, 37, 219
216
Minai and Levy (1993), 115, 148, 153, 219
Koch et al. (1983), 122, 216
Minai and Levy (1994), 115, 148, 153, 219
Koch et al. (1996), 8, 164, 216
Minsky and Papert (1969), 19, 219
Kohonen (1972), 20, 217
Newell (1990), 1, 10, 26, 76, 189, 219
Lamme and Roelfsema (2000), 13, 93, 217
Niemeyer (2001), 72, 182, 219
Lamport (1994), v, 217
Niklasson and Bodén (1997), 49, 219
Lashley (1950), 23, 217
Nilsson (1998), 20, 46, 48, 219
Levy (1996), 115, 217
Nowak and Bullier (1997), 13, 93, 219
Lisman and Idiart (1995), 6, 9, 12, 34, 88,
O’Reilly et al. (2003), 6, 220
217
Page (2000), 22, 23, 220
Littlestone (1991), 94, 189, 217
Palm et al. (1997), 117, 220
Livingstone and Hubel (1988), 11, 13, 217
Phillips and Harbor (1991), 139, 220
Maass and Natschläger (2000), 146, 218
Ritz and Sejnowski (1997), 3, 5, 26, 34,
Maass (1995), 48, 218
220
Maass (1997), 18, 21, 25, 44, 218
Rosenblatt (1958), 19, 220
Maass (2000), 117, 147, 152, 218
Rosenblatt (1961), 5, 28, 31, 220
Mainen and Sejnowski (1995), 144, 218
Rowland (2002), 163, 165, 220
Mani and Shastri (1992), 10, 218
Rumelhart et al. (1986a), 20, 220
Mani and Shastri (1994), 53, 218
Rumelhart et al. (1986b), 20, 32, 48, 51,
Marr (1982), 54, 218
215, 221
202
INDEX Russell and Norvig (1995), 4, 221
Terman and Wang (1995), 6, 9, 12, 34, 88,
Schillen and König (1994), 6, 9, 10, 12, 34,
223
45, 88, 221
Thorpe and Imbert (1989), 25, 223
Seidenberg and McClelland (1989), 50,
Traub et al. (1999), 149, 153, 223
221
Treisman and Gelade (1980), 34, 223
Sejnowski and Rosenberg (1987), 50, 221
Treisman (1996), 5, 11, 33, 34, 191, 223
Senn et al. (2002), 107, 221
Treisman (2003), 7, 223
Shastri and Ajjanagadde (1993), 4, 6, 9,
Tymoshchuk and Kaszkurewicz (2003),
15, 34, 37, 41, 45, 51–53, 55, 56,
117, 224
211, 222
Urahama and Nagao (1995), 118, 224
Shastri (1988), 15, 41, 45, 51, 54, 221
Valiant (1984), 4, 46, 47, 224
Shastri (1993), 8, 221
Valiant (1988), 1, 7, 17, 41, 54, 224
Shastri (1999a), 4, 9, 45, 53, 56, 221
Valiant (1994), 1, 3, 6, 7, 10, 14–17, 41,
Shastri (1999b), 8, 41, 44, 45, 222
47, 54, 55, 59, 62, 69, 76, 77, 94,
Shastri (2000), 15, 222
110, 112, 115, 119, 121, 124, 151,
Shastri (2001), 5, 6, 8, 15, 41, 44, 45, 54,
155, 156, 161, 190, 191, 197, 224
70, 83, 110, 116, 117, 151, 222
Valiant (1995), 54, 224
Shiffrin and Schneider (1977), 11, 222
Valiant (1998), 17, 30, 52, 154, 224
Singer and Gray (1995), 3, 5, 8, 12, 26, 27,
Valiant (2000a), 1, 3, 15, 46, 47, 224
34, 43, 222
Valiant (2000b), 3, 4, 54, 224
Singer (1995), 5, 26, 27, 34, 222
Vapnik and Vezirani (1971), 47, 224
Sougné and French (1997), 6, 34, 223
Weisstein (1973), 22, 225
Sougné (1998a), 10, 222
Werbos (1974), 21, 225
Sougné (1998b), 10, 223
203
INDEX Wermter and Sun (2000a), 20, 48, 212,
brittle, 46
222, 225
cell
Wermter and Sun (2000b), 56, 225
cardinal, 21
Wickelgren (1979), 1, 3, 7, 40, 42, 59, 225
gnostic, 21
Widrow and Hoff (1960), 19, 226
grandmother, 22
von der Malsburg and Schneider (1986), 6,
circuits
27, 33, 34, 225
asynchronous, 109
von der Malsburg (1994), 3, 5, 6, 23, 26,
combination coding, 22, 33
27, 33, 39, 41, 225
computational learning theory, 4
von der Malsburg (1995), 5, 6, 23, 24, 27,
concept
37, 41, 51, 225
sensory, 95
adaptive resonance theory (ART) network,
connection probability, 61, 62, 91, 94, 113,
59
116, 118, 119, 124, 133, 155, 156,
AM, 156
159, 161, 162, 178
architecture for cognition, 1
connectionist, 1, 18, 27, 35, 49, 50, 52, 54
artifical intelligence (AI), 3
Structured, 15, 51
artificial intelligence (AI), 28, 46, 189
delay-tolerant conjoining, 77–79, 81–87
artificial neural network (ANN), 1, 18, 34,
differential equation, 27, 33, 71, 123, 129,
59
131, 140, 144, 171, 181
binding problem, 31
EPSP, 82, 84, 85, 87, 88, 121, 122, 186
variable, 28 black box, 49
fast links, 28, 32
boost-and-limit, 57, 69, 98, 111–113, 120,
filter band-pass, 147
123 204
INDEX supervised, 19, 59
low-pass, 143, 144
unsupervised, 18, 59
finite state machine (FSM), 1, 61, 67, 89,
linear threshold gate (LTG), 1, 18, 19, 25,
177, 188, 193, 194
48, 61
Gaussian, 121
linearly inseparable, 20
graphs
Lipschitz condition, 129
random
liquid state machine (LSM), 193
multipartite, 62, 154–156 simple, 1, 155, 156
membrane resistance, 151
hierarchical recruitment
neuroid, 59
variance problem, 119
neuroidal tabula rasa, 2
hybrid approach, 89
neuron doctrine for perception, 21, 23
hybrid neural systems, 20
Newell, 1 nonmonotonic reasoning, 47
illusory conjunctions, 34, 91
NTR, 2
integrate-and-fire (I/F), x, 70, 82, 114, 116,
oscillation, 9, 45, 94, 131, 134–136,
164 integrated circuit (IC), 108
138–146 oscillations, 114, 130
L-expression, 191 learning
PE, 4
n-shot, 107
phase coding, 45
backpropagation, 49
phase segregation, 9, 10, 15, 79, 86, 90, 98,
Hebbian, 94
102, 105, 108, 110, 111
one-shot, 59, 94
constraints, 14, 81, 150
perturbation, 49 205
INDEX probably approximately correct (PAC), 4,
SM, 156
47, 52
spike response model (SRM), 15, 70, 193
processing element, 4
SRM, 16 state variables, 193
recruitment
liquid, 193
learning, 1, 27, 43, 58, 191
stochastic population, 15, 113, 144
stability, 13–15, 57, 67, 69, 94, 97,
superposition catastrophe, 24
110, 112, 115, 118, 126, 134, 138,
synaptic population
144, 147, 151, 152
dipolar, 132
replication factor, 61, 63, 90, 94, 155
monopolar, 114, 122
representations
synchrony, 33, 45
concept, 34, 61
window, 193
distributed, 23, 33 distributed localist, 44, 63
temporal binding, 3–6, 8–12, 23, 33, 35,
holistic, 23
39, 44, 53, 54, 56, 59, 63, 64, 71,
holographic, 23
74, 81, 86, 110
localist, 21, 33
temporal correlation hypothesis, x, 3, 5, 34
modularly distributed, 44, 63
threshold, 2, 39, 64, 66, 67, 82, 84, 91,
redundant, 1, 4, 43–45, 63, 90, 117,
105, 107, 122, 155, 165, 167, 177,
155
193, 194, 197
unreliability, 22
concept quality, 98
residual activation, 39
Suggested, 193 Suggested , 193, 195
Shastri, 4
variable, 116
shruti, 53
time constant, 151
SL, 156 206
INDEX membrane, 83, 96 synaptic, 83 timed conjunctions, 16, 76, 78, 191 tolerance constraints, 14, 81, 150 noise, 23, 47, 105 window, 8–10, 15, 81–83, 86–88, 90, 96, 98, 100, 102, 105, 107, 110, 111, 193 UM, 156 UMT, 16, 156, 191 vicinal algorithm, 191 vicinal algorithms, 188 window effective, 84 winner-take-all (WTA), 69, 91, 117 k-WTA, 117 hard, 117 soft, 117 Winnow algorithm, 94 yellow Volkswagen, 21, 33
207
Bibliography Abeles, M. (1991). Corticonics: Neural circuits of the cerebral cortex. Cambridge University Press, Cambridge. Abeles, M. (1994). Firing rates and well-timed events in the cerebral cortex. In Domany et al. (1994), pages 121–138. Amari, S. (1974). A method of statistical neurodynamics. Kybernetik, 14:201–15. Anderson, J. A. (1972). A simple neural network generating an interactive memory. Mathematical Biosciences, 14:197–220. Anderson, J. A. and Rosenfeld, E., editors (1990). Neurocomputing: Foundations of research. MIT Press, Cambridge, MA. Anderson, J. R. (1983). The architecture of cognition. Harvard University Press, Cambridge, Massachusetts. Arik, S. (2002). A note on the global stability of dynamical neural networks. IEEE Transactions on Circuits and Systems—I: Fundamental Theory and Applications, 49(4):502–4.
208
BIBLIOGRAPHY Badel, S., Schmid, A., and Leblebici, Y. (2003). A VLSI Hamming artificial neural network with k-winner-take-all and k-loser-take-all capability. In Hasselmo and Wunsch (2003), pages 977–82. Barlow, H. (1995). The neuron doctrine in perception. In Gazzaniga (1995), chapter 26, pages 415–435. Barlow, H. B. (1972). Single units and sensation: A neuron doctrine for perceptual psychology. Perception, 1:371–394. Berkeley, I. S. N. (1997). A revisionist history of connectionism. Unpublished manuscript. Berkeley, I. S. N., Dawson, M. R. W., Medler, D. A., Schopflocher, D. P., and Hornsby, L. (1995). Density plots of hidden value unit activations reveal interpretable bands. Connection Science, 7(2):167–86. Bienenstock, E. (1996). On the dimensionality of cortical graphs. J. Physiol., Paris, 90:251–256. Bienenstock, E. (1999). Computing with fast functional links. In Workshop on principles of information coding and processing in the brain, Trieste, Italy. European Science Foundation. Blumer, A., Ehrenfeucht, A., Haussler, D., and Warmuth, M. K. (1989). Learnability and the Vapnik-Chernovenkis dimension. Journal of the ACM, 36(4):929–65. Boussaoud, D., Ungerleider, L. G., and Desimone, R. (1990). Pathways for motion analysis—cortical connections of the medial superior temporal and fundus of the superior temporal visual areas in the macaque. Journal of Comparative Neurology, 296(3):462–495.
209
BIBLIOGRAPHY Browne, A. and Sun, R. (2001). Connectionist inference models. Neural Networks, 14:1331–1355. Bullinaria, J. A. (1997). Analyzing the internal representations of trained neural networks. In Browne, A., editor, Neural Network Analysis, Architectures and Applications, chapter 1, pages 3–26. Institute of Physics, London. Calvert, B. D. and Marinov, C. A. (2000). Another k-winners-take-all analog neural network. IEEE Transactions on Neural Networks, 11(4):829–38. Campbell, S. R., Wang, D. L., and Jayaprakash, C. (1999). Synchrony and desynchrony in integrate-and-fire oscillators. Neural Computation, 11:1595–619. Cannon, R., Hasselmo, M. E., and Koene, R. A. (2002). From biophysics to behavior: Catacomb2 and the design of biologically plausible models for spatial navigation. Neuroinformatics, 1:3–42. Carlson, A. J., Cumby, C. M., Rosen, J. L., and Roth, D. (1999). SNoW User guide. Technical Report UIUCDCS-R-99-2101, University of Illinois, Urbana/Champaign. Carpenter, G. A. and Grossberg, S. (1987). A massively parallel architecture for a self-organizing neural pattern recognition machine. Computer Vision, Graphics and Image Processing, 37:54–115. Chandrakasan, A., Bowhill, W. J., and Fox, F., editors (2001). Design of high-performance microprocessor circuits. IEEE Press, New Jersey. Cleeremans, A., editor (2003). The Unity of Consciousness: Binding, Integration and Dissociation. Oxford University Press, Oxford.
210
BIBLIOGRAPHY Crick, F. (1984). Function of the thalamic reticular complex: The searchlight hypothesis. Proceedings of the National Academy of Sciences, 81:4586–4590. Cybenko, G. (1988). Continuous velued neural networks with two hidden layers are sufficient. Technical report, Department of Computer Science, Tufts University, Medford, MA. Cybenko, G. (1989). Approximation by superpositions of a sigmoidal function. Mathematics of Control, Signals, and Systems, 2:303–14. Dawson, M. R. W. and Berkeley, I. S. N. (1993). Making a middling mousetrap. Behavior and Brain Sciences, 16(3):454–5. Commentary on Shastri and Ajjanagadde (1993). Diederich, J. (1989). Instruction and high-level learning in connectionist networks. Connection Science, 1(2):161–180. Diederich, J. (1991). Steps towards knowledge-intensive connectionist learning. In Barnden, J. A. and Pollack, J., editors, Advances in Connectionist and Neural Computation Theory, volume 1. Ablex, Norwood, NJ. Diesmann, M., Gewaltig, M.-O., and Aertsen, A. (1999). Stable propagation of synchronous spiking in cortical neural networks. Nature, 402:529–533. Dobrunz, L. and Stevens, C. (1997). Heterogeneity of release probability, facilitation and depletion at central synapses. Neuron, 18:995–1008. Domany, E., van Hemmen, J. L., and Schulten, K., editors (1994). Models of Neural Networks, volume 2 of Physics of Neural Networks. Springer-Verlag New York, Inc. Downing, T. B. (1998). Developing distributed Java applications, Java RMI, remote method invocation. IDG Books Worldwide, Inc. 211
BIBLIOGRAPHY Eaton, J. W. (2002). GNU Octave. A Numerical Engineering Software Package. Elias, S. A. and Grossberg, S. (1975). Pattern formation, contrast control, and oscillations in the short term memory of shunting on-center off-surround networks. Biol. Cybern., 20:69–98. Engel, A. K., Fries, P., König, P., Brecht, M., and Singer, W. (1999). Temporal binding, binocular rivalry, and consciousness. Consciousness and Cognition, 8(2):128–151. Ettrich, M. et al. (2003). LyX. A document preparation system that allows the author to concentrate on content, rather than typesetting. Fahlman, S. E. (1980). The hashnet interconnection scheme. Technical report, Computer Science Dept. Carneige-Mellon University. Fanty, M. A. (1988). Learning in structured connectionist networks. Technical Report 252, Computer Science Department, University of Rochester, Rochester, New York. Feldman, J. and Bailey, D. (2000). Layered hybrid connectionist models for cognitive science. In Wermter and Sun (2000a), pages 14–27. Feldman, J. A. (1982). Dynamic connections in neural networks. Biol. Cybern., 46:27–39. Feldman, J. A. (1990). Computational constraints on higher neural representations. In Schwartz, E. L., editor, Computational Neuroscience, System Development Foundation Benchmark Series, chapter 13, pages 163–178. MIT Press. Feldman, J. A. and Ballard, D. H. (1982). Connectionist models and their properties. Cognitive Science, 6:205–54.
212
BIBLIOGRAPHY Fodor, J. A. and Pylyshyn, Z. W. (1988). Connectionism and cognitive architecture: A critical analysis. Cognition, 28:3–71. Ganapathy, S. K. and Titus, A. H. (2003). Toward an analog VLSI implementation of adaptive resonance theory (ART2). In Hasselmo and Wunsch (2003), pages 936–41. Gao, C. and Hammerstrom, D. (2003). Platform performance comparison of PALM network on Pentium 4 and FPGA. In Hasselmo and Wunsch (2003), pages 995–1000. Gazzaniga, M. S., editor (1995). The cognitive neurosciences. MIT Press, Cambridge, Massachusetts. Gerbessiotis, A. V. (1993). Topics in parallel and distributed computation. PhD thesis, The Division of Applied Sciences, Harvard University, Cambridge, Massachusetts. Gerbessiotis, A. V. (1998). A graph-theoretic result for a model of neural computation. Discrete Applied Mathematics, 82:257–62. Gerbessiotis, A. V. (2003). Random graphs in a neural computation model. International Journal of Computer Mathematics, 80:689–707. Gerstner, W. (1999). Spiking neurons. In Maass, W. and Bishop, C. M., editors, Pulsed Neural Networks, chapter 1, pages 3–54. MIT Press, Cambridge, MA. Gerstner, W. (2001). A framework for spiking neuron models: The spike response model. In Moss, F. and Gielen, S., editors, The Handbook of Biological Physics, volume 4, chapter 12, pages 469–516. North-Holland. Gosling, J., Joy, B., Steele, G., and Bracha, G. (2000). The Java Language Specification. Sun Microsystems, Inc., second edition. 213
BIBLIOGRAPHY Gray, C. M., König, P., Engel, A. K., and Singer, W. (1989). Oscillatory responses in cat visual cortex exhibit inter-columnar synchronization which reflects global stimulus properties. Nature, 338:334–337. Grossberg, S. (1976). Adaptive pattern classification and universal encoding: I. Parallel development and coding of neural feature detectors. Biological Cybernetics, 23:121–134. Günay, C. and Maida, A. S. (2001). The required measures of phase segregation in distributed cortical processing. In Proceedings of the International Joint Conference on Neural Networks, volume 1, pages 290–295, Washington, D.C. Günay, C. and Maida, A. S. (2002). Tolerating delays and preventing crosstalk in direct-indirect connection topologies with NNs employing recruitment learning. In Proc. of the Fifth ICCNS, Boston University. (Abstract only). Günay, C. and Maida, A. S. (2003a). Temporal binding as an inducer for connectionist recruitment learning over delayed lines. Neural Networks, 16(5-6):593–600. Günay, C. and Maida, A. S. (2003b). Using temporal binding for connectionist recruitment over delayed lines. In Proceedings of the International Joint Conference on Neural Networks. International Neural Network Society. Günay, C. and Maida, A. S. (2003c). Using temporal binding for hierarchical recruitment of conjunctive concepts over delayed lines. Submitted to Neurocomputing. Günay, C. and Maida, A. S. (2003d). Using temporal binding for robust connectionist recruitment learning over delayed lines. Technical Report TR-2003-2-1, Center for Advanced Computer Studies, University of Louisiana at Lafayette, Lafayette, LA, 70504-4330, U.S.A. 214
BIBLIOGRAPHY Hagan, M. T., Demuth, H. B., and Beale, M. (1996). Neural network design. PWS Publishing, Boston, MA. Hasselmo, M. and Wunsch, D. C., editors (2003). Proceedings of the International Joint Conference on Neural Networks, Portland, Oregon. Hayward, R. and Diederich, J. (1996). SHRUTI from the perspective of structure, time, memory and change. In Cognitive Modelling Workshop of the Seventh Australian Conference on Neural Networks, Australian National University Canberra. Hebb, D. O. (1949). Organization of behavior. Wiley, New York. Hertz, J., Krogh, A., and Palmer, R. G. (1991). Introduction to the theory of neural computation, volume 1 of Lecture notes of the Santa Fe Institute studies in the sciences of complexity. Addison Wesley, Reading, MA. Hindmarsh, A. C. (1983). ODEPACK, a systematized collection of ODE solvers. In Stepleman, R. S. et al., editors, Scientific Computing: Applications of Mathematics and Computing to the Physical Sciences, volume 1. North-Holland, NY. Hinton, G. E. (1990). Preface to the special issue on connectionist symbol processing. Artificial Intelligence, 46(1–2):1–4. Special issue on connectionist symbol processing. Hinton, G. E., McClelland, J. L., and Rumelhart, D. E. (1986). Distributed representations. In Rumelhart et al. (1986b), pages 77–109. Hopfield, J. J. (1982). Neural networks and physical systems with emergent collective computational properties. Proceedings of the National Academy of Sciences, 79:2554–2558.
215
BIBLIOGRAPHY Hornik, K., Stinchcombe, M., and White, H. (1989). Multilayer feedforward networks are universal approximators. Neural Networks, 2:359–66. Horty, J. F. (2001). Nonmonotonic logic. In Goble, L., editor, The Blackwell Guide to Philosophical Logic, chapter 15, pages 336–61. Blackwell Publishers. Hummel, J. E. and Biederman, I. (1992). Dynamic binding in a neural network for shape recognition. Psychological Review, 99(3):480–517. Indiveri, G. (2000). Modeling selective attention using a neuromorphic analog VLSI device. Neural Computation, 12(12):2857–80. Iserles, A. (1996). A first course in the numerical analysis of differential equations. Cambridge Univ. Press, Cambridge. Jensen, O. and Lisman, J. E. (1996). Novel lists of 7 ± 2 known items can be reliably stored in an oscillatory short-term memory network: Interaction with long-term memory. Learning and Memory, 3:257–263. Kaszkurewicz, E. and Bhaya, A. (1994). On a class of globally stable neural circuits. IEEE Transactions on Circuits and Systems—I: Fundamental Theory and Applications, 41(2):171–4. Knoblauch, A. and Palm, G. (2001). Pattern separation and synchronization in spiking associative memories and visual areas. Neural Networks, 14:763–780. Koch, C., Poggio, T., and Torre, V. (1983). Nonlinear interactions in a dendritic tree: Localization timing and role in information processing. Proc. Natl. Acad. Sci., 80:2799–802.
216
BIBLIOGRAPHY Koch, C., Rapp, M., and Segev, I. (1996). A brief history of time (constants). Cerebral Cortex, 6:93–103. Kohonen, T. (1972). Correlation matrix memories. IEEE Transactions on Computers, 21:353–359. König, P. and Engel, A. K. (1995). Correlated firing in sensory-motor systems. Current Opinion in Neurobiology, 5:511–519. Lamme, V. A. F. and Roelfsema, P. R. (2000). The distinct modes of vision offered by feedforward and recurrent processing. Trends in Neuroscience, 23:571–79. Elsevier, Netherlands. Lamport, L. (1994). LATEX: A document preparation system. Addison-Wesley, Reading, Massachusetts, second edition. Lashley, K. (1950). In search of the engram. In Symposia of the Society for Experimental Biology, number 4 in Physiological Mechanisms in Animal Behavior, pages 454–483. Academic, New York. Levy, W. B. (1996). A sequence predicting CA3 is a flexible associator that learns and uses context to solve Hippocampal-like tasks. Hippocampus, 6:576–90. Lisman, J. E. and Idiart, M. A. P. (1995). Storage of 7 ± 2 short-term memories in oscillatory subcycles. Science, 267:1512–4. Littlestone, N. (1991). Redundant noisy attributes, attribute errors, and linear threshold learning using Winnow. In Proc. 4th Annu. Workshop on Comput. Learning Theory, pages 147–156, San Meteo, CA. Morgan Kaufmann.
217
BIBLIOGRAPHY Livingstone, M. and Hubel, D. (1988). Segregation of form, color, movement, and depth—anatomy, physiology, and perception. Science, 240(4853):740–749. Maass, W. (1995). Vapnik-Chervonenis dimension of neural nets. In Arbib, M. A., editor, The Handbook of Brain Theory and Neural Networks, pages 1000–3. MIT Press, Cambridge, MA. Maass, W. (1997). Networks of spiking neurons: The third generation of neural network models. Neural Networks, 10(9):1659–1673. Maass, W. (2000). On the computational power of winner-take-all. Neural Computation, 12(11):2519–36. Maass, W. and Natschläger, T. (2000). A model for fast analog computation based on unreliable synapses. Neural Computation, 12(7):1679–1704. Mainen, Z. F. and Sejnowski, T. J. (1995). Reliability of spike timing in neocortical neurons. Science, 268:1502–6. Mani, D. R. and Shastri, L. (1992). A connectionist solution to the multiple instantiation problem using temporal synchrony. In Proceedings of the Fourteenth Conference of the Cognitive Science Society, pages 974–9, Bloomington, Indiana. Mani, D. R. and Shastri, L. (1994). Massively parallel real-time reasoning with very large knowledge bases: An interim report. Technical Report TR-94-031, International Computer Science Institute (ICSI), Berkeley, CA. Marr, D. (1982). Vision. Freeman, San Francisco, CA.
218
BIBLIOGRAPHY McCarthy, J. (1980). Circumscription — a form of non-monotonic reasoning. Artificial Intelligence, 13:27–39. McCloskey, M. (1991). Networks and theories: The place of connectionism in cognitive science. Psychological Review, 2(6):387–95. McCulloch, W. S. and Pitts, W. H. (1943). A logical calculus of ideas immanent in nervous activity. Bulletin of Mathematical Biophysics, 5:115. Milner, P. (1974). A model for visual shape recognition. Psycol. Rev., 816:521–535. Minai, A. A. and Levy, W. B. (1993). The dynamics of sparse random networks. Biol. Cybern., 70:177–87. Minai, A. A. and Levy, W. B. (1994). Setting the activity level in sparse random networks. Neural Computation, 6:85–99. Minsky, M. and Papert, S. (1969). Perceptrons. MIT Press, Cambridge, MA. Newell, A. (1990). Unified theories of cognition. Harvard University Press, Cambridge, Massachusetts. Niemeyer, P. (2001). BeanShell User Manual. Niklasson, L. and Bodén, M. (1997). Representing structure and structured representations in connectionist networks. In Browne, A., editor, Neural Network Perspectives on Cognition and Adaptive Robotics, chapter 2. IOP Publishing. Nilsson, N. J. (1998). Artificial Intelligence: A new synthesis. Morgan Kaufmann, San Francisco, CA.
219
BIBLIOGRAPHY Nowak, L. G. and Bullier, J. (1997). The timing of information transfer in the visual system. In Rockland, K. S., Kaas, J. H., and Peters, A., editors, Cerebral Cortex, volume 12, pages 205–40. Kluwer, New York. O’Reilly, R. C., Busby, R. S., and Soto, R. (2003). Three forms of binding and their neural substrates: Alternatives to temporal synchrony. In Cleeremans (2003). Page, M. (2000). Connectionist modelling in psychology: A localist manifesto. Behavioral and Brain Sciences, 23(4):443–+. Palm, G., Sommer, F. T., et al. (1997). Neural associative memories. In Krikelis, A. and Weems, C. C., editors, Associative Processing and Processors, pages 307–326. IEEE CS Press, Los Alamitos, CA. Phillips, C. L. and Harbor, R. D. (1991). Feedback Control Systems. Prentice Hall, New Jersey, 2nd edition. Ritz, R. and Sejnowski, T. J. (1997). Synchronous oscillatory activity in sensory systems: New vistas on mechanisms. Current Opinion in Neurobiology, 7:536–546. Rosenblatt, F. (1958). The perceptron, a probabilistic model of information storage and organization in the brain. Psychological Review, 62:386. Rosenblatt, F. (1961). Principles of neurodynamics: Perceptrons and the theory of brain mechanisms. Spartan Books, Washington, D.C. Rowland, B. (2002). The direct-indirect problem of phase-segregation networks: Intuitions from the olfactory cortex. Unpublished manuscript.
220
BIBLIOGRAPHY Rumelhart, D. E., Hinton, G. E., and Williams, R. J. (1986a). Learning representations by back-propagating errors. Nature, 323:533–536. Rumelhart, D. E., McClelland, J. L., and the PDP Research Group, editors (1986b). Parallel distributed processing: Explorations in the microstructure of cognition, volume 1: Foundations. MIT Press, Cambridge, MA. Russell, S. J. and Norvig, P. (1995). Artificial Intelligence: A Modern Approach. Prentice-Hall Inc., New Jersey. Schillen, T. B. and König, P. (1994). Binding by temporal structure in multiple feature domains of an oscillatory neuronal network. Biological Cybernetics, 70:397–405. Seidenberg, M. S. and McClelland, J. L. (1989). A distributed, developmental model of word recognition and naming. Psychological Review, 96:523–68. Sejnowski, T. J. and Rosenberg, C. R. (1987). Parallel networks that learn to pronounce English text. Complex Systems, 1:145–68. Senn, W., Schneider, M., and Ruf, B. (2002). Activity-dependent development of axonal and dendritic delays, or, why synaptic transmission should be unreliable. Neural Computation, 14:583–619. Shastri, L. (1988). Semantic networks: An evidential formalization and its connectionist realization. Research Notes in Artificial Intelligence. Morgan Kaufmann Publishers, Inc., San Meteo, California. Shastri, L. (1993). A computational model of tractable reasoning—Taking inspiration from cognition. In Proceedings of IJCAI-93, the Thirteenth International Joint Conference on Artificial Intelligence, pages 202–207, France. 221
BIBLIOGRAPHY Shastri, L. (1999a). Advances in SHRUTI — A neurally motivated model of relational knowledge representation and rapid inference using temporal synchrony. Applied Intelligence, 11:79–108. Shastri, L. (1999b). Recruitment of binding and binding-error detector circuits via long-term potentiation. Neurocomputing, 26–7:865–874. Shastri, L. (2000). Types and quantifiers in SHRUTI: A connectionist model of rapid reasoning and relational processing. In Wermter and Sun (2000a), pages 28–45. Shastri, L. (2001). Biological grounding of recruitment learning and vicinal algorithms in long-term potentiation. In Wermter, S., Austin, J., and Willshaw, D. J., editors, Emergent Neural Computational Architectures Based on Neuroscience, volume 2036 of Lecture Notes in Computer Science, pages 348–367. Springer. Shastri, L. and Ajjanagadde, V. (1993). From simple associations to systematic reasoning: A connectionist representation of rules, variables, and dynamic bindings using temporal synchrony. Behavioral and Brain Sciences, 16(3):417–451. Shiffrin, R. M. and Schneider, W. (1977). Controlled and automatic human information processing: II. Perceptual learning, automatic attending, and a general theory. Psychological Review, 84:127–190. American Psychological Association, Washington, DC. Singer, W. (1995). Time as coding space in neocortical processing: A hypothesis. In Gazzaniga (1995), chapter 6, pages 91–104. Singer, W. and Gray, C. M. (1995). Visual feature integration and the temporal correlation hypothesis. Annual Review of Neuroscience, 18:555–586.
222
BIBLIOGRAPHY Sougné, J. (1998a). Connectionism and the problem of multiple instantiation. Trends in Cognitive Sciences, 2:183–9. Sougné, J. (1998b). Period doubling as a means of representing multiply instantiated entities. In Proceedings of the Twentieth Annual Conference of the Cognitive Science Society, pages 1007–12. Mahwah,NJ: Lawrence Erbaum Ass. Sougné, J. and French, R. M. (1997). A neurobiologically inspired model of working memory based on neuronal synchrony and rythmicity. In Bullinaria, J. A., Glasspool, D. W., and Houghton, G., editors, Proceedings of the Fourth Neural Computation and Psychology Workshop: Connectionist Representations, pages 155–67. London: Springer-Verlag. Terman, D. and Wang, D. (1995). Global competition and local cooperation in a network of neural oscillators. Physica D, 81:148–76. Thorpe, S. T. and Imbert, M. (1989). Biological constraints on connectionist modelling. In Pfeifer, R., Schreter, Z., Fogelman-Soulié, F., and Steels, L., editors, Connectionism in perspective, pages 63–92. Elsevier, Nort-Holland. Traub, R. D., Jefferys, J. G. R., and Whittington, M. A. (1999). Fast oscillations in cortical circuits. MIT Press, Cambridge, MA. Treisman, A. (2003). Consciousness, attention and binding. In Cleeremans (2003). Given as plenary talk at the 4th annual meeting of the Association for the Scientific Study of Consciousness. Treisman, A. M. (1996). The binding problem. Current Opinion in Neurobiology, 6:171–178. Elsevier, Netherlands.
223
BIBLIOGRAPHY Treisman, A. M. and Gelade, G. (1980). A feature integration theory of attention. Cogn. Psychol., 12:97–106. Tymoshchuk, P. and Kaszkurewicz, E. (2003). A winner-take-all circuit based on second order Hopfield neural networks as building blocks. In Hasselmo and Wunsch (2003), pages 891–896. Urahama, K. and Nagao, T. (1995). K-winners-take-all circuit with O(N) complexity. IEEE Transactions on Neural Networks, 6(3):776–8. Valiant, L. G. (1984). A theory of the learnable. Communications of the ACM, 27(11):1134–1142. Valiant, L. G. (1988). Functionality in neural nets. In Proceedings of the 7th National Conference on Artificial Intelligence, pages 629–634, San Meteo, CA. AAAI, Morgan Kaufmann. Valiant, L. G. (1994). Circuits of The Mind. Oxford University Press. Valiant, L. G. (1995). Rationality. In Proc. 8th Annual Conference on Computational Learning Theory, pages 3–14. ACM Press, New York. Valiant, L. G. (1998). A neuroidal architecture for cognitive computation. In Larsen, K. G., Skyum, S., and Winskel, G., editors, ICALP, volume 1443 of Lecture Notes in Computer Science, pages 642–669. Springer. Valiant, L. G. (2000a). A neuroidal architecture for cognitive computation. Journal of ACM, 47(5):854–882. Valiant, L. G. (2000b). Robust logics. Artificial Intelligence, 117:231–253. 224
BIBLIOGRAPHY Vapnik, V. N. and Vezirani, A. Y. (1971). On the uniform convergence of relative frequencies of events to their probabilities. Theory of Probability and its Applications, 16:264–280. von der Malsburg, C. (1994). The correlation theory of brain function. In Domany et al. (1994), chapter 2, pages 95–120. Originally appeared as a Technical Report at the Max-Planck Institute for Biophysical Chemistry, Gottingen, 1981. von der Malsburg, C. (1995). Binding in models of perception and brain function. Current Opinion in Neurobiology, 5:520–526. Elsevier, Netherlands. von der Malsburg, C. and Schneider, W. (1986). A neural cocktail-party processor. Biological Cybernetics, 54(1):29–40. Weisstein, N. (1973). Beyond the yellow volkswagen detector and the grandmother cell: A general strategy for the exploration of operations in human pattern recognition. In Solso, R., editor, Contemporary Issues in Cognitive Psychology: The Loyola Symposium. W. H. Winston & Sons, Washington, D.C. Werbos, P. (1974). Beyond regression: New tools for prediction and analysis in the behavioral sciences. PhD thesis, Harvard University. Wermter, S. and Sun, R., editors (2000a). Hybrid Neural Systems, revised papers from a workshop held December 4-5, 1998, Denver, USA, volume 1778 of Lecture Notes in Computer Science. Springer. Wermter, S. and Sun, R. (2000b). An overview of hybrid neural systems. In Wermter and Sun (2000a), pages 1–13. Wickelgren, W. A. (1979). Chunking and consolidation: A theoretical synthesis of semantic
225
BIBLIOGRAPHY networks. Configuring in conditioning, S-R versus cognitive learning, normal forgetting, the amnestic syndrome, and the hippocampal arousal system. Psychological Review, 86:44–60. Widrow, B. and Hoff, M. E. (1960). Adaptive switching circuits. In 1960 IRE WESCON Convention Record, pages 96–104. IRE Part 4, New York.
226
Abstract The temporal correlation hypothesis proposes that synchronous activity in different regions of the brain describes integral entities (von der Malsburg, 1981; Singer and Gray, 1995). This temporal binding approach is a possible solution to the longstanding binding problem of representing composite objects (Rosenblatt, 1961). To complement the dynamic nature of temporal binding, a recruitment learning method has been proposed for providing long-term storage (Feldman, 1982; Valiant, 1994). We improve the recruitment method to use a more biologically realistic and computationally powerful spiking neuron model. However, using continuous-time spiking neurons and brain-like connectivity assumptions poses new problems in hierarchical recruitment. First, we propose timing parameter constraints for recruitment over asymmetrically connected delay lines. We verify these constraints using simulations. These constraints are useful for both building abstract networks and providing insight into bio-mechanisms that ensure signal integrity in the brain. As a second problem, we calculate the required feedforward excitatory and lateral inhibitory connection densities for stable propagation of activity in hierarchical structures of the network. We give analytic solutions using a stochastic population model of a simplified layered network. Our approach is independent of the network size, but depends on lateral inhibition and noisy feedforward delays.
227
Biographical Sketch Cengiz Günay was born in the city of ˙Istanbul, Turkey in 1976. He is the son of Jenny and Tarhan Günay. He obtained a Bachelor of Engineering degree in Electronics and Telecommunications from the ˙Istanbul Technical University (˙ITU) in 1998. During this time, he also served as the president of the Student Computer Club of ˙ITU for a year. He obtained a Master of Science degree in Computer Science from the University of Louisiana at Lafayette in 2000. He completed his Doctor of Philosophy degree in Computer Science from the same institution in 2003. Between 2002–2003, he also served as secretary and president to the local IEEE Computer Society Student Chapter.
228
Günay, Cengiz. Bachelor of Engineering, ˙Istanbul Technical University, Spring 1998; Master of Science, University of Louisiana at Lafayette, Summer 2000; Doctor of Philosophy, University of Louisiana at Lafayette, Fall 2003 Major: Computer Science Title of Dissertation: Hierarchical Learning of Conjunctive Concepts in Spiking Neural Networks Dissertation Director: Dr. Anthony S. Maida Pages in Dissertation: 228; Words in Abstract: 118 ABSTRACT The temporal correlation hypothesis proposes that synchronous activity in different regions of the brain describes integral entities (von der Malsburg, 1981; Singer and Gray, 1995). This temporal binding approach is a possible solution to the longstanding binding problem of representing composite objects (Rosenblatt, 1961). To complement the dynamic nature of temporal binding, a recruitment learning method has been proposed for providing long-term storage (Feldman, 1982; Valiant, 1994). We improve the recruitment method to use a more biologically realistic and computationally powerful spiking neuron model. However, using continuous-time spiking neurons and brain-like connectivity assumptions poses new problems in hierarchical recruitment. First, we propose timing parameter constraints for recruitment over asymmetrically connected delay lines. We verify these constraints using simulations. These constraints are useful for both building abstract networks and providing insight into bio-mechanisms that ensure signal integrity in the brain. As a second problem, we calculate the required feedforward excitatory and lateral inhibitory connection densities for stable propagation of activity in hierarchical structures of the network. We give analytic solutions using a stochastic population model of a simplified layered network. Our approach is independent of the network size, but depends on lateral inhibition and noisy feedforward delays.