na, nonzer, niter and nprocs (number of MPI tasks); the MA symbolic models for floating-point, load- store, physical memory and communication volume ...
Hierarchical Model Validation of Symbolic Performance Models of Scientific Kernels Sadaf R Alam and Jeffrey S Vetter Oak Ridge National Laboratory Oak Ridge, TN 37831, U.S.A {alamsr,vetter}@ornl.gov
Abstract. Multi-resolution validation of hierarchical performance models of scientific applications is critical primarily for two reasons. First, the step-by-step validation determines the correctness of all essential components or phases in a science simulation. Second, a model that is validated at multiple resolution levels is the very first step to generate predictive performance models, for not only existing systems but also for emerging systems and future problem sizes. We present the design and validation of hierarchical performance models of two scientific benchmarks using a new technique called the modeling assertions (MA). Our MA prototype framework generates symbolic performance models that can be evaluated efficiently by generating the equivalent model representations in Octave and MATLAB. The multi-resolution modeling and validation is conducted on two contemporary, massively-parallel systems, XT3 and Blue Gene/L system. The workload distribution and the growth rates predictions generated by the MA models are confirmed by the experimental data collected on the MPP platforms. In addition, the physical memory requirements that are generated by the MA models are verified by the runtime values on the Blue Gene/L system, which has 512 MBytes and 256 MBytes physical memory capacity in its two unique execution modes.
1
Introduction
Performance models of scientific applications have been generated using analytical techniques and measurement-based techniques. Analytical techniques like the one presented by Almasi et. al. [2] provide detailed information about the application structure and underlying algorithms but do not capture the computation and workload characteristics in detail that is essential to carry out performance prediction studies on a given target architecture. The measurement-based techniques [7, 9], for instance, techniques based on collecting detailed memory tracing data on target systems provide detailed system-specific performance characteristics of an application [7]. However, these approaches do not capture the algorithmic and problem resolution metrics of scientific applications in the performance models. Thus, the applicability is limited if an underlying algorithm or the target architecture characteristics are modified. For instance, the prediction error rates can change dramatically if the memory hierarchy of a target system varies from the architecture on which the measurements are taken. A successful performance modeling and prediction effort is presented by Kerbyson et. al. [5] for a large-scale scientific application and its kernels; however, this scheme requires an expert understanding of the application and underlying algorithms as well as detailed information about the features of the target parallel platform. We have proposed a portable and extensible approach for developing performance models of scientific applications called modeling assertions (MA) [1]. Our approach encapsulates an application’s key input parameters as well as the workload parameters including the computation and the communication characteristics of the modeled applications. The MA scheme requires an application developer to describe the workload requirements of a given block of code using the MA API in form of code annotations. These code annotations are independent of the target platforms. Moreover, the MA scheme allows multiresolution modeling of scientific applications. In other words, a user can decide which functions are critical to a given application, and can annotate and subsequently develop detailed performance models of the key functions. Depending on the runtime accuracy of the model, a user can develop hierarchical, multiresolution performance models of selected functions, for instance, models of critical loop blocks within a time-consuming function. MA models can capture the control structure of an application. Thus, not only an
aggregated workload metric is generated but also the distribution of a given workload over an entire execution cycle can be modeled using the MA framework. In this paper, we present the step-by-step validation of the MA performance models for two scientific kernels, the NAS parallel, message passing (MPI) CG and SP benchmarks [3]. The runtime measurement has been conducted on two distributed memory, teraflop/s scale systems, Cray XT3 [8] and IBM Blue Gene/L [6]. The XT3 systems is based on a 2.4 GHz Opteron processor connected with a high-speed Hypertransport link. A single processor is capable of delivering 4.8 gigaFLOP/s and provides up to ~6200 Mbytes/s memory bandwidth. The Blue Gene/L system has a unique memory hierarchy because of the two modes of execution namely co-processor mode and the virtual-node mode [6]. The Blue Gene/L system has a small physical memory per processor, 512 Mbytes and in the virtual-node execution mode, only half (256 Mbytes) is available to the user processes. The peak performance of a Blue Gene/L processing core is 1.4 gigaFLOPS/s and its main memory bandwidth is ~3200 Mbytes/s, which is shared between two processors in the virtual-node mode. We developed workload models for the two NAS MPI benchmarks, one each for the floating-point computation, memory operations, memory capacity and sizes and patterns of MPI operations [1]. The model predictions are validated with the runtime data by altering the key input parameter values and by running a fix size application in strong-scaling mode. The MA models capture the workload distribution that is represented as a function of key input parameters. These workload requirements are validated with the runtime performance data measured on two parallel systems. In addition to workload requirements, the MA models of the two NAS benchmarks can generate the growth rates for the workload distribution as a function of input parameters. The growth rates and sensitivity studies are also validated with the runtime data. The outline of the paper is as follows: section 2 presents the design of the MA models using the MA framework. A brief description of NAS CG and SP models of computation and communication is presented in section 3. The step-by-step process of model validation at multiple-resolutions is provided in section 4. Section 4 also presents the validation results for the MA models that show the workload growth rate as a function of input parameters. Section 5 gives a summary of the MA approach and future research directions.
2
The MA Framework ma_subroutine_start/end ma_loop_start/end ma_flop_start/stop ma_heap/stack_memory ma_mpi_xxxx ma_set/unset_tracing
MA API in C (for Fortran & C applications With MPI) Runtime system generate trace files Model validation
Classes of API calls currently implemented and tested Control flow
Symbolic model Post-processing toolset
Source code annotation
main () { loop (NAME = conj_loop) (COUNT = niter) { loop (NAME = norm_loop) (COUNT = l2npcols) { mpi_irecv (NAME = nrecv) (SIZE = dp*2); send = niter*(l2npcols*(dp*2)+l2npcols*(dp)+ cgitmax*(l2npcols*(dp*na/num_proc_cols)+dp*na/ num_proc_cols+l2npcols*(dp)+l2npcols*(dp))+l2n pcols*(dp*na/num_proc_cols)+dp*na/num_proc_col s+l2npcols*(dp))
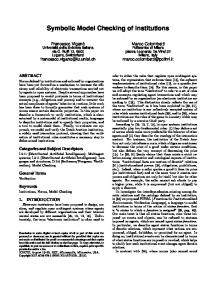
Fig. 1. Design components of the Modeling Assertion (MA) framework: The MA API, which is written in C and the extensible, post-processing toolset classes in Java. The MA API is available for C and FORTRAN code.
In order to evaluate our approach of developing symbolic models with MA, we have designed a prototype framework [1]. This framework has two main components: an API and a post-processing toolset. Figure 1 shows the components of the MA framework. The MA API is used to annotate the source code. As the application executes, the runtime system captures important information in trace files. These trace
files are then post-processed to validate, analyze, and construct models. The post-processing toolset is a collection of tools or Java classes. The post-processor currently has three main classes: model validation, control-flow model creation and symbolic model generation classes. The symbolic model shown in the Figure 1 is generated for the MPI send volume. This symbolic model can be evaluated and is compatible with MATLAB [10] and Octave [11]. The MA API provides a set of functions to annotate a given FORTRAN or C code with MPI messagepassing communication library. For example, ma_loop_start, a MA API function, can be used to mark the start of a loop. Upon execution, the code instrumented with MA API functions generates trace files. For parallel applications, one trace file is generated for each MPI task. The trace files contain traces for ma_xxx calls and MPI communication events. Most MA calls require a pair of ma_xxx_start and a ma_xxx_end calls. The ma_xxx_end traces are primarily used to validate the modeling assertions against the runtime values. The assertions for hardware counter values, ma_flop_start/stop, invoke the PAPI hardware counter API [4]. The ma_mpi_xxx assertions on the other hand are validated by implementing MPI wrapper functions (PMPI) and by comparing ma_mpi_xxx traces to PMPI_xxx traces. Additional functions are provided in the MA API to control the tracing volume, for example, the size of the trace files, by enabling and disabling the tracing at compile time and also at runtime. At runtime, the MA runtime system (MARS) tracks and captures the actual instantiated values as they execute in the application. MARS creates an internal control flow representation of the calls to the MA library as they are executed. It also captures both the symbolic values and the actual values of the expressions. Multiple calls to the same routines with similar parameters maps onto the same call graph, therefore, the data volume is manageable. The validation of an MA performance model is a two-stage process. When a model is initially being created, validation plays an important role in guiding the resolution of the model at various phases in the application. Later, the same model and validation technique can be used to validate against historical data and across the parameter space.
3
Evaluation of Symbolic Models
NAS CG computes an approximation to the smallest eigenvalue of a large, sparse, symmetric positive definite matrix, which is characteristic of unstructured grid computations. The main subroutine is conj_grad, which is being a called niter time. The first step was to identify the key input parameters, na, nonzer, niter and nprocs (number of MPI tasks); the MA symbolic models for floating-point, loadstore, physical memory and communication volume requirements are generated in terms of these four input parameters. The NAS parallel benchmarks provide different problem sizes or classes where class S is the smallest problem size. The MA model for SP is represented in terms of one input parameter, problem_size. In addition, the number of MPI tasks determines some derived parameters like the log2 of MPI tasks in CG and the square-root of number of processors in the SP benchmark to simplify model representations. Both CG and SP benchmarks follow a Single Program Multiple Data (SPMD) programming paradigm. Hence, the workload and memory mapping and distribution per processor not only depend on the key input parameters but also on the number of MPI tasks. Upon termination of a runtime experiment, MA outputs a control flow model representation, an intermediate file and symbolic models for number of floating-point, load-store and communication operations. The control flow model representation is similar to the actual code annotations; that is, it is a high level, visual flow of the annotated parts of the application. The intermediate representation serves as an input to develop symbolic models for user-defined characteristics or relative quantities like memory byte-to-flop ratio. For instance, a user can create models for load/store-to-flop ratios using the intermediate representation. The symbolic models generated by the MA framework are compatible with Matlab and Octave script format. Figure 2 shows symbolic model representation for SP communication operations. Only three input parameters are required to evaluate this model, no_nodes (number of MPI tasks), niter (number of time step iterations) and problem_size (application input parameter). Our target is to be able to generate symbolic models that represent the architecture independent requirements of an application and that can be evaluated efficiently by existing mathematical software frameworks.
ncells = sqrt (no_nodes) elems = problem_size / ncells dp = sizeof (double) niter * (elems ˆ 2 * (ncells - 1) * 10 * dp + elems ˆ 2 * (ncells - 1) * 10 * dp + . . . + ncells * (22 * (elems - 1) ˆ 2 * dp) + ncells * (10 * (elems - 1) ˆ 2 * dp) + . . .
Fig. 2. A MATLAB/Octave compatible symbolic model generated by the MA framework
One of the aims of creating the models of scientific applications is to be able to predict the application requirements for the future problem configurations. We used our MA models to understand the sensitivity of floating-point operations, memory requirements per processor, and message volume to applications’ input parameters. We begin experiments with a validated problem instance, Class C, for both the NAS CG and SP benchmarks, and scale the input parameters linearly. Note that the MA framework has a postprocessing toolset that allows validation of MA model annotations with the runtime values. For instance, the PAPI_FP_OPS (number of floating-point operations) data was compared with the ma_flop runtime value. The validated problem instances, Class C, have na=150000, nonzer=15, for CG Class C benchmark with 128 MPI tasks. We increase the value of na linearly and generate the floating-point and load-store operation count using the MA symbolic models of the NAS CG benchmark. Figure 3 shows that the floating-point and load-store cost in the CG experiments increase linearly with the na parameter value. 3.E+07
FP Operations 3.E+07
LS Operations
2.E+07 2.E+07 1.E+07 5.E+06 0.E+00 2E+05 3E+05 5E+05 6E+05 8E+05 9E+05 1E+06 1E+06 1E+06 2E+06
na
Fig. 3. Sensitivity of the number of Floating-point (FP) and load-store (LS) operations per processor in a 128 processor experiment by increasing the array size parameter: na.
Similarly, we generated the growth rates for the floating-point and load-store operation cost for the other input parameter, nonzer. Results in Figure 4 show that the floating-point and load-store operation cost in CG is relatively more sensitive to the increase in the number of nonzer elements in the array than the array size: na. 2.E+08 2.E+08
FP Operations
1.E+08
LS Operations
1.E+08 1.E+08 8.E+07 6.E+07 4.E+07 2.E+07 0.E+00 15
30
45
60
75 90 nonzer
105
120
135
150
Fig. 4. Sensitivity of FP and LS by increasing the number of non-zero elements parameter: nonzer.
The NAS SP benchmark has a single application parameter, problem_size, which we have used to represent the workload requirements (floating-point, load-store, memory and communication) in the MA symbolic models. Figure 5 shows the increase in the floating-point and load-store operation count by increasing the problem_size linearly. Note that like CG, the initial set of experiments (Class S, W, A, B, C and D) are validated on the target MPP platforms. Figure 5 shows that the floating-point operation cost increases at a very high rate by increasing the problem_size. 2.E+10
FP Operations Average memory Messages Sent (bytes)
1.E+10 1.E+10 1.E+10 8.E+09 6.E+09 4.E+09 2.E+09 0.E+00 162
324
486
648
810
972
1134
1296
1458
1620
problem_size
Fig. 5. Sensitivity of workload requirements with respect to the SP input parameter: problem_size.
Using the MA models, we can not only generate the aggregated workload requirements shown earlier, but also get an insight into the scaling behavior of the workload requirements within an application as a function of the problem_size parameter. Figure 6 shows contribution of different functions in total floating-point operation count in SP time step iterations. The results shown in Figure 6 are generated for a fix number of MPI tasks and by increasing the problem_size parameter linearly. The floating-point workload requirements generated by the MA model show that the z_solve is the most expensive function for runs with large number of processors. The cost of x_solve and y_solve are identical and consistent. Moreover, based on the MA model results shown in Figure 6, we can safely ignore cost of txinvr and add functions in the further analysis. 100%
copy_faces y_solve
90%
txinvr z_solve
x_solve add
80% 70% 60% 50% 40% 30% 20% 10% 0% 162
324
486
648
810
972
1134
1296
1458
1620
problem_size
Fig. 6. Impact of individual functions on the overall increase in the number of floating-point operations by increasing the input parameter problem_size on 1024 processors.
4
Multi-resolution Validation of MA Models
The model verification output enables us to identify the most floating-point intensive loop block of the code in the CG benchmark. This loop block is shown in Figure 7, which is called twice during a conjugate gradient calculation in the CG benchmark. The symbolic floating point operation cost of the loop is approximately 2*na/(num_proc_cols*nonzer*ceiling(nonzer/nprows)).
do j=1,lastrow-firstrow+1 sum = 0.d0 do k=rowstr(j),rowstr(j+1)-1 sum = sum + a(k)*p(colidx(k)) enddo w(j) = sum enddo Fig. 7. The partition submatrix-vector multiply
% of total floating-point operations
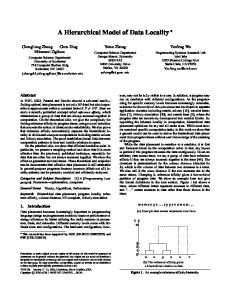
Using the MA models, we generated the scaling of the floating-point operation cost of the loop block in Figure 7 with the other loop blocks within a conjugate gradient iteration. The model predictions are shown in Figure 8. The total cost of two invocations of the submatrix vector multiply operation contributes to a large fraction of the total floating-point operation cost. l1 is the first loop block in the CG timestep iteration and l2 is the second. Figure 8 shows that the workload is not evenly distributed among the different loop blocks (or phases of calculations), and the submatrix vector multiply loop can be serious bottleneck. Furthermore, as we scale the problem to a large number of processors, we begin to identify loop that are either the Amdahl’s proportions of the serial code or their loop count is directly propotional to the number of MPI tasks in the system. We found that the loop count of loop number 3 and 8 depend on the number of MPI tasks (log2(log2(MPI_Tasks)), while loop 1 and 8 scale at a slower rate than loop 2 and 7 (submatrix vector multiply loop), since the cost of loop 2 and 7 is divided twice by the scaling parameters as compared to 1 and 8, which is divided once by the scaling parameter. Another interesting feature is the scaling pattern, which is not linear because of the mapping and distribution of workload depends on ceiling(log2(MPI_tasks)). 100% l11
90%
l10
80%
l9
70%
l8
60%
l7
50%
l6
40%
l5 l4
30%
l3
20%
l2
10%
l1
0% 4
8
16
32
64
128
256
512
Number of Processors
Fig. 8. Distribution of floating-point operation cost within a time step iteration in the NAS CG benchmark. Default na and nonzer parameter values for the Class C problem instance are used for the experiments. l1 is the first loop block and l2 is the second loop block in the conjugate gradient iterations. l2 and l7 perform calculations shown in Figure 7.
We collected the runtime data for the loops blocks in CG time step iterations on XT3 and Blue Gene/L processors to validate our workload distribution and scaling patterns. Figure 9 shows the percentage of runtime spent in individual loop blocks. Comparing it with the workload distribution in Figure 8, we observe not only a similar workload distribution but also a similar scaling pattern. Note that the message passing communication times are not included in these runtime measurements. We collected data for the Class D CG benchmark on the XT3 system, which also validate the floating-point message count distribution and scaling characteristics that are generated by the symbolic MA models.
% of total runtime
100%
l11
90%
l10
80%
l9
70%
l8 l7
60%
l6
50%
l5
40%
l4
30%
l3
20%
l2 l1
10%
1
0% 4
8
16 32 64 128 Number of processors
256
512
Fig. 9. Percentage of total runtime spent in individual loop blocks in a CG iteration. These runtime are measured in the co-processor mode. Default na and nonzer parameter values for the Class C problem instance are used for the experiments.
On Blue Gene/L we collected data in the two execution modes to investigate the effect of reduced memory bandwidth. The memory bandwidth in the virtual node mode is shared by two Blue Gene/L processors, while in the co-processor mode, a single compute processor accesses the main memory during the computation. In the co-processor mode, the other processor, the communication processors, is typically associated with MPI communication data movement. We did not observe a significant increase in runtime in the virtual-node mode experiments on the Blue Gene/L system as shown in Figure 10. Although the runtime increases for the most time-consuming loops, we conclude that the memory traffic is not a major issue in the most time-consuming block of the code. We expect the memory bandwidth to be an issue when workload sizes per processor are increased significantly.
5.00% l1
4.00% Runtime (Virtual node/coprocessor mode)
l2 l3
3.00%
l4 l5
2.00% 1.00%
l9
l11
l7
0.00%
l5 l3 128
512
Number of processors
l1 256
32
64
-1.00%
Loop blocks
l6 l7 l8 l9 l10 l11
Fig. 10. Percentage increase in the runtime values in the virtual-node mode experiments.
Figure 3 and 4 demonstrated that the CG workload is more sensitive to the nonzer parameter. In order to validate our MA performance model predictions, we ran the experiments by doubling the nonzer parameter. On Blue Gene/L, we ran the experiments both in the virtual node mode and in the co-processor mode. First, we validate the MA model for the physical memory requirements. Our model predicts that the sizes of all large arrays depend on the nonzer value, therefore, the overall memory requirement will double. The runtime measurements confirm that a minimum of 8 Blue Gene/L processors in co-processor mode and 16 processors in the virtual node mode are needed to run the Class C benchmark with nonzer=30. Second, the MA models of floating-point operation and load-store operation count predicted that only the cost of the submatrix vector multiply loop depend on the nonzer parameter value. According
to the MA model predictions, by doubling the value of nonzer (Class C problem instance), the floatingpoint and the load-store operation cost increases by ~300%. The runtime data in Figure 11 confirm the cost distribution and scaling by doubling the nonzer parameter as predicted by the MA model. We also validated our MA model for up to five times increase in the nonzer value with the runtime data.
300% l1 250%
l2
200%
l3 l4
% increase in 150% runtime 100%
l5 l6 l7
l11
50%
l9
l8
l7
0%
l9
l5
l10
l3 Loop blocks
l11
512
l1 256
64
128
16
32
-50%
Number of processors
Fig. 11. Percentage increase in runtime of individual loop blocks by doubling the nonzer parameter.
% of floating-point operations in z_solve
In addition to the hierarchical validation of the CG model, we validated the sensitivity of the problem_size parameter for the NAS SP model. We identified that the floating-point operation cost increases by increasing the problem_size parameter and that the z_solve calculations are the most expensive calculations in the SP application simulation in terms of the floating-point operation cost. Figure 12 shows the breakdown of floating-point cost distribution within the key calculation phases as generated by the MA model. l16
100%
l15 l14 80%
l13 l12 l11
60%
l10 l9 l8
40%
l7 l6 20%
l5 l4 l3
0% 16
36
64
100
Number of processors
196
256
l2 l1
Fig. 12. Distribution of the floating-point operation cost in different code blocks in the z_solve method of the NAS SP benchmark. These distributions are generated by the MA models.
We conducted fine-grain measurements on the z_solve operation and collected runtime data on the XT3 and Blue Gene/L processors. Figure 13 shows the runtime data collected on the Blue Gene/L processor for different phases of calculation in the z_solve operation. The distribution of the runtime cost in the z_solve function confirm the workload distribution and scaling pattern that was generated by the MA model for the NAS SP benchmark (Figure 12).
l16
100%
l15
% of total z_solve runtime
l14 80%
l13 l12 l11
60%
l10 l9 40%
l8 l7 l6
20%
l5 l4 l3
0% 16
36
64
100
196
256
l2 l1
Number of processors
Fig. 13. The distribution of the runtime cost measured on the Blue Gene/L processor for the Class C problem instance of the NAS Parallel benchmark.
In Figure 5, we showed that the floating-point and load-store operation cost increase at an exponential rate by increasing the problem_size parameter in the SP benchmark. In order to confirm the growth rate prediction generated by the MA models, we ran experiments by doubling the problem_size parameter value for NAS SP Class C experiments on the Blue Gene/L system. Results in Figure 14 confirm that the runtime cost for a large number of loop blocks increases rapidly (up to 10 times) by doubling the problem_size parameter.
l1 l2
1200%
l3 l4
1000%
l5 l6
800% % increase in runtime
l7
600%
l8
l16 l13 l10
400% l7
200% l4 l1 256
Number of processors
100
36
0%
Loop blocks
l9 l10 l11 l12 l13 l14 l15 l16
Fig. 14. Percentage increase in runtime by doubling the problem_size parameter in NAS SP Class C experiments on the Blue Gene/L system.
5
Conclusions and Future Work
We present the multi-resolution validation of symbolic performance models of parallel scientific kernels using a technique called Modeling Assertions (MA). We have shown that our modeling scheme provides an insight into the workload distribution and scaling characteristic of scientific codes by comparing model predictions with the runtime data collected on contemporary massively-parallel systems. Furthermore, we validate the growth rates predictions generated by the MA models of two scientific benchmarks by increasing key input parameters of the scientific simulations. Development of hierarchical MA symbolic models is a first step toward developing precise prediction model on target architectures and future problem
configurations. We are extending the MA API and the framework that will enable code and algorithm developers to augment MA annotations with performance attributes, for instance, the memory access patterns and data-level parallelism for a given loop block. We also plan to introduce a set of modeling attributes that can represent the unique performance enhancing features of emerging architectures.
Acknowledgements This research was sponsored by the Office of Mathematical, Information, and Computational Sciences, Office of Science, U.S. Department of Energy under Contract No. DE-AC05-00OR22725 with UT-Batelle, LLC. Accordingly, the U.S. Government retains a non-exclusive, royalty-free license to publish or reproduce the published form of this contribution, or allow others to do so, for U.S. Government purposes.
Reference: 1.
2.
3.
4.
5.
6.
7. 8.
S. Alam, and J. Vetter, A Framework to Develop Symbolic Performance Models of Parallel Applications, 5th International Workshop on Performance Modeling, Evaluation, and Optimization of Parallel and Distributed Systems (PMEO-PDS 2006). Held in conjunction with IPDPS 2006. George S. Almasi, Calin Cascaval, José G. Castaños, Monty Denneau, Wilm E. Donath, Maria Eleftheriou, Mark Giampapa, C. T. Howard Ho, Derek Lieber, José E. Moreira, Dennis M. Newns, Marc Snir and Henry S. Warren Jr, Demonstrating the scalability of a molecular dynamics application on a Petaflop computer, Proceedings of Int'l Conf. Supercomputing, 2001. D. Bailey, E. Barszcz et al., The NAS Parallel Benchmarks (94), NASA Ames Research Center, RNR Technical Report RNR-94-007, 1994, http://www.nas.nasa.gov/Pubs/TechReports/RNRreports/dbailey/RNR94-007/RNR-94-007.html. S. Browne, J Dongarra, N Garner, G. Ho, P Mucci, A Portable Programming Interface for Performance Evaluation on Modern Processors, The International Journal of High Performance Computing Applications, Volume 14, number 3, Fall 2000. Darren J. Kerbyson, Henry J. Alme, Adolfy Hoisie, Fabrizio Petrini, Harvey J. Wasserman, M. Gittings: Predictive performance and scalability modeling of a large-scale application. Proceedings of Int'l Conf. Supercomputing, 2001. M. Ohmacht, R. A. Bergamaschi, S. Bhattacharya, A. Gara, M. E. Giampapa, B. Gopalsamy, R. A. Haring, D. Hoenicke, D. J. Krolak, J. A. Marcella, B. J. Nathanson, V. Salapura, M. E. Wazlowski, Blue Gene/L compute chip: Memory and Ethernet subsystem, IBM Journal of Research and Development, Vol. 49, No. 2/3, 2005. A. Snavely, L. Carrington, N. Wolter, J. Labarta, R. Badia A. Purkayastha., A Framework for Performance Modeling and Prediction, Proceedings of Int'l Conf. Supercomputing (electronic publication), 2002. J. Vetter, S. Alam, T. Dunigan, M. Fahey, P. Roth and P. Worley, Early Evaluation of the Cray XT3, 20th IEEE International Parallel & Distributed Processing Symposium (IPDPS), 2006.
T. Yang, X. Ma and F. Mueller, “Predicting Parallel Applications’ Performance Across Platforms using Partial Execution,” ACM/IEEE Supercomputing Conference, 2005. 10. MATLAB, http://www.mathworks.com/products/matlab/. 11. Octave, http://www.gnu.org/software/octave/. 9.