Hierarchical Structures in the Aggregation of Premium Risk for Insurance Underwriting
Nino Savelli
Gian Paolo Clemente
Catholic University of Milan
[email protected]
Catholic University of Milan
[email protected]
Thanks
In memory of Teivo Pentikainen, a person in love of actuarial sciences who teached me a lot about risk theory during my PhD period in Finland. I will be for ever in debt with him and the Finnish colleagues.
Savelli&Clemente: “Hierarchical Structures in the Aggregation of Premium Risk for Insurance Underwriting”
2
The aim of this paper – to analyse the risk profile of a multi-line non-life insurer in term of capital requirement for Premium Risk, also by a sensitivity of Internal Model RBC results for different insurers according to volume and claim variability – to understand the impact of different aggregation formulas on capital requirements – to discuss on various dependency structures among different lines of business and their impact on RBC requirement Savelli&Clemente: “Hierarchical Structures in the Aggregation of Premium Risk for Insurance Underwriting”
3
PART I INTRODUCTION
Savelli&Clemente: “Hierarchical Structures in the Aggregation of Premium Risk for Insurance Underwriting”
4
Collective Risk Theory Model • A Collective Risk Theory Model is here applied with the aim to quantify the capital required for premium risk for a multi-line nonlife insurer (with TH=1 year). • Following the collective approach, for each line of business the aggregate claims amount is given by a compound Poisson process, where: - number of claims distribution is the Poisson law, with a parameter n0 increasing year by year by the real growth rate g and with a structure variable q distribuited as a Gamma (h;h):
n~t = n0 ⋅ (1 + g ) t ⋅ q~ - the claim size amounts Zit are here assumed i.i.d. with a LogNormal distribution and to be scaled by the inflation rate i Savelli&Clemente: “Hierarchical Structures in the Aggregation of Premium Risk for Insurance Underwriting”
5
Premiums Volume • The Total Initial Gross Premium Volume, for each LoB, is equal to:
B0 = P0 (1 + λ ) + c ⋅ B0 = (n0 ⋅ m0 )(1 + λ ) + c ⋅ B0 Where for the initial year 0: Ø n0 is the expected number of claims Ø m0 is the expected claim cost Ø c is the expenses loading coefficient (as % of Gross Premiums B) Ø λ is the safety loading coefficient (as % of Risk Premiums P)
• For each line of business both the nominal gross premium volume Bt,lob and the risk premium Pt,lob increase yearly by the claim inflation rate (i) and the real growth rate (g):
Bt = Bt −1 (1 + i )(1 + g ) = [Pt −1 ⋅ (1 + i )(1 + g )]⋅ (1 + λ ) + c ⋅ Bt Savelli&Clemente: “Hierarchical Structures in the Aggregation of Premium Risk for Insurance Underwriting”
6
Internal Model Case Studies §
Four different Non-Life Insurance Companies are regarded OMEGA, TAU, TAUHIGH, EPSILON
§
All of them have different dimension and/or claim size coefficient of variability (cz)
§
All insurers underwrite business in the same 5 Lines of Business (LoBs) with the same weight on the gross written premiums volume: – – – – –
§
LoB 1: LoB 2: LoB 3: LoB 4: LoB 5:
Accident Motor Damages Property MTPL GTPL
(10% Gross Premiums Volume) (10% “ “ “ ) (15% “ “ “ ) (55% “ “ “ ) (10% “ “ “ )
The Total Initial Gross Premiums Volume of the four insurers: – Comp. OMEGA – Comp. TAU and TAUHIGH – Comp. EPSILON
1000 mill (Euro) 500 mill (Euro) – differ for the claim size CV only 100 mill (Euro)
Savelli&Clemente: “Hierarchical Structures in the Aggregation of Premium Risk for Insurance Underwriting”
7
EPSILON
TAUHIGH
TAU
Accident MODam Property MTPL GTPL
OMEGA
Parameters for premiums and claims LoBs LoB1 LoB2 LoB3 LoB4 LoB5 LoB1 LoB2 LoB3 LoB4 LoB5 LoB1 LoB2 LoB3 LoB4 LoB5 LoB1 LoB2 LoB3 LoB4 LoB5
n0 17.374 18.515 16.580 111.316 7.721 8.687 9.258 8.290 55.658 3.861 8.687 9.258 8.290 55.658 3.861 1.737 1.852 1.658 11.132 773
n0 = expected number of claims (t=0) m0 = expected claim size (t=0) λ = safety loading coefficient
σ(q) 14,0% 28,9% 11,2% 8,7% 13,9% 14,0% 28,9% 11,2% 8,7% 13,9% 14,0% 28,9% 11,2% 8,7% 13,9% 14,0% 28,9% 11,2% 8,7% 13,9%
g 1,9% 1,9% 1,9% 1,9% 1,9% 1,9% 1,9% 1,9% 1,9% 1,9% 1,9% 1,9% 1,9% 1,9% 1,9% 1,9% 1,9% 1,9% 1,9% 1,9%
m0 3.200 2.500 6.000 4.000 10.000 3.200 2.500 6.000 4.000 10.000 3.200 2.500 6.000 4.000 10.000 3.200 2.500 6.000 4.000 10.000
cz 3 2 8 4 12 3 2 8 4 12 4,5 3 12 6 18 3 2 8 4 12
i 3% 3% 3% 3% 3% 3% 3% 3% 3% 3% 3% 3% 3% 3% 3% 3% 3% 3% 3% 3%
λ 22,40% 64,25% 6,28% 1,88% -7,03% 22,40% 64,25% 6,28% 1,88% -7,03% 22,40% 64,25% 6,28% 1,88% -7,03% 22,40% 64,25% 6,28% 1,88% -7,03%
c 31,95% Accident 23,98% MODam 29,51% Property 17,52% MTPL 28,22% GTPL 31,95% 23,98% 29,51% 17,52% 28,22% 31,95% 23,98% 29,51% 17,52% 28,22% 31,95% 23,98% 29,51% 17,52% 28,22%
σ(q) = std structure variable g = real growth rate cz = claim size CV (σ(Z)/E(Z)) i = claim inflation rate c = expenses loading coefficient
Savelli&Clemente: “Hierarchical Structures in the Aggregation of Premium Risk for Insurance Underwriting”
8
The Capital Requirement (Independence Assumption) Ø The Required Capital for the 4 Insurers with the mentioned 5 LoBs is obtained (at the moment) under LoB independence assumption. In case of independence among the claim amount of all the lines, the total aggregate amount of claims will be clearly the sum of single LoB claim amount Xi with an aggregate RBC amount (SCRAgg,IM) obtained for TH=1 by: L
Agg , IM α
SCR
= VaRα − ∑ Pi (1 + λi ) i =1
being clearly minor than the sum of single RBC requirements. Ø The RBC ratios (given by the RBC amount divided by initial Gross Premiums) are related to three examined confidence levels (α): • 99.00% (corresponding to a S&P rating BB approx.) • 99.50% (adopted in QIS3/QIS4, and roughly equivalent to a S&P rating BBB-) • 99.97% (corresponding to a S&P rating AA). and regarding 99.50% level as our benchmark: The RBC is obtained for the Premium Risk only and without any consideration of Reinsurance (at the moment). Savelli&Clemente: “Hierarchical Structures in the Aggregation of Premium Risk for Insurance Underwriting”
9
Some results by Companies and by LoBs (independence assumption)
Savelli&Clemente: “Hierarchical Structures in the Aggregation of Premium Risk for Insurance Underwriting”
10
The Capital Requirement (Aggregation) § The Non-Life Underwriting Risk is a very good example to apply aggregation techniques, because single LoBs capital requirements have to be usually aggregated on a unique U/W capital requirement (genuine bottom-up approach). § Once the single Risk-Based Capital (RBC) is obtained (by factor-based or other approaches, e.g. simulation models) various aggregation techniques may be carried on. § Those aggregation techniques could be based on the use of simulation models (e.g. by copulas) or some aggregation formulas should be provided. Savelli&Clemente: “Hierarchical Structures in the Aggregation of Premium Risk for Insurance Underwriting”
11
The Capital Requirement (Different Aggregation Techniques) § In the next different approaches will be presented and applied to aggregate single LoBs capital charge (assuming in all cases QIS3 correlation coefficients) –a linear correlation approach based on QIS formula –an estension of QIS formula based on Normal Power Approximation and proposed by A. Sandstrom (SAJ 2007) –an estension of QIS formula based on the empirical multipliers obtained by single LoB simulation –simulation of multivariate distribution by elliptical copulas –simulation of multivariate distribution by hierarchical archimedean copulas Savelli&Clemente: “Hierarchical Structures in the Aggregation of Premium Risk for Insurance Underwriting”
12
PART II OVERALL CAPITAL REQUIREMENTS UNDER DIFFERENT AGGREGATION FORMULAS
Savelli&Clemente: “Hierarchical Structures in the Aggregation of Premium Risk for Insurance Underwriting”
13
The Capital Requirement (a linear correlation approach based on QIS formula) The Capital Requirement (SCRDEP,QIS), under linear correlation assumption, is derived rescaling the RBC obtained from Internal Model in case of independence (SCRAgg,IM). This scaling appears necessary because SCRIND gives an approximate estimation of diversification effect between different LoB compared to aggregated IM:
SCR DEP,QIS = SCR Agg , IM
( SCR − SCR ) ( SCR + (SCR − SCR ) IND
Full Corr
Agg , Full
IND
− SCR Agg , IM
)
Using only aggreg. IM by indep.assump. w/o Matrix corr.
- SCR is estimated joining the single capital charge CCi (equal to VaRi-Pi obtained by IM) with a correlation matrix
SCR =
these value are not equal 0-5% of Premiums approx.
L
L
∑∑ Corr
i, j
i =1 j =1
L
⋅ CCi ⋅ CC j − ∑ λi Pi
L: number of LoBs
i =1
-SCRIND and SCRFull Corr are derived in either independence and full correlation assumptions and are respectively given by: IND
SCR
=
∑[CC ] − ∑λ P L
i =1
2
i
L
i =1
i i
L
FullCorr
SCR
[
]
L
L
i=1
i=1
= ∑ CCi − ∑λi Pi = ∑SCRi = SCRAgg, Full i=1
Savelli&Clemente: “Hierarchical Structures in the Aggregation of Premium Risk for Insurance Underwriting”
14
The Capital Requirement (a Normal Power Approximation formula) § The QIS Aggregation Formula assumes that the underlying distributions are Gaussians and it does not provide a correct calibration for skewness. § Sandstrom shows that one way to tackle the problem with skewed distributions is the use of a Cornish-Fisher expansion with the aim to transform the quantile (and the tail expectations) of a skewed distribution in a standard normal distribution. § The correct quantile, obtained by a VaR risk measure, is: L
L
C
2 SCR
= ∑ f C + 2∑∑ ρ ij f V ,i Ci f V , j C j i =1
2 V ,i
2 i
i =1 j ≠ i
CC iα = VaR iα − Pi = k iα σ i
f V ,i
6 zα + γ SCR ( zα2 − 1) = 6 zα + γ i ( zα2 − 1)
In this approach (SCRDEP,SAND) the capital requirement is derived by the next formula: SCR
DEP , SAND
= C
L
2 SCR
− ∑ λi Pi i =1
Savelli&Clemente: “Hierarchical Structures in the Aggregation of Premium Risk for Insurance Underwriting”
15
The Capital Requirement (a formula based on Empirical Multiplier) We propose also another way to adjust the QIS Aggregation Formula using the multiplier coming as a result for each LoB by using the simulation model. We define: ki and kIND the empirical multipliers, respectively for the LoB i and for the aggregate portfolio, obtained by IM under independence assumption: [RBCiα + λPi ] [VaRiα − Pi ] = k = σi σi α i
α k IND
L α λ RBC P + ∑ IND i i =1 = L
∑ (σ ) i =1
2
i
The portfolio Capital Charge under linear correlation hypothesis but including a calibration for skewness is equal to: L
L
2 = ∑ g V2 ,i C i2 + 2∑∑ ρ ij g V ,i C i g V , j C j C SCR i =1
g V ,i
i =1 j ≠ i
α k IND = α ki
Also in this approach (SCRDEP,MULT) the capital requirement will be obtained by the L formula: DEP, MULT 2 = C SCR − ∑ λi Pi SCR i =1
Savelli&Clemente: “Hierarchical Structures in the Aggregation of Premium Risk for Insurance Underwriting”
16
Some Results (Independence)
EPSILON
TAUHIGH
TAU
OMEGA
The Capital Requirement (under independence assumption) obtained by the aggregate claims distribution produced by the Internal Model (IMIND) is compared to the three previous formulas based on the aggregation of the single-LoB capital charge.
IMIND IMIND,QIS IMIND,SAND IMIND,MULT IMIND IMIND,QIS IMIND,SAND IMIND,MULT IMIND IMIND,QIS IMIND,SAND IMIND,MULT IMIND IMIND,QIS IMIND,SAND IMIND,MULT
RBC Ratio (Gross Reinsurance) 99% 99.5% 99.97% 6.51% 7.96% 14.21% 6.87% 8.54% 17.84% 6.57% 8.09% 13.98% 6.50% 7.95% 14.19% 7.06% 8.68% 18.82% 7.57% 9.59% 23.24% 7.70% 9.54% 17.10% 7.06% 8.69% 18.83% 8.32% 10.53% 34.79% 9.04% 11.97% 38.72% 12.25% 15.35% 29.32% 8.30% 10.52% 34.75% 11.21% 14.76% 51.97% 12.34% 16.83% 56.51% 25.00% 31.68% 64.22% 11.21% 14.77% 51.99%
As already mentioned, QIS3 Aggregation Formula (IMIND,QIS) presents higher RBC ratios than Internal Model. The formula based on the calibration factor, proposed by Sandstrom shows a very good approximation for the big and the medium Company, both characterized by a low positive skewness (roughly 0.3/0.5), but it produces a Capital Requirement overestimated for very skewed distributions (roughly 2 for Tau High and 5.2 for Epsilon) A formula based on the empirical multiplier leads, as was obvious in independence case, to a RBC ratio almost coinciding with Internal Model results.
Savelli&Clemente: “Hierarchical Structures in the Aggregation of Premium Risk for Insurance Underwriting”
17
Some Results (Dependence)
EPSILON
TAUHIGH
TAU
OMEGA
The simulation results (IMDEP,GAUSS), obtained by a multivariate distribution with a Gaussian copula, are compared with closed formulas based on the aggregation of single-Lob capital charge obtained by Internal Model under independence assumption.
IMDEP,GAUSS IMDEP,QIS IMDEP,SAND IMDEP,MULT IMDEP,GAUSS IMDEP,QIS IMDEP,SAND IMDEP,MULT IMDEP,GAUSS IMDEP,QIS IMDEP,SAND IMDEP,MULT IMDEP,GAUSS IMDEP,QIS IMDEP,SAND IMDEP,MULT
RBC Ratio (Gross Reinsurance) 99% 99.5% 99.97% 11.37% 13.54% 24.50% 11.63% 13.96% 25.87% 10.30% 12.30% 20.73% 11.10% 13.11% 21.76% 12.38% 14.93% 30.20% 12.75% 15.53% 32.32% 11.73% 14.17% 25.08% 12.09% 14.37% 28.60% 14.39% 17.89% 45.22% 14.89% 18.69% 50.86% 17.37% 21.49% 41.71% 14.05% 17.19% 51.59% 18.64% 23.76% 65.55% 19.23% 24.73% 70.96% 34.00% 42.89% 88.62% 18.26% 23.33% 76.34%
The QIS aggregation formula (IMDEP,QIS), properly scaled, gives results not so far from the Gaussian copula. RBC ratios obtained with the calibration factor (IMDEP,SAND) are, like in the independence case, very high for same companies with very skewed distributions. While the calibration, based on the empirical multiplier leads to RBC ratio similar to the Gaussian Copula. The differences should probably be brought to the effect of dependency on portfolio skewness. Indeed, this effect is neglected by the use of empirical multiplier derived by the independence results.
Savelli&Clemente: “Hierarchical Structures in the Aggregation of Premium Risk for Insurance Underwriting”
18
PART III THE IMPACT OF DIFFERENT HIERARCHICAL STRUCTURES FOR COPULAS
Savelli&Clemente: “Hierarchical Structures in the Aggregation of Premium Risk for Insurance Underwriting”
19
The Capital Requirement (Copulas) § Recently, copulas have emerged as a powerful tool to create more flexible and more realistic multivariate distributions. Due to the increase in popularity of copulas to measure dependent risks, generating multivariate copulas became a very crucial exercise. § Generating multivariate Archimedean copulas could be a very difficult task as the number of dimension increases § In fact, in n-dimension Archimedean Copulas have the known disadvantage to represent the dependence structure only with few parameters (an only one in many cases). § To describe the complexity of the observed dependence, it could be necessary to use Hierarchical Copulas, causing many practical problems to identify the kind and the sort of the hierarchical structure. § In the next the Capital Requirement has been obtained using both elliptical copulas and various Hierarchical Archimedean copulas. Savelli&Clemente: “Hierarchical Structures in the Aggregation of Premium Risk for Insurance Underwriting”
20
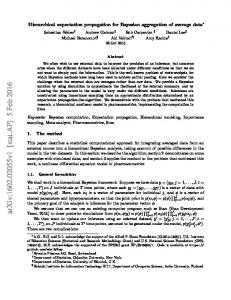
The Capital Requirement (Hierarchical Copulas) We will use various hierarchical structures with the aim to obtain the overall Capital Requirement under different assumptions. Each structure combines the lines in the same order: marginals are sorted in decreasing way according to the 99.5% percentile value. So MTPL and Property will be joined at the first level and then GTPL, Motor Damages and Accident will be added in this order through various aggregation trees. The three different structures, figured out in the next, are the following ones: - a fully nested copula (choosing the initial pair of marginals and then adding a marginal step by step) (In the next Structure A); - a partial nested copula where two couples of marginal are joined with two copulas and then combined together. At the top level, the fifth LoB is added (Structure B); - a partial nested copula where the first two levels are the same of a fully nested, while the last two lines are joined before together and then with the others (Structure C). Finally we use the same copula function for all the aggregations within a structure. Savelli&Clemente: “Hierarchical Structures in the Aggregation of Premium Risk for Insurance Underwriting”
21
Hierarchical Copulas (Three Different Structures)
22
Skewness of Multivariate Distribution (The impact of different Copulas) While all dependence structures lead to a higher variability coefficient of the overall distribution, the skewness has a various behaviour according to the copula chosen. Elliptical copulas show for the Big Company a portfolio distribution skewed as well as that observed under independence assumption. The other results confirm the tail dependency of the various functions: Clayton copula, in the standard version, produces a fat right tail and leads for Omega Company to a negative skewness, while Gumbel and M “ irror Clayton”show higher skewed distributions , more than three times that in the independence case. Skewness of Aggregate Claims Amount (EPSILON Company)
Skewness of Aggregate Claims Amount (OMEGA Company) 6.00
1.20 1.00
5.00
0.80 0.60 0.40 0.20
4.00 3.00 2.00
-0.20
1.00 MirrorClayton(A)
Gumbel (A)
T-Student(3)
T-Student(30)
Gaussian
T-Student(100)
Indipendence
Frank(A)
Clayton (A)
MirrorClayton(A)
Gumbel (A)
T-Student(3)
T-Student(30)
Gaussian
T-Student(100)
Indipendence
Frank(A)
Clayton (A)
Savelli&Clemente: “Hierarchical Structures in the Aggregation of Premium Risk for Insurance Underwriting”
23
The Capital Requirement (OMEGA Company) Linear Correlation RBC ratio, obtained by the scaled QIS aggregation formula, appears similar to the capital needed with an elliptical copula. The Fully Nested copulas (Structure A) lead to very different Capital Requirements with the lowest value obtained by a Clayton and the highest by the mirror Clayton (9.9% and 18.32% against the 7.96% under independence). It seems that the different structures have an impact on the capital requirement only when tail is very fat. The B Structure shows a lower tail dependency and lower Capital Requirements (roughly reduced of 3-4%) for copulas with fat upper tail. Finally it’ s worth to emphasize that elliptical copulas give the same requirement using the multivariate copulas or a hierarchical tree RBC Ratio 99.5% - OMEGA Company 20.0% 18.0% 16.0% 14.0% 12.0% 10.0% 8.0% 6.0% 4.0% 2.0% 0.0% Indipendence
Frank (C)
Frank (B)
Frank (A)
MirrorClayton (C)
MirrorClayton (B)
MirrorClayton (A)
Clayton (C)
Clayton (B)
Clayton (A)
Gumbel (C)
Gumbel (B)
Gumbel (A)
Gaussian(C)
Gaussian(B)
Gaussian(A)
Gaussian
t-Student (3)
t-Student (30)
t-Student (100)
Linear Correlation
24
The Capital Requirement (EPSILON Company)
Savelli&Clemente: “Hierarchical Structures in the Aggregation of Premium Risk for Insurance Underwriting”
25
RBC Ratio with different LoBs order •
Figures compare the fully nested copulas (Structure A) for both companies obtained sorting the LoBs in a different way. • The results, obtained by LoBs sorted in decreasing way, are compared with the same hierarchical tree applied to LoBs sorted in increasing order (Structure A1). • Starting the aggregation from less variable and less skewed LoBs, we obtain a Capital Requirement less sensitive to the copula tail dependency. So the 99.5% RBC ratio is lower (than Structure A) for copulas with fat left tail (as Gumbel and Mirror Clayton) and higher for Clayton and Frank. • Small Companies are more influenced by the structure choice. RBC Ratio 99.5% - OMEGA Company 35.0% 30.0% 25.0% 20.0% 15.0% 10.0% 5.0% Frank(A1)
Frank(A)
Mirror Clayton(A1) Mirror Clayton(A)
Clayton(A1)
Clayton(A)
Gumbel (A1)
Gumbel(A)
Frank(A1)
Frank(A)
Mirror Clayton(A1) Mirror Clayton(A)
Clayton(A1)
Clayton(A)
Gumbel (A1)
Gumbel(A)
Gaussian
0.0%
Gaussian
20.00% 18.00% 16.00% 14.00% 12.00% 10.00% 8.00% 6.00% 4.00% 2.00% 0.00%
RBC Ratio 99.5% - EPSILON Com pany
26
Reinsurance effect •
• •
•
The Capital Requirement, under dependence assumption, is obtained considering the next alternative reinsurance strategies too: – a Quota Share treaty for each LoB with retention quota a=85% and a fixed commission (applied to the ceded premium) equal to the 80% of expenses coefficient – an Excess of Loss treaty with a claim retention limit MLoB=E(ZLoB)+15*s(ZLoB) for each LoB (reinsurer’ s safety loading based on the CV increase of the ceded claims amount distribution) It’ s confirmed the greater reduction of Capital Requirement by the XL treaty for the small insurer. It’ s interesting to emphasize that QS (the more convenient treaty in the independence hypothesis for company Omega) shows a higher requirement than XL in the dependency cases, because of the well known ability of XL to reduce the skewness. For both Insurers the Requirement increase, caused by high upper tail dependency, appears reduced under a reinsurance cover. RBC Ratio 99.5% OM EGA Company
RBC Ratio 99.5% EPSILON Company
25.0%
25.0%
20.0%
20.0%
15.0%
15.0%
10.0%
10.0%
5.0%
Frank(A)
QS 85% (cre=80% c)
MirrorClayton(A)
Clayton(A)
XL
Gumbel (A)
No Reinsurance
Gaussian
0.0%
Independence
Frank(A)
QS 85% (cre=80% c)
MirrorClayton(A)
Clayton(A)
Gumbel (A)
XL
Gaussian
No Reinsurance
Independence
0.0%
5.0%
27
Final Comments q In this paper, a Collective Risk Theory Model is applied with the aim to quantify the Solvency Capital Requirement for the Premium Risk only and to compare different aggregation methods based on simulation and closed formulas. q The formula, proposed by Sandstrom and based on Normal Power Approximation, can be a good way to solve this problem and to consider the skewness of multivariate distribution but it may overestimate the requirement when single LoBs are very skewed. q An alternative way (useful only for Internal Model) to correct QIS formula with empirical multipliers gives similar results to elliptical copula. Being the multiplier a simulation result, the formula doesn’ t show always the same differences regarding copulas, especially for the highest confidence level (99.97%). ASTIN Colloquium 2008 –Savelli & Clemente: “Modelling Aggregate NL UWR Risk: SF vs IM”
28
q Finally Hierarchical Copulas show how the choice of copula function appears much delicate in the valuation of the overall Capital Requirement. q Copula tail dependencies lead to very different amount of needed capital. q The kind of hierarchical tree and the LoBs order have not, in this analysis, a big impact on the aggregated RBC ratio too.
ASTIN Colloquium 2008 –Savelli & Clemente: “Modelling Aggregate NL UWR Risk: SF vs IM”
29
Main References ü
CEIOPS (2007 2008): “Quantitative Impact Study 3 - Technical Specifications”e Q “ uantitative Impact Study 4 –Technical Specifications”, 2007 e 2008;
ü
Daykin C., Pentikäinen T., Pesonen M. (1994): “Practical risk theory for actuaries”, Chapman&Hall, Londra;
ü
Embrechts P., McNeil A., Lindskog P. (2001): M “ odelling dependence with copulas and Applications to Risk Management”, ETH Zurich;
ü
Sandstrom A. (2007), S “ olvency II: calibration for skewness” , Scandinavian Actuarial Journal, vol.2, 2007
ü
Savelli N., Clemente G. P. (2009) Modelling “ Aggregate Non-Life Underwriting Risk: Standard Formula vs Internal Model”, Special Issue GIIA 2009.
ü
Savu C., Trede M. (2006), H “ ierarchical Archimedean Copulas” , International Conference on High Frequency Finance, Kostanz
ü
SCOR (2008), F “ rom Principle-Based Risk Management to Solvency Requirements. Analytical Framework for the Swiss Solvency Test”, 2nd edition, Zurich;
ü
Wang S. (1998): A “ ggregation of correlated risk portfolios: models and algorithms” , Proceedings of the Casualty Actuarial Society, LXXXV, pp. 848-939,1998
ASTIN Colloquium 2008 –Savelli & Clemente: “Modelling Aggregate NL UWR Risk: SF vs IM”
30
Thank you for the attention
ASTIN 2008 –Savelli&Clemente: “Modelling Aggregate NL UWR Risk: SF vs IM”
31