Such choice is motivated by the good fit of the model to the data. 3. Nearest neighbors are weighted using a measure which takes into account the absolute ...
High-Dimensional Feature Matching: Employing the Concept of Meaningful Nearest Neighbors∗ Duˇsan Omerˇcevi´c, Ondrej Drbohlav, and Aleˇs Leonardis Faculty of Computer and Information Science University of Ljubljana, Slovenia {dusan.omercevic, ondrej.drbohlav, ales.leonardis}@fri.uni-lj.si
Abstract Matching of high-dimensional features using nearest neighbors search is an important part of image matching methods which are based on local invariant features. In this work we highlight effects pertinent to high-dimensional spaces that are significant for matching, yet have not been explicitly accounted for in previous work. In our approach, we require every nearest neighbor to be meaningful, that is, sufficiently close to a query feature such that it is an outlier to a background feature distribution. We estimate the background feature distribution from the extended neighborhood of a query feature given by its k nearest neighbors. Based on the concept of meaningful nearest neighbors, we develop a novel high-dimensional feature matching method and evaluate its performance by conducting image matching on two challenging image data sets. A superior performance in terms of accuracy is shown in comparison to several state-of-the-art approaches. Additionally, to make search for k nearest neighbors more efficient, we develop a novel approximate nearest neighbors search method based on sparse coding with an overcomplete basis set that provides a ten-fold speed-up over an exhaustive search even for high dimensional spaces and retains excellent approximation to an exact nearest neighbors search.
1. Introduction Image matching using local invariant features is used for solving many computer vision problems, including image retrieval [16, 14], object recognition [10, 6], wide baseline matching [1, 11, 19], building panoramas [5], image based localization [20] and video data mining [17]. In these applications, local invariant features are detected indepen∗
This research has been supported in part by: Research program Computer Vision P2-0214 (RS), EU FP6-004250-IP project CoSy, EU MRTNCT-2004-005439 project VISIONTRAIN, and EU FP6-511051 project MOBVIS.
978-1-4244-1631-8/07/$25.00 ©2007 IEEE
dently in each image and then the features of one image are matched against the features of other images by comparing respective feature descriptors. The matched features can subsequently be used to indicate presence of a particular object, to vote for a particular image, or as tentative correspondences for epipolar geometry estimation. Related work. The elementary methods for matching local invariant features such as threshold-based matching and nearest neighbor(s) matching, treat all features equally, while more sophisticated methods take into account that some of the local invariant features are more distinctive than others. Among the more sophisticated methods, Baumberg’s method [1] tries to compensate for variable distinctiveness of local invariant features by identifying the closest and second-closest neighbor of a query feature. The closest neighbor is selected as an unambiguous match only if it is much closer than the second-closest neighbor. A similar concept was used also by Lowe [10]. Another approach to matching is inspired by text retrieval methods and uses entropy weighting to explicitly account for variable distinctiveness of local invariant features. Sivic and Zisserman [17] used vector quantization to partition the set of feature descriptors into disjoint subsets which they termed visual words. They consider all features associated with a particular visual word as matches to each other. Recently, Nist´er and Stew´enius [14] designed a hierarchical vector quantization method with strong emphasis on speed of matching. The resulting visual vocabulary tree, containing up to several million leaves, enabled them to partition the set of feature descriptors into a much larger number of subsets than was the case with the method of Sivic and Zisserman. The individual feature descriptors were matched implicitly, by comparing paths of feature descriptors down the vocabulary tree. A hierarchical structure similar to the vocabulary tree was also used in a vocabulary-guided pyramid match method of Grauman and Darrell [7] for computing an approximate partial matching between two sets of feature vectors.
Problem statement. In this paper we are interested in methods for matching individual local invariant features. Such methods enable image matching that is robust to background clutter and occlusion. When matching individual features, we have a large number of features detected in reference images and much smaller, but still substantial, number of features detected in a query image. The goal of the feature matching is to relate each query feature with none, one, or several features detected in the reference images. Each match translates into a vote for a particular reference image. For the voting to be successful, a sufficient number of votes should go to the matching reference images, while only a smaller number of votes can go to unrelated reference images. Our first goal is to consider explicitly the effects pertinent to high-dimensional spaces that are significant for matching and to develop a novel high-dimensional feature matching method that would improve performance of image matching methods that are based on local invariant features. An important step of the feature matching method we develop is searching for nearest neighbors of a query feature. Using exhaustive search would be too slow for most of the image matching applications. As stated in [10, 4, 8], no algorithms are known that can identify exact nearest neighbors of points in high dimensional spaces that are any more efficient than exhaustive search. Also, none of the approximate methods [3, 13, 9] that we have considered seemed capable of providing sufficient speed-up while retaining adequate quality of the approximation. Therefore, our second goal is to develop an approximate nearest neighbors search method that would speed-up the presented feature matching method. Our contribution. The first contribution of this paper is a novel high-dimensional feature matching method based on the concept of meaningful nearest neighbors. Our approach improves performance of image matching methods which are based on local invariant features. A nearest neighbor is considered meaningful if it is sufficiently close to a query feature such that it is an outlier to a background feature distribution. The background feature distribution is estimated from the extended neighborhood of a query feature given by its k nearest neighbors. The second contribution of this paper is a novel approximate nearest neighbors search method that provides a ten-fold speed-up over an exhaustive search even for high dimensional spaces while retaining excellent approximation to an exact nearest neighbors search. Organization of the paper. Detailed explanation of the proposed feature matching method is presented in Sec. 2. The performance of the approach is evaluated in Sec. 3 by conducting image retrieval on two large image sets and the results of the image retrieval are compared to several other state-of-the-art approaches. The approximate nearest neigh-
bors search method is explained and evaluated in Sec. 4. Finally, Sec. 5 concludes the paper.
2. Our approach In this section we demonstrate the effects pertinent to high-dimensional spaces that have significant implications for feature matching. Subsequently we explain the concept of meaningful nearest neighbors, and present the method which we use to implement this concept.
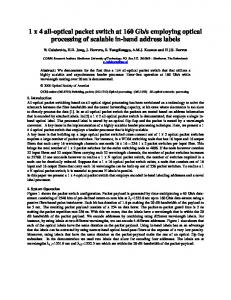
2.1. High-dimensional effects Simulated example. Let us consider a set F of features which are distributed uniformly on the intersection SD of the positive D-dimensional hyperquadrant and the surface of a unit D-dimensional sphere (thus for x ∈ SD , there holds that kxk = 1 and all the components of x are positive). Given an arbitrary feature point f ∈ F, we are interested in the distribution of values of dot products of f with the rest of the features (throughout this paper, to capture similarity of a pair of unit vectors x ∈ RD , y ∈ RD we use dot products x · y). This distribution p(r) is, for a given f ∈ F, written as dP (f · g ≤ r) , g ∈ F\f , (1) dr where P (·) denotes probability. Fig. 1 shows examples of these distributions for three different dimensionalities. We can see that for D = 3, the shapes of the distributions vary greatly for the five different reference points used. For dimensionality D = 15, the differences are far less pronounced. Importantly though, another effect enters: negligible distribution value in direct vicinity of a query feature, and a rapid growth of the distribution as the distance increases (i.e. dot product falls). For D = 128, the shape of the distributions for the five different reference points used is virtually the same, while the initial growth of the distribution is indeed even faster compared to the previous case. In the following paragraph we show that effects observed here for higher dimensionalities (D = 15 and D = 128) are maintained to a large extent even when the features are not distributed uniformly. p(r) =
SIFT features set. Here we consider an important case [12] of Scale Invariant Feature Transform (SIFT) descriptor features [10]. Space populated by a set of SIFT features extracted from real scenes differs from the above example in that it can safely be claimed that it is not uniform (it is a matter of fact that non-uniformity of the data is what makes nearest neighbor approaches work). The dimensionality of SIFT features is D = 128. In Fig. 2, distributions p(r) of dot products for five different, randomly chosen SIFTs are shown. The set of SIFT features was extracted from benchmark data set provided by Stew´enius and Nist´er [18]. The
15 dimensions
background distribution
128 dimensions
Relative probability
3 dimensions
1
0.75 0.5 0.25
0
1
1
0.75 0.5 0.25 0 Dot product value
0.75 0.5 0.25
0
Relative probability
extended neighborhood
true matches
Figure 1. Distributions of dot product values between a randomly selected point and all other points on a D-dimensional hypersphere (positive hyperquadrant only) for 3, 15, and 128 dimensional spaces. Each of the diagrams shows the distribution for five randomly selected points. Weighting
1
0.9
0.8
0.7
0.6 0.5 0.4 Dot product value
0.3
0.2
0.1
0.0
Figure 2. Distribution of dot product values between five randomly selected query features and all other (seven million) features extracted from recognition benchmark images [18].
previously discussed high-dimensional effects are clearly retained. In particular, the distributions start with very low values, and exhibit rapid growth as the dot product values fall. The distribution curves are smoothly shaped, and although some of the curves are bimodal, the shapes of distributions are at least qualitatively similar.
2.2. Finding meaningful nearest neighbors We regard the distribution of dot product values between a query feature and the rest of the features as being composed of the true matches distribution, and the background distribution of irrelevant match candidates (background distribution, for short; see Fig. 3). We call a nearest neighbor meaningful if it is an outlier to the background distribution. We do not make hard decisions on which nearest neighbors are outliers; instead we assign each neighbor a weight which takes into account how likely it is that the feature is an outlier. We proceed as follows: 1. For a given query feature, we take an extended neighborhood given by its k nearest neighbors. A working
0
q·v
measure of surprise
1
0
Relative probability 1.0
exponential fit
neighbor weight
q·v
Figure 3. Finding meaningful nearest neighbors. The top graph shows two components of the distribution of dot product values between a query feature q and a feature vector set {vi }. The distribution is composed of a background distribution of irrelevant match candidates, and true matches distribution (note that the true matches distribution is displayed hugely overscaled for sake of clarity). The feature vector set is first restricted to an extended neighborhood of q given by k nearest neighbors. Exponential fit is then applied in the extended neighborhood, with the goal of estimating a simple parametric model of the background distribution (thick red solid curve). Subsequently (see the bottom graph), each feature vector is assigned a measure of surprise (see Eq. 5) which quantifies the likeliness of a feature to be an outlier to the background distribution, and therefore, a true match. Each of the nearest neighbors is then assigned a final weight which is a combination of similarity to a query feature and the measure of surprise (see Eq. 6).
assumption is that the majority of these k neighbors are from the background distribution. 2. The growth of the background distribution within the extended neighborhood is modeled by an exponential distribution. Such choice is motivated by the good fit of the model to the data. 3. Nearest neighbors are weighted using a measure which takes into account the absolute similarity to the query and the likeliness of a neighbor being an outlier to the background distribution, and therefore a true match. In the following, we discuss the three steps in detail. Extended neighborhood. Extended neighborhood is given by k nearest neighbors of the query point. The only require-
ment on the cardinality of this set (i.e. value of k) comes from the consideration that it should enable estimation of the background distribution. Thus, it should be much larger than the expected number of true matches. In regards to that, k = 100 was used in our applications as we expected around 10 true matches per query. For a given query point q, we denote the nearest neighbors vi , i = 1, . . . , k. We assume that these are sorted in increasing distance from the query (i.e. descending order of dot product value). Exponential fit. The dot product values are transformed as si =
q · vi − q · vk , 1 − q · vk
i = 1, .., k ,
(2)
to normalize the range of similarities to [0, 1]. Subsequently, the distribution of si ’s is fitted by an exponential distribution p(s) = λe−λs . (3) The parameter λ is found in closed form, using the maximization of log-likelihood of occurrence of si ’s given λ, resulting in λ = (¯ s)−1 , (4) where s¯ is the mean of si ’s. Scoring the nearest neighbors. All nearest neighbors are assigned a weight ci which takes into account two determining factors: the similarity si (defined in Eq. 2) of a query feature to the neighbor, and the likeliness ti of the neighbor being a true match. We employ the following function for assigning the value of ti : ti = (1 − e−λsi )k ,
(5)
which expresses the likeliness of the value si being an outlier to the assumed exponential distribution and is directly related to measures of surprise [2]. The final weight ci is computed as ci = si ti . (6) When applied to image matching, meaningful nearest neighbors are independently weighted for each query feature. The sum of weights then defines the similarity of a reference image to the query image.
3. Performance evaluation We have evaluated the performance of the proposed high-dimensional feature matching method on two challenging image data sets, a data set of recognition benchmark images provided by Stew´enius and Nist´er [18] and the Ljubljana urban image data set1 collected by ourselves 1 Ljubljana
urban image data set and performance evaluation results are available online at http://vicos.fri.uni-lj.si/LUIS34/
for the purpose of image based localization. Image matching was performed using local invariant features detected by the Maximally Stable Extremal Region (MSER) detector [11] and described by a Scale Invariant Feature Transform (SIFT) descriptor [10]. Besides comparing the performance of our approach to the performance of vocabulary tree based matching of Nist´er and Stew´enius [14], we also compared it to 1-NN matching and augmented k-NN matching. In the 1-NN matching only the nearest neighbor of a query feature was used to vote for the respective image. The similarity of a reference image to a query image was measured by the number of votes the reference image received. The augmented k-NN matching searches for k nearest neighbors of a given query feature but uses only the nearest neighbors that are within radius r from the query feature (k and r were specifically optimized for each of the image data sets to give the best matching results). Each of these neighbors votes for a respective reference image. The number of votes collected for each reference image is divided by the square root of the number of features detected in that reference image, to account for considerable variation of number of features detected in different reference images. Such score is then used for ranking the reference images. In experiments presented in this section we have extensively used the novel approximate nearest neighbors search method, presented in Sec. 4, that is ten-times faster than the exhaustive search even in high-dimensional spaces. In order to show the quality of approximation to an exact nearest neighbors search and to validate results of the experiments, we have repeated all the experiments of this section also by using the exact nearest neighbor search on a partial subset of images. Recognition benchmark images. The image data set of Stew´enius and Nist´er [18] contains 10200 images in groups of four that belong together, see [14] for examples. Each image is in turn matched against all other images and scoring is performed by counting how many of the four images in a block (including the query image) are found among the four best matching images. In our evaluation we used SIFT descriptor vectors provided by [18]. The result of our approach compared to other methods is presented in Fig. 4. For the augmented k-NN matching it was experimentally established that taking 30 nearest neighbors and radius r of 32◦ gives best matching results. Our method performed much better than the vocabulary tree based matching and the 1-NN matching, while it performed approximately the same as the augmented k-NN matching that was specifically optimized for this particular image data set. Ljubljana urban image data set. The second image data set consists of 612 reference images of an urban environment covering an area of 200 × 200 square meters. At
4
method our approach augmented k-NN 1-NN
Score
3.5
#groundtruth reference images 5 4 3 2 1 none 24 33 41 44 45 3 20 30 32 38 43 5 15 28 29 37 41 7
3
2.5
2 0
our approach augmented k−NN matching 1−NN matching vocabulary tree based matching 2000
4000 6000 Number of images
8000
10000
Figure 4. Performance of the proposed high-dimensional feature matching method compared to the vocabulary tree based matching [14], 1-NN matching, and augmented k-NN matching. The performance was evaluated using a data set of recognition benchmark images [18]. For the evaluation we used the novel approximate nearest neighbors search method. We validated results by repeating the experiment using the exact nearest neighbor search on the first 1000 images. We show in Fig. 7 that the difference in results is negligible. 5
4
Score
3
2 our approach augmented k−NN matching 1−NN matching exact nearest neighbor search
1
0 5
10
15 20 25 Number of reference images retrieved
30
Figure 5. Performance of the proposed high-dimensional feature matching method compared to 1-NN matching, and augmented kNN matching on the Ljubljana urban image data set. The curves show how many of the groundtruth reference images were retrieved among n top-ranked reference images (the score is upper bounded to 5). The dark, thick lines indicate the results of respective methods using the exact instead of the approximate nearest neighbor search. The processing of all 48 query images took 2 hours using the approximate nearest neighbors search and 19 hours using the exhaustive search.
Table 1. Cumulative number of query images for which (at least) the specified number of groundtruth reference images were retrieved among five top-ranked reference images. The right-most column shows the number of cases when not a single groundtruth reference image was correctly retrieved. There are 48 query images altogether.
ence images. The evaluation was performed by retrieving n most similar reference images and counting how many of the groundtruth reference images were among them. The score was upper bounded to 5 because of a weak boundary between reference images selected and those not selected as the groundtruth reference images but still having at least part of the scene in common with the query image. The superior performance of our approach over the other methods is presented in Fig. 5. For the augmented k-NN matching it was experimentally established that taking three nearest neighbors and radius r of 26◦ gives best matching results. In Table 1 we show the cumulative number of query images for which (at least) the specified number of groundtruth reference images were retrieved among five top-ranked reference images. We show that our approach retrieves at least two groundtruth reference images for 44 out of 48 query images (92%), while the other methods are successful for only 38 (79%) and 37 (77%) query images respectively. This case is important for image based localization because with two matching reference images retrieved from two different standpoints and assuming common ground plane it is possible to triangulate the user position [20]. The other important case for image based localization is the number of cases when not a single matching reference image can be correctly retrieved as this prohibits even approximate localization. While augmented k-NN matching could not find any matching reference image for five out of 48 query images (10%) and 1-NN matching was unsuccessful for seven query images (15%), our approach failed for only three query images (6%). As an example of performance of our approach to matching, we show in Fig. 6 the most similar reference images retrieved for three sample query images.
4. Approximate Nearest Neighbors Search each of the 34 standpoints, 18 reference images were captured in overcast weather. Nine months later, 48 query images were captured in sunny weather. For each query image we have manually selected between 10 and 15 best matching reference images that share the most of the scene with the query image, and we took these as groundtruth refer-
The high-dimensional feature matching method presented in Sec. 2 uses nearest neighbors search to identify the extended neighborhood of a given query feature. To make search for nearest neighbors more efficient, we present in this section an approximate nearest neighbors search method inspired by the work of Olshausen and Field [15].
Figure 6. Three sample query images (the first column) of the Ljubljana urban image data set and the top five images retrieved by our approach (second to sixth columns). The first row demonstrates perfect performance; the building present in the the query image is also in all top-ranked images. The second row shows similar performance; note however that the second to last image is unsuitable for imagebased localization as it depicts the other side of the building with identical facade. The third row is an example of retrieval which seems correct as far as image similarity is concerned, but since the retrieved images do not depict the same scene, this is considered a failure for image-based localization applications.
By employing sparse coding with an overcomplete basis set, similarity of vectors can be measured not only by similarity of projections to basis vectors but also through a similar subset of bases selected for vector representation. Our approximate nearest neighbors search method compares two vectors in the coordinate system defined by the bases that the two vectors have in common. If the two vectors are sufficiently similar in this custom-tailored coordinate system, they are compared also in the original coordinate system, following a filter-and-refine approach to nearest neighbors search. Because sparse coding enables efficient implementation and because the method is able to discard most of the non-nearest neighbors in the filtering step, the proposed approximate nearest neighbors search method provides a substantial speed-up over an exhaustive search even for high dimensional spaces while retaining a good approximation to an exact nearest neighbors search. Filtering step. The proposed approximate nearest neighbors search method operates on normalized D-dimensional vectors and it uses dot product between respective vectors as a measure of vector similarity. In the filtering step, we assume to have an overcomplete basis set {bm , m = 1 . . . M }. The i-th basis vector bi is selected to represent vector v if bi · v > cos(ρ), (7) i.e., if the basis is sufficiently similar to the vector v as specified by the activation angle ρ. Having a query vector q and a reference vector v, their similarity hs is computed as follows. We stack bases se-
lected to represent vectors v and q into matrices Bv and Bq respectively, and the bases that the two vectors have in common into a matrix Bq∩v (all basis vectors are column vectors and are stacked in the transposed form). Then the similarity hs is defined as � � � � Bq∩v q − 1 cos(ρ) Bq∩v v − 1 cos(ρ) hs = · (8) kBq q − 1 cos(ρ)k kBv v − 1 cos(ρ)k where 1 is a vector of ones. The vector v is filtered out if it is not among l nearest neighbors of the query vector q according to the similarity hs . Alternatively, the vector v can be filtered out if the similarity hs is below some fixed threshold value. An efficient implementation of the presented approximate nearest neighbor search method pre-computes for each basis bi a list of pairs �� � � bi · vj − cos(ρ) Pi = , j : bi · vj > cos(ρ) kBvj vj − 1 cos(ρ)k (9) and uses the pre-computed lists in efficient calculation of Eq. (8) at query time by selecting only lists belonging to bases selected to represent query vector q. Learning of an overcomplete basis set follows the principles set in [15]. The learning starts with an initial set of randomly generated bases and then proceeds as follows. We draw a random vector v from the input set. All bases that are sufficiently similar to the vector v as specified by the activation angle ρ are attracted to the vector v. If two
Refining step. In the refining step l nearest neighbors are selected according to the similarity hs (see Eq. 8) for exhaustive search. The value of l was set to l = 20000 for [18] (seven million features altogether) and to l = 10000 for Ljubljana urban image data set (3.8 million features altogether). Retrieval rate. The retrieval rate of the proposed approximate nearest neighbors search method was estimated using 760062 SIFT descriptor vectors detected in the first 1000 recognition benchmark images of [18]. The retrieval rate was computed by comparing the nearest neighbors retrieved by an exact search method to the nearest neighbors retrieved by the approximate search method. The results presented in Fig. 8 show that the true nearest neighbor is retrieved in the 94.2% of cases and that the retrieval rate is slightly less for second to fifth nearest neighbor. The retrieval rate for the first hundred nearest neighbors is 85.8%. Quality of approximation. With approximate nearest neighbors search methods it is hard to tell whether the missed nearest neighbors are important or not. An approximate nearest neighbors search method can have a very low retrieval rate and still be highly useful if it retrieves all the true matches, while if it misses many true matches the high retrieval rate is to no avail. Therefore, we have compared the meaningful nearest neighbors returned by the high-dimensional feature matching method presented in this paper, once using approximate and the other time using exact nearest neighbors search. The meaningful nearest neighbors were weighted as presented in Sec. 2 and the extended query feature neighborhood was identified by searching for k = 100 nearest neighbors. The results of this comparison are given in Fig. 8. The results show that the approximate method returns most of the meaningful nearest neighbors with the highest weight. While the approximate method retrieves only 85.8% of the first hundred nearest neighbors, this does not result in substantial reduction of meaningful nearest neighbors returned. To further support this claim we have run the evaluation of the proposed matching method, 1-NN matching, and augmented k-NN matching on both, recognition benchmark images of [18] and Ljubljana urban image data set, once using the approximate and the other time using exact nearest neighbors search. From the results presented in Figs. 5 and 7 it is evident that the difference in
4
Score
3.5
3
2.5
our approach augmented k−NN matching 1−NN matching exact nearest neighbor search
2 100
200
300
400
500 600 700 Number of images
800
900
1000
Figure 7. Comparison of recognition performance when using the approximate (colored, thin lines) and the exact nearest neighbors search (dark, thick lines) on the first 1000 recognition benchmark images of [18]. The results show that independent of the matching method used the difference in performance between the approximate and the exact method is negligible. 100% Percent of nearest neighbors retrieved
bases have consequently become too similar as specified by the inhibition angle λ, they are repelled from each other. We have experimentally observed that repeating the learning steps approximately as many times as is the number of vectors in the input set gives an overcomplete basis set enabling good approximate nearest neighbor search performance. The learning parameters ρ, α (attraction rate), λ, and β (repulsion rate) were set experimentally. The number of bases used was M = 1000.
95%
90%
85%
80%
75%
70%
1st NN 2nd NN 3rd NN 4th NN 5th NN 100 NNs
Figure 8. The retrieval rate of the proposed approximate nearest neighbors search method. The first five columns show retrieval rate for the first to fifth nearest neighbor respectively, while the last column shows average retrieval rate for the 100 nearest neighbors. The solid bars indicate percentage of nearest neighbors retrieved regardless whether they are meaningful or not, while the rectangles above the solid bars indicate the retrieval rate when also meaningfulness of nearest neighbors is considered. Please note that the vertical scale starts at 70%.
performance between the approximate (colored, thin lines) and the exact method (dark, thick lines) is negligible. Speed-up. The approximate nearest neighbors search method enabled us to processes all 10200 recognition benchmark images of [18] in 100 hours and all 48 query images of Ljubljana urban image data set in two hours. This required cross matching of seven million SIFT descriptor
vectors [18] and matching of 260000 features detected in the query images with 3.8 million features detected in the reference images of Ljubljana urban image data set. For comparison, using exhaustive nearest neighbors search we would need ten times as much, that is 1000 hours, or 41 days, for images of [18] and 19 hours for the query images of Ljubljana urban data set. It is important to note that the performance was evaluated by comparing the execution time of our approximate nearest neighbors search method against the execution time of the highly optimized implementation of the exhaustive search that fully utilized vectorized instructions of a 2.4 GHz Intel Core 2 Duo E6600 processor. The presented approximate nearest neighbors search method preserves data locality of exhaustive search, thus fully exploiting memory hierarchies.
5. Conclusion In this paper we have highlighted the effects pertinent to the high-dimensional spaces that are significant for matching local invariant features using nearest neighbors search. We presented a novel feature matching method which explicitly accounts for these. In our approach, we require every nearest neighbor to be meaningful, that is, sufficiently close to a query feature such that it is an outlier to a background feature distribution. We estimate the background feature distribution from the extended neighborhood of the query feature. To avoid slow brute-force search for nearest neighbors, we have developed a novel approximate nearest neighbors search method that provides a ten-fold speed-up over an exhaustive search even for high dimensional spaces (D = 128 in our case), while retaining excellent approximation to the exact nearest neighbor search. The performance of the presented high-dimensional feature matching method was evaluated by conducting image matching on two challenging image data sets, namely the data set of recognition benchmark images [18] and the Ljubljana urban image data set collected by ourselves for the purpose of image based localization. The method performed significantly better compared to the state-of-the-art methods in terms of accuracy, while it was indeed substantially slower than e.g. [14]. Our ongoing research is directed towards developments which would provide both high speed and increased accuracy to high-dimensional feature matching. Acknowledgements. We wish to thank Henrik Stew´enius and David Nist´er for kindly providing us with their recognition benchmark data set and for being very responsive in answering our questions.
References [1] A. Baumberg. Reliable feature matching across widely separated views. In CVPR, volume 1, pages 774–781, 2000.
[2] M. J. Bayarri and J. Morales. Bayesian measures of surprise for outlier detection. Journal of Statistical Planning and Inference, 111(1–2):3–22, February 2003. [3] J. S. Beis and D. G. Lowe. Shape indexing using approximate nearest-neighbour search in high-dimensional spaces. In CVPR, pages 1000–1006, 1997. [4] C. B¨ohm, S. Berchtold, and D. A. Keim. Searching in highdimensional spaces: Index structures for improving the performance of multimedia databases. ACM Computing Surveys (CSUR), 33(3):322–373, September 2001. [5] M. Brown and D. G. Lowe. Automatic panoramic image stitching using invariant features. IJCV, 74(1):59–73, August 2007. [6] V. Ferrari, T. Tuytelaars, and L. Van Gool. Simultaneous object recognition and segmentation from single or multiple model views. IJCV, 67(2):159–188, April 2006. [7] K. Grauman and T. Darrell. Approximate correspondences in high dimensions. In NIPS 19, pages 505–512, 2007. [8] P. Indyk. Nearest neighbors in high-dimensional spaces. In J. E. Goodman and J. ORourke, editors, Handbook of Discrete and Computational Geometry, chapter 39. CRC Press, 2nd edition, 2004. [9] P. Indyk and R. Motwani. Approximate nearest neighbors: towards removing the curse of dimensionality. In Proceedings of the 30th Symposium on Theory of Computing, pages 604–613, 1998. [10] D. G. Lowe. Distinctive image features from scale-invariant keypoints. IJCV, 60(2):91–110, November 2004. [11] J. Matas, O. Chum, M. Urban, and T. Pajdla. Robust widebaseline stereo from maximally stable extremal regions. Image and Vision Computing, 22(10):761–767, September 2004. [12] K. Mikolajczyk and C. Schmid. A performance evaluation of local descriptors. IEEE PAMI, 27(10):1615–1630, October 2005. [13] S. A. Nene and S. K. Nayar. A simple algorithm for nearest neighbor search in high dimensions. IEEE PAMI, 19(9):989– 1003, September 1997. [14] D. Nist´er and H. Stew´enius. Scalable recognition with a vocabulary tree. In CVPR, volume 2, pages 2161–2168, 2006. [15] B. Olshausen and D. Field. Sparse coding with an overcomplete basis set: A strategy employed by V1? Vision Research, 37(23):3311–3325, December 1997. [16] C. Schmid and R. Mohr. Local grayvalue invariants for image retrieval. IEEE PAMI, 19(5):530–535, May 1997. [17] J. Sivic and A. Zisserman. Video Google: A text retrieval approach to object matching in videos. In ICCV, volume 2, pages 1470–1477, 2003. [18] H. Stew´enius and D. Nist´er. Object recognition benchmark. http://vis.uky.edu/˜stewe/ukbench/. [19] T. Tuytelaars and L. Van Gool. Matching widely separated views based on affine invariant regions. IJCV, 59(1):61–85, August 2004. [20] W. Zhang and J. Koˇseck´a. Image based localization in urban environments. In International Symposium on 3D Data Processing, Visualization and Transmission, pages 33–40, 2006.