Published March 25, 2013
Pedology
High-Resolution 3-D Mapping of Soil Texture in Denmark Kabindra Adhikari* Rania Bou Kheir Mette B. Greve
Dep. of Agroecology Faculty of Science and Technology Aarhus Univ. Blichers Allé 20 P.O. Box 50, DK-8830 Tjele Denmark
Peder K. Bøcher
Ecoinformatics and Biodiversity Group Dep. of Bioscience Aarhus Univ. Ny Munkegade 114 DK-8000 Aarhus C Denmark
Brendan P. Malone Budiman Minasny Alex B. McBratney
Dep. of Environmental Sciences Faculty of Agriculture and Environment The Univ. of Sydney, Biomedical Building C81 1 Central Avenue Eveleigh, NSW 2015 Australia
Mogens H. Greve
Dep. of Agroecology Faculty of Science and Technology Aarhus Univ. Blichers Allé 20 P.O. Box 50, DK-8830 Tjele Denmark
Soil texture which is spatially variable in nature, is an important soil physical property that governs most physical, chemical, biological, and hydrological processes in soils. Detailed information on soil texture variability both in vertical and lateral dimensions is crucial for proper crop and land management and environmental studies, especially in Denmark where mechanized agriculture covers two thirds of the land area. We modeled the continuous depth function of texture distribution from 1958 Danish soil profiles (up to a 2-m depth) using equal-area quadratic splines and predicted clay, silt, fine sand, and coarse sand content at six standard soil depths of GlobalSoilMap project (0–5, 5–15, 15–30, 30–60, 60–100, and 100–200 cm) via regression rules using the Cubist data mining tool. Seventeen environmental variables were used as predictors and their strength of prediction was also calculated. For example, in the prediction of silt content at 0 to 5 cm depth, factors that registered a higher level of importance included the soil map scored (90%), landscape types (54%), and landuse (27%), while factors with lower scores were direct insolation (17%) and slope aspect (14%). Model validation (20% of the data selected randomly) showed a higher prediction performance in the upper depth intervals but increasing prediction error in the lower depth intervals (e.g., R2 = 0.54, RMSE = 33.7 g kg−1 for silt 0–5 cm and R2 = 0.29, RMSE = 38.8 g kg−1 from 100–200 cm). Danish soils have a high sand content (mean values for clay, silt, fine sand, and coarse sand content for 0- to 5-cm depth were 79, 84, 324, and 316 g kg−1, respectively). Northern parts of the country have a higher content of fine sand compared to the rest of the study area, whereas in the western part of the country there was little clay but a high coarse sand content at all soil depths. The eastern and central parts of the country are rich in clay, but due to leaching, surface soils are clay eluviated with subsequent accumulation at lower depths. We found equal-area quadratic splines and regression rules to be promising tools for soil profile harmonization and spatial prediction of texture properties at national extentacross Denmark. Abbreviations: AIC, akaike information criteria; C, categorical data; DEM, digital elevation model; DSM, digital soil mapping; GIS, geographic information system; lidar, light detection and ranging; LSP, land surface parameters; ME, mean error; MFD, multiple-flow direction; MRVBF, multi-resolution index of valley bottom flatness; Q, quantitative data; RMSE, root mean square error; RNE, relative nugget effect; SAGA, system for automated geoscientific analyses; SD, standard deviation; TIN, triangular irregular network; TWI, topographic wetness index.
S
oil, essentially a nonrenewable natural resource, is a dynamic and complex biomaterial (Young and Crawford, 2004), supports all terrestrial life on earth, and acts as a foundation for several environmental processes. Soil texture, which is spatially variable in nature (Burrough, 1993), is one of the most important physical properties, as it governs several physical, chemical, biological, and hydrological properties and processes in soils. Spatial variability in texture contributes to variations Soil Sci. Soc. Am. J. 77:860–876 doi:10.2136/sssaj2012.0275 Received 28 Aug. 2012. *Corresponding author (
[email protected]). © Soil Science Society of America, 5585 Guilford Rd., Madison WI 53711 USA All rights reserved. No part of this periodical may be reproduced or transmitted in any form or by any means, electronic or mechanical, including photocopying, recording, or any information storage and retrieval system, without permission in writing from the publisher. Permission for printing and for reprinting the material contained herein has been obtained by the publisher.
Soil Science Society of America Journal
in soil performance and crop yield (Warrick and Gardner, 1983; Tanji, 1996). It also affects soil moisture retention and availability (Crave and Gascuel-Odoux, 1997), soil aggregation, and risk of splash erosion (Luk, 1979). Therefore, a better understanding of such a vital resource is important for efficient farm management and environmental studies. Denmark is one of the best mapped countries in the world in terms of its data coverage and availability. One of these data sets is a soil texture database holding more than one observation per km2. Another data set is a digital elevation model with 1.6-m resolution, which is based on lidar scanning (light detection and ranging). Both data sets are freely available for the research communities. Although soil itself has received negligible political attention in Denmark, many scientific studies have addressed a range of soil quality aspects (Schjønning et al., 2009) where substantial work has been done to understand and manage Danish soils. Moreover, the country has had soil type-dependent restrictions on manure and fertilizer application from the early 1970s to protect soils and the environment. One of the major outputs of previous work in Denmark is the national Danish soil map: The Danish Soil Classification, which is a choropleth map at 1:50,000 scale (Madsen et al., 1992) classifying the surface soil (0–20 cm) into eight textural classes. However, to cope with the present data-demanding modeling techniques for understanding the complex soil system and soil-landscape processes in Denmark (e.g., the Danish simulation model DAISY [Hansen et al., 1990] requires depth-wise information on soil particle size distribution), rigidly defined soil classes are not optimal. So, to overcome this problem, Greve et al. (2007) produced the first soil surface texture maps of Denmark at a spatial resolution of 250 m using an ordinary kriging approach. Although all national soil maps published in Denmark so far describe soil properties in the topsoil, there is a need, both in terms of geographical and feature space, for detailed and more accurate continuous texture information by depth; for example, detailed texture data is needed for mapping soils sensitive to the leaching of pesticides. Such a need is even more pronounced when about two thirds of the country is under continuous, intensive, mechanized cultivation resulting in serious threats to the Danish soils such as soil compaction (Schjønning et al., 2009). Moreover, to support the global initiative of the GlobalSoilMap project (Sanchez et al., 2009; Hartemink et al., 2010), which aims to map all soils in the world at a fine resolution (100-m grid size) and make the digital maps readily available for landusers to assist decision-making in a range of global issues like food production and hunger eradication, climate change and environmental degradation, mapping soil properties (including soil texture) in Denmark according to the project specifications is also necessary. Soil texture has conventionally been mapped with polygons where each polygon illustrates a texture class. However, due to the presence of intra-polygon texture variability, there can be a large degree of uncertainty in the textural composition within the area labeled by a polygon (Heuvelink and Huisman, 2000). Thus, an alternative way to cope with this problem is to map different texwww.soils.org/publications/sssaj
tural fractions numerically (van Meirvenne and van Cleemput, 2006) so that intra-polygon textural variability can be better assessed. Moreover, most soil texture maps produced today are continuous surface maps in two dimensions completely ignoring the fact that texture also varies with depth. Soil properties in soil profiles vary continuously with depth (e.g., Russell and Moore, 1968), and this variability could be modeled using different functions ranging from simple freehand curves connecting the midpoint attribute values of the horizons ( Jenny, 1941) to advanced methods like exponential decay functions (Brewer, 1968; Moore et al., 1972; Minasny et al., 2006), linear regression and polynomials (Campbell et al., 1970), or equal-area splines of PonceHernandez et al. (1986). However, Bishop et al. (1999) suggested a higher efficiency of the equal-area quadratic splines over other methods due to their mass preserving and polynomial nature of fitting while modeling the depth function of soil attribute, and it has been used in many soil mapping studies (Malone et al., 2009; Malone et al., 2011; Adhikari et al., 2012; Odgers et al., 2012). Soil depth functions derived from the splines are point predictions and need to be upscaled to continuous soil attribute or soil class maps at different spatial scales according to the needs of end users, such as for food production, soil-water, gas emissions, and climate change studies. Such continuous maps are generated by a digital soil mapping (DSM) technique, a soil mapping process based on statistical models describing the relationship between soil properties, legacy soil information, and environmental variables influencing soil formation and distribution. A comprehensive overview of DSM and the environmental variables (‘scorpan’ factors) are well documented by McBratney et al. (2003). A more detailed explanation of DSM, its state-of-the-art and application in different environmental settings has also been compiled by Lagacherie et al. (2007) and Hartemink et al. (2008). The term ‘scorpan’ is a mnemonic for soil-forming factors such as soil, climate, organisms, parent materials, age, and spatial position that are used for empirical prediction of soil properties over space. It is an extension of the famous soil-forming factors of Jenny (1941), clorpt, which was meant for quantitative modeling of soil genesis. The relationship between ‘scorpan’ factors and soil properties is a fundamental element of DSM. Several studies have shown such relationship (Odeh et al., 1994; McKenzie and Ryan, 1999; Grunwald, 2006; Minasny et al., 2008; Dobos and Hengl, 2009; Bou Kheir et al., 2010; Greve et al., 2012a; Minasny et al., 2013) where various statistical approaches were used to quantify it to spatially predict soil properties (Minasny et al., 2013). According to Grunwald et al. (2011), a more accurate relationship between the environmental variables and soil properties can be quantified using dense data where the density and scale of soil observations resemble more closely the spatial resolution of the environmental variables used. But, in practice, finding a precise relationship is always hindered by a number of logistic constraints such as scale mismatch between the variables used or the different support for soil measurements (McKenzie and Ryan, 1999). Nevertheless, the strength of such relationship determines the success of soil and environmental correlation which would be an additional benefit 861
where the environmental variables are readily measurable and available throughout the study area (McKenzie and Ryan, 1999). A wide range of ‘scorpan’ factors could be integrated into the DSM to build prediction models. Although different modeling techniques are available, recent years have seen an increasing use of statistical methods which include decision trees (Venables and Ripley, 1994) and regression rule induction algorithms which can be implemented using the Cubist data mining tool (Quinlan, 1993) are gaining popularity as they do not require any data reduction steps and are able to explore complex, nonlinear soil-covariate relationships (Minasny and McBratney, 2008; Henderson et al., 2005; Tranter et al., 2007; Bui et al., 2006). The main objectives of our study therefore are:(i) to model the depth function of soil texture in the Danish soil profiles, and (ii) to map the lateral and vertical distribution of soil texture at a spatial resolution of »30 m in Denmark. We expect that our outputs would improve and update the current Danish Soil Information System with new fine-resolution soil property maps that could be useful to end users and stakeholders.
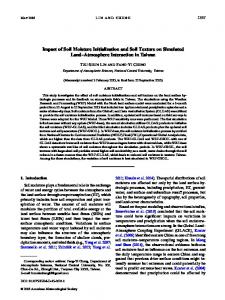
Materials and methods Study Area Our study area is Denmark (Fig. 1), a northern European country located in Scandinavia with a land area of roughly 43,000 km2. It lies between 54°33¢35²N to 57°45¢7² N and 8°4¢22² E to 15°11¢55² E (excluding Greenland and Faroe Islands which are also part of the Kingdom of Denmark). Denmark has a temperate climate with winter and summer mean temperatures of Fig. 1. Soil profile locations plotted on the landscape map of the study area clearly 0°C and 16°C, respectively (Danmarks Meteorologiske showing profiles along the gas pipeline (bottom), profiles in the regular grid, and Institut, 1998). Average annual precipitation varies from specific research profiles as clusters. 500 mm in the east to 800 mm in the west of the country. Danish Soil Profiles and Texture Data During late autumn, winter, and early spring, precipitation normally exceeds evapotranspiration, leading to leaching through the For our study, we used soil data from the Danish Soil Profile soil. Due to multiple glaciations during the Weichselian geological Database Service (Madsen et al., 1992), which has been a main stage, and the effect of late and postmarine transgressions, rather source of soil profile data at national level in Denmark. It concomplex glacial land systems have developed, which have greatly sists of soil texture data (and other properties) from soil profile influenced the formation and distribution of soils in Denmark horizons collected during the 1980s in connection with the fol(Schou, 1949). Soil types vary from coarse sand in the west to lowing three activities: (i) national soil monitoring grids (7 km), loamy soil in the eastern part of the country, while the northern (ii) natural gas pipeline trenches, and (iii) specific purpose proparts consist of marine sediments mixed with fine sandy materifiles. Approximately 850 soil profiles from 7-km national grids, als on post and late-glacial marine elements. The central and the of which 663 were located on farmland, 106 in forests, and the eastern parts of the country consist of moraine landscapes from rest on other landuses were investigated from 1987 to 1989 in the last glaciation, while older and strongly-eroded landscapes are the national nitrate study by the Danish Agricultural Advisory common in the west. The major crops grown across Denmark inService (Østergaard, 1990). A further 900 profiles were examclude wheat, maize, potato, and barley. Topographically, Denmark ined in conjunction with the installation of a natural gas pipeline across Denmark by Dansk Olie og Naturgas in the period is a relatively flat country with a mean elevation of 32 m with the 1981–1985 (Madsen and Jensen, 1985). Although soils along highest point about 172 m above msl. the pipelines were classified for each 25 m, approximately two to 862
Soil Science Society of America Journal
three profiles per kilometer were described in detail according to the genetic horizons (Madsen, 1983). Other studies have similarly investigated profiles in different parts of Denmark, which were also included in our study. All together, texture data from 1958 Danish soil profiles were gathered and used in our study. Most profiles considered in this study were extracted by digging a pit to 170 to 180 cm depth, followed by a further auger sample taken from a depth of 200 cm or 200 to 250 cm. During soil sampling, samples were collected separately from each pedological horizon in each profile and taken to the laboratory for analysis. Samples were air-dried at room temperature before passing the samples through a 2-mm sieve, and the fine-earth fraction was analyzed for texture components in the lab using wet sieving and hydrometer methods. Four texture components or size fractions, namely clay (