This is the Pre-Published Version Number size framing
1
Running head: NUMBER SIZE FRAMING Organizational Behavior and Human Decision Processes, In press
Comparing two tiny giants or two huge dwarfs? Preference reversals owing to number size framing
Kin Fai Ellick Wong Hong Kong University of Science and Technology Jessica Y. Y. Kwong The Chinese University of Hong Kong
Author’s Notes Preparation of this article was facilitated by RGC Direct Allocation Grant (DAG 03/04.BM14) awarded to Kin Fai Ellick Wong and RGC Earmarked Research Grant (CUHK4462/04H) awarded to Jessica Yuk Yee Kwong and Kin Fai Ellick Wong. We thank Virginia Unkefer and two anonymous reviewers for their helpful comments on an early version of this article. We also thank Kiniu Wong for inspiring us to do this research. We are grateful to Joyce Ng, Alex Fung, and Peggy Chan for their assistance in various aspects of this research. Correspondence concerning this article should be addressed to Kin Fai Ellick Wong, Department of Management of Organizations, Hong Kong University of Science and Technology, Clear Water Bay, Kowloon, Hong Kong SAR. E-mails may be sent to:
[email protected]
Number size framing Abstract Previous research has found that changes in irrelevant information, evaluation scales, or evaluation modes can lead to preference reversals. Drawing upon prospect theory, we introduced number size preference reversals, which occur under two conditions sharing identical information, evaluation mode, and evaluation scale. That is, for multiple options that have tradeoffs between attributes, an option is favored more when its superior attribute is framed with small numbers than when it is framed with large numbers.
We tested the number size
preference reversal in six experiments, demonstrating that it occurred in different background settings, remained stable when different evaluation scales were used, and was not contingent upon positive-negative attribute frames.
2
Number size framing
3
Comparing two tiny giants or two huge dwarfs? Preference reversals owing to number size framing
A large body of evidence has shown that people often have unstable and inconsistent preferences.
Their preference between two options may reverse under two normatively
equivalent conditions. For instance, people are willing to pay a higher price for a dictionary with defects that has 20,000 entries than for a defect-free dictionary that has 10,000 entries when the two dictionaries are considered together, yet they are willing to pay less for the former dictionary when the two dictionaries are considered separately (Hsee, 1996).
In another
instance, people prefer a low-payoff/high-probability gamble to a high-payoff/low-probability gamble in a choosing task, whereas they ask for a higher selling price for the high-payoff/low-probability gamble than for the low-payoff/high probability gamble (Grether & Plott, 1979; Lichtenstein & Slovic, 1971). To date, preference reversals have been observed in situations where the content of peripheral information presented is changed (e.g., Highhouse & Johnson, 1996), the evaluation scales used are changed (e.g., Tversky, Sattath, & Slovic, 1988), or the evaluation modes involved are changed (e.g., Hsee, 1996). Drawing from prospect theory (Kahneman & Tversky, 1979; Tversky & Kahneman, 1981), the present research shows that preference reversals actually can materialize even if the above factors remain unchanged. In the following, we first briefly summarize the literature on preference reversals. Then, we describe the theoretical basis of prospect theory that motivates us to propose a novel situation where preference reversals emerge. Next we report on six experiments that empirically demonstrated this phenomenon. discuss the implications of the present research.
Finally, we
Number size framing
4
Previous research on preference reversals Research thus far has revealed preference reversals under three different conditions. One type of preference reversal is induced by altering the content of the peripheral information presented between conditions. For example, Highhouse (1996) showed that the preference for two options was reversed when the information on a third option (i.e., a decoy option) was varied between conditions. In those studies, the information associated with the two target options was the same and preference reversals were prompted by changing the content of the peripheral information given between conditions.
Thus, the two conditions did not share identical
information. There are two types of preference reversals that involve identical information (see Hsee, Loewenstein, Blount, & Bazerman, 1999 for a review).
The first one results from changing the
evaluation scales used, and hence is referred to as the scale-type preference reversal. An evaluation scale is the type of responses that participants are requested to make.
Participants
may be asked to make a choice between two options; to accept or reject an option (Birnbaum, 1992; Shafir, 1993); to report their degree of happiness with the options (Nowlis & Simonson, 1997); to indicate the monetary value of the options (Coupey, Irwin, & Payne, 1998; Lichtenstein & Slovic, 1971; Tversky et al., 1988); and so forth.
In this type of preference reversal, people
switch their preferences for two alternatives when they are asked to give responses in different scales.
That is, they favor one option over another when one response scale is used (e.g.,
making a choice between two options), but reverse their preference when another response scale is employed (e.g., rating their satisfaction with each option). This type of preference reversal has been hypothesized to be due to the weight given to an attribute being greater when it is compatible with the evaluation scale than when it does not (Slovic, Griffin, & Tversky, 1990). The second type of preference reversal with identical information results from changing the
Number size framing
5
evaluation modes involved, and hence is referred to as the mode type preference reversal. Evaluation mode concerns with situations when multiple options are evaluated jointly or separately (see Hsee et al., 1999).
In a joint evaluation mode, the options are presented
simultaneously and evaluated together; in a separate evaluation mode, the options are presented one at a time and are evaluated in isolation. In this type of preference reversal, people often judge one alternative more favorably than another in the joint evaluation mode, while they dramatically reverse their judgment in the separate evaluation mode (Bazerman, Loewenstein, & White, 1992; Hsee, 1996; Hsee et al., 1999).
Hsee et al. (1999) propose an evaluability
hypothesis to explain this preference reversal, suggesting that difficult-to-evaluate attributes have a greater impact in joint evaluation mode than in separate evaluation mode. Departing from previous studies, we introduce a new type of preference reversal that does not result from changes in the content of the information, the evaluation scales, or the evaluation modes.
We expect that people exhibit preference reversals for multiple options when the
number size associated with the same piece of information is changed (e.g., presence rates of 93% vs. absence rates of 7%).
Drawing upon prospect theory (Kahneman & Tversky, 1979;
Tversky & Kahneman, 1981) and reference dependent theory (Tversky & Kahneman, 1991), we propose that the perceived difference between two options on an attribute looms large when that attribute is framed with small numbers (e.g., 3% vs. 7% of absence rates), yet the difference diminishes when it is framed with large numbers (e.g., 97% vs. 93% of presence rates). Accordingly, for multiple options with tradeoffs between attributes, preference reversals may occur depending on whether the superior attribute of one option is framed with large or small numbers.
We further argue that this type of reversal, which we call number size preference
reversals, is not conditional upon whether an attribute is positively or negatively framed; rather, it is a matter of number sizes that leads to the preference reversal.
Number size framing
6
In fact, this number size effect is a novel framing effect because preferences are altered as a result of rephrasing information in different but objectively equivalent descriptions. It is new because it does not fit readily into the current typology of framing effects (see Levin, Schneider, & Gaeth, 1998 for the typology). We return to this discussion on number size framing in the General Discussion.
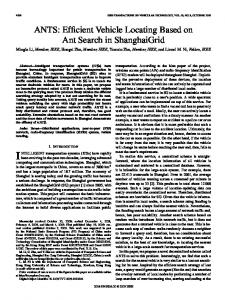
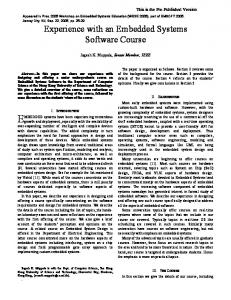
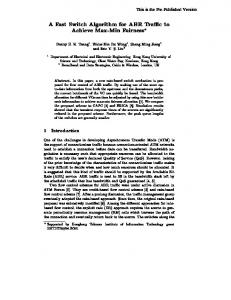
Prospect theory and preference reversals Prospect theory (Kahneman & Tversky, 1979; Tversky & Kahneman, 1981) was originally developed to describe the rules people follow in choice evaluation under uncertainty. Later on, Tversky and Kahneman (1991) extended the three essential characteristics to their reference-dependent model, explaining human choice behaviors in riskless choice tasks (e.g., consumer products, job candidates). The theory states that the outcomes of risky prospects are evaluated by a subjective value function (see Figure 1). characteristics.
The value function has three essential
First, the carriers of values could be defined in terms of a positive frame (e.g.,
saving 200 among 600, or 97% of presence rate) or a negative frame (e.g., losing 400 among 600, or 3% of absence rate), depending on the chosen reference point (i.e., reference dependence). Second, the marginal value of both gains and losses decreases with their size (i.e., diminishing sensitivity).
This characteristic follows the non-linear perception and judgment function in
many sensory and perceptual dimensions (Bernoulli, 1954; Galanter & Pliner, 1974). Thus, the value function is S-shaped, concave in the positive domain (i.e., above the reference point) and convex in the negative domain (i.e., below the reference point). the loss than in the gain domain (i.e., loss aversion).
Third, the function is steeper in
Thus, losses (i.e., outcomes below the
reference point) loom larger than corresponding gains (i.e., outcomes above the reference point). The S-shaped value function explains why individuals are risk averse regarding gains but risk
Number size framing
7
seeking regarding losses (Highhouse & Yuce, 1996; Levin et al., 1998; Tversky & Kahneman, 1981). ----------------------------------------Insert Figure 1 about here ----------------------------------------The characteristic of diminishing sensitivity is particularly relevant to number size framing. That is, the perceived difference between two objects in a specific attribute would appear larger when their standings in that attribute are framed with small numbers than when they are framed with large numbers. zero.
This is because the slope is steeper when the objective standing is closer to
For example, free-throw performance of basketball players could be described in a
positive frame as hit rates or in a negative frame as miss rates.
The difference in free-throw
performance between two basketball players should appear smaller when their performances are framed as 80% versus 89% hit rates than when they are framed as 20% versus 11% miss rates. As shown in Figure 1, the slope of the subjective value function between 80% and 89% is quite flat, which is in contrast to the steep slope between 20% and 11%. Drawing upon the characteristic of diminishing sensitivity, we suggest that preference reversals may occur when people compare multiple options with tradeoffs between attributes. To illustrate, consider the case when you are asked to choose between two Hi-Fi systems, A or B (see Table 1). system B.
Hi-Fi system A can hold fewer CDs but has a better sound quality than Hi-Fi
When sound quality is framed with large numbers (99.99% vs. 99.997% of audio
signal delivery), the two numbers fall on the flat slope of the subjective value function.
The
perceived difference between A and B in this dimension may become insignificant. People’s choices for the two Hi-Fi systems are likely shaped by the CD-changer capacity, thus favoring Hi-Fi system B over A.
On the contrary, when the sound quality is framed with small numbers
Number size framing
8
(.003% vs. .01% of audio signal distortion), the two numbers fall on the steep slope of the subjective value function.
People may now consider the difference between A and B in sound
quality to be “substantial.”
Thus, they are more likely to select Hi-Fi system A as compared
with the previous case. In essence, number size preference reversal captures the shift in relative preference for two options as a result of framing their attributes with large or small numbers. Some readers may query that the number size preference reversal is simply a matter of labeling a glass half-full or half-empty. positive-negative framing?
In other words, is it a reinvention of the traditional
We rule out this competing argument by showing that number size
preference reversals occur in both positive and negative framing situations.
It is indeed the
number size rather than the positive-negative framing that matters. ----------------------------------------Insert Table 1 about here -----------------------------------------
Overview of the present study We test number size preference reversals in six experiments. choice as the evaluation scale.
In Experiment 1, we used
Experiments 1a and 1b adopted a consumer purchasing context
and a performance evaluation context, respectively. In Experiments 2a and 2b, we examined the generality of the findings by using rating as the evaluation scale.
Experiments 3a and 3b ruled
out positive-negative framing as an alternative explanation for Experiments 1 and 2.
Experiment 1 Experiment 1a Method
Number size framing Participants, materials, and design.
9
Eighty undergraduate students participated in this
study. Each participant was randomly assigned to one of the two experimental conditions, the large number or the small number condition.
We adapted Hsee’s (1996) scenario. All
participants reviewed two mini Hi-Fi systems that differed only in two attributes, the CD-changer capacity and the sound quality.
After reviewing the information, the participants were asked
which mini Hi-Fi system they preferred to buy (i.e., a choice task). The content of the scenarios was identical, except that the sound quality was framed as “audio signal delivery” in the large number condition and as “audio signal distortion” in the small number condition (see Table 1). Note that the two sound quality expressions were essentially equivalent. The presentation formats of the CD-changer capacity were identical in the two conditions. A pilot test with 20 students revealed that they had no difficulty in understanding the scenarios. Procedure.
Participants were recruited from a university library.
After verbally
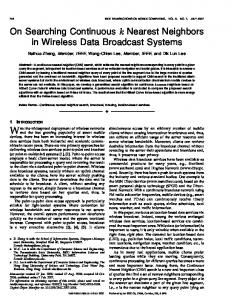
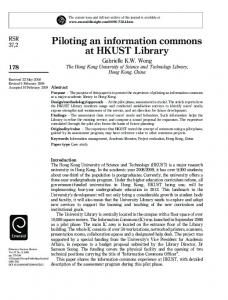
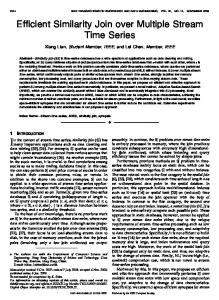
agreeing to participate in this experiment, participants were led to a quiet partitioned space to complete the scenario. The entire procedure lasted for about 10 minutes. Results Figure 2 clearly shows a crossover pattern. It shows that in the large number condition, more people prefer Hi-Fi system B to Hi-Fi system A: 16 people chose A and 24 people chose B.
In
the small number condition, a reversed pattern is observed: 28 people chose A and 12 people chose B.
A 2 (Format: Large number vs. small number) × 2 (Option: A vs. B) Chi-square
analysis was used to test for the effects of the presentation format on the preference for the two Hi-Fi systems.
The significant effect, χ2 (1) = 7.27, p < .01, indicates that the preference for the
two Hi-Fi systems was contingent upon the presentation format on sound quality. ----------------------------------------Insert Figure 2 about here
Number size framing
10
----------------------------------------Experiment 1b Method Participants, materials, and design.
Sixty-four students participated in this study.
Participants were told that they were “the manager of a computer software company and were looking for a computer programmer who could write in a special computer language named CY.” They were further told that the two candidates, David and Andy, differed in two attributes: proficiency in using CY and attendance. David performed better than Andy in terms of attendance but worse than Andy in terms of proficiency in using CY.
The information was
presented in two versions (a David-favored versus an Andy-favored format) that differed in the presentation format of the performance attributes (see Table 2). ----------------------------------------Insert Table 2 about here ----------------------------------------In the David-favored format, proficiency in using CY was indicated by “percentage of software written in CY that can be used” and attendance was indicated by “absence rate.”
In the
Andy-favored format, proficiency in using CY was indicated by “percentage of software written in CY that cannot be used” and attendance was indicated by “presence rate.” Participants were asked to indicate which candidate they would hire. Procedure.
All aspects were the same as Experiment 1a.
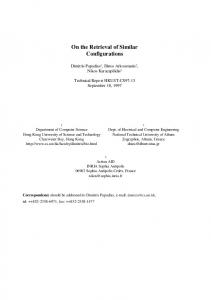
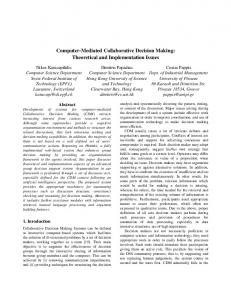
Results Figure 3 reveals that in the Andy-favored condition, substantially more participants preferred to hire Andy: 24 participants chose to hire Andy and eight participants chose to hire David.
Yet, in the David-favored condition, the relative attractiveness of Andy disappeared.
Number size framing
11
Here people showed similar preference between Andy and David: 16 participants chose to hire David and 16 chose to hire Andy.
A 2 (Format: David-favored vs. Andy-favored) × 2
(Candidate: David vs. Andy) Chi-square analysis yielded a significant effect, χ2 (1) = 4.27, p < .05, indicating that the relative attractiveness of Andy or David was contingent upon the presentation format of the two attributes. ----------------------------------------Insert Figure 3 about here ----------------------------------------Discussion Experiment 1 demonstrates number size preference reversals in a consumer purchasing context and a personnel selection context.
By altering the presentation format of identical
information, people reverse their choices between two options.
An option is more likely to be
chosen when its superior attribute is framed with small numbers and its inferior attribute is framed with large numbers.
This pattern is reversed when the number sizes of the attributes are
inverted. Although the findings of Experiment 1 supported our contention about number size preference reversals, there was still a question to pursue. That is, it is unclear if number size preference reversals are restricted to choice responses.
Specifically, because people’s preference
is sensitive to changes across evaluation scales (Lichtenstein & Slovic, 1971; Nowlis & Simonson, 1997; Tversky et al., 1988), it is possible that the preference reversal pattern found in Experiment 1 may not generalize to other conditions involving different evaluation scales. Demonstrating the occurrence of number size preference reversals with other evaluation scales would attest to the robustness of this phenomenon. 2a and 2b to address this concern.
We employed rating scales in Experiments
Number size framing
12
Experiment 2 Experiment 2a Method Participants, materials, and design.
Eighty-four students participated in this experiment.
The experiment used a 2 × 2 mixed design, with Format (A-favored vs. B-favored) as a between-subject factor and Airline (Airline A vs. Airline B) as a within-subject factor. Respondents were randomly given one of the two versions of a scenario in which the presentation format manipulation was embedded. Participants were told that they were going to a conference in the U.S. and there were only two airline companies offering flights that matched their itineraries.
They were further told that
the two airline companies had similar performance in all aspects except punctuality and baggage delivery. Airline A outperformed Airline B in baggage delivery whereas Airline B surpassed Airline A in punctuality.
The information was presented in two versions (A-favored vs.
B-favored condition) that differed in the presentation format of the two performance attributes (see Table 3). ----------------------------------------Insert Table 3 about here ----------------------------------------In the A-favored format, baggage delivery was indicated by “number of bags (out of 1000) that were not delivered to the destination” and punctuality was indicated by “number of flights (out of 1000) that arrived at the destination as scheduled.” In the B-favored format, baggage delivery was indicated by “number of bags (out of 1000) that were successfully delivered to the destination” and punctuality was indicated by “number of flights (out of 1000) that did not arrive
Number size framing at the destination as scheduled.”
13
Participants were asked to indicate their likelihood to patronize
Airline A or Airline B, respectively, using 10-point scales (1 = Very unlikely; 10 = Very likely). Procedure.
All aspects were the same as Experiment 1a.
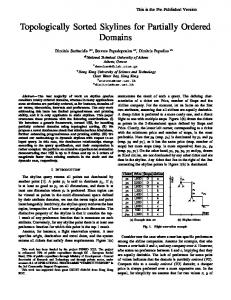
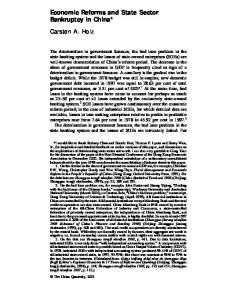
Results Figure 4 shows a clear reversal pattern between the two conditions.
In the A-favored
condition, the mean purchase likelihood rating for Airline A (M = 7.57, SD = 1.65) was higher than that for Airline B (M = 6.69, SD = 2.04).
An inverted pattern emerged in the B-favored
condition. Here the mean purchase likelihood rating for Airline A (M = 6.31, SD = 1.89) was lower than that for Airline B (M = 7.38, SD = 1.51).
This reversal pattern was confirmed in a 2
(Format: A-favored vs. B-favored) × 2 (Airline: Airline A vs. Airline B) analysis of variance (ANOVA). p < .001.
We found a significant Format × Airline interaction, F (1, 82) = 14.95, MSE = 2.68, Planned comparisons showed that people were significantly more likely to patronize
Airline A than Airline B in the A-favored condition, F (1, 82) = 5.38, MSE = 2.68, p < .05.
In
contrast, they were significantly more likely to patronize Airline B than Airline A in the B-favored condition, F (1, 82) = 10.37, MSE = 2.68, p < .01. ----------------------------------------Insert Figure 4 about here ----------------------------------------Experiment 2b Method Participants, materials, and design.
Seventy-five undergraduate and graduate students
participated in this study. This experiment used a 2 × 2 mixed design, with Format (Small number vs. Large number) as a between-subject factor and Candidate (David vs. Andy) as a within-subject factor.
Participants were told that they were “the manager of a computer
Number size framing
14
software company and were looking for computer programmers who could write in a special computer language named CY.”
They were further told that the two candidates (David and
Andy), who were both new graduates, differed on two attributes: proficiency in using CY and grade point average (GPA).
David performed better than Andy in terms of GPA but worse than
Andy in terms of proficiency in using CY. Respondents were randomly given one of the two scenarios in which the presentation format manipulation was embedded (Table 4). Proficiency in using CY was framed with failure rate (percentages of software written in CY that cannot be used) versus success rate (percentages of software written in CY that can be used) in the small number and large number conditions, respectively. The presentation formats of GPA were identical in the two conditions. Participants were asked to suggest a monthly salary for each candidate in HK$ (US$1 = HK$7.78). ----------------------------------------Insert Table 4 about here ----------------------------------------Procedure
All aspects were the same as Experiment 1a.
Results Figure 5 shows that the mean monthly salary for Andy (M = HK$10,441) is obviously higher than that for David (M = HK$9,459) in the small number condition, whereas the mean monthly salary for David (M = HK$9,797) is slightly higher than that for Andy (M = HK$9,741) in the large number condition.
A 2 (Format: Small number vs. Large number) × 2 (Candidate:
David vs. Andy) ANOVA confirmed this interaction pattern, F (1, 72) = 17.60, MSE = 690008, p < .001.
Planned comparisons revealed that the effect of Candidate was significant only in the
small number condition, F (1, 72) = 25.81, MSE = 690008, p < .0001, but not in the large number
Number size framing
15
condition, F < 1. ----------------------------------------Insert Figure 5 about here ----------------------------------------Discussion Experiment 2 again demonstrates number size preference reversals in a consumer purchasing context and a personnel selection context. This type of preference reversals also generalizes to continuous evaluation scales, namely likelihood to buy and monthly wages. All these findings suggest that number size preference reversal is a robust phenomenon. Although we argue that the reversal patterns that emerged in Experiments 1 and 2 are the result of presenting the same information with large versus small numbers, there is an alternative explanation for the current findings. Specifically, number size and valence of the frames were confounded in Experiments 1 & 2. In both experiments, large numbers were always presented with positively framed attributes (e.g., presence rate of 97% or 92%) and small numbers were always presented with negatively framed attributes (e.g., absence rate of 3% or 8%). Because of this confounding, it is unclear whether it was number size or valence of the frames that led to the switch in preferences. An alternative explanation for the present findings, therefore, is that people perceived greater differences between the two alternatives in the small number condition because it cast the information in a negative (versus positive) light.
As negatively framed
events would lead people to be more thorough in their analysis of information (Dunegan, 1993; Rozin & Royman, 2001), people would be less likely to overlook the differences between the two options in the negatively framed (small number) condition than they would in the positively framed (large number) condition. Accordingly, people may generally prefer the option that is superior in the negatively framed attribute (e.g., Willemsen & Keren, 2002).
The reversal
Number size framing
16
patterns found in Experiments 1 and 2 could therefore be due to differential attention paid to the positive and negative frames, rather than due to the number sizes.
We designed Experiment 3 to
rule out this competing explanation.
Experiment 3 In this experiment, we rule out the positive-negative framing explanation by recoupling number sizes and valence of the frames.
In Experiments 3a and 3b, we coupled the positive
frame with small numbers and the negative frame with large numbers.
The positive-negative
framing explanation asserts that people generally process negative information more deeply and carefully than they process positive information.
The perceived difference between the two
alternatives on an attribute should be larger when the attribute is negatively framed than when it is positively framed.
Thus, this explanation predicts that an option is preferred more when its
superior attribute is negatively framed (even if it is expressed with large numbers) than when it is positively framed (even if it is expressed with small numbers).
Thus, the positive-negative
framing explanation predicts an exactly opposite interaction pattern as the number size explanation does.
We tested these predictions with two evaluation scales.
We asked
participants to give choice responses in Experiment 3a and to give monetary estimates in Experiment 3b. Experiment 3a Participants, design, and evaluation task.
Seventy-two undergraduate and graduate
students participated in this study. Data from one participant were discarded because he/she did not complete the evaluation task. the following modifications.
The design and task resembled those of Experiment 1b with
First, the two candidates, David and Andy, differed on two
Number size framing attributes: Knowledge about CY and programming skills.
17
David performed better than Andy in
terms of programming skill but worse than Andy in terms of knowledge about CY. illustrates how the attributes were framed in the two presentation formats.
Table 5
Second, negatively
framed attributes (e.g., percentage of software written in CY that cannot be completed without consulting others) were always paired with large numbers (e.g., 80%, 89%) whereas positively framed attributes were always paired with small numbers. ----------------------------------------Insert Table 5 about here ----------------------------------------Procedure.
All aspects were the same as Experiment 1a.
Results Figure 6 shows a clear crossover pattern.
In the David-favored condition, more
participants (28) chose to hire David than to hire Andy (7).
Conversely, in the Andy-favored
condition, only eight participants chose to hire David and 28 participants chose to hire Andy.
A
2 (Candidate: David vs. Andy) × 2 (Format: David-favored vs. Andy-favored) Chi-square analysis yielded a significant effect, χ2 (1) = 23.7, p < .001, indicating that people clearly exhibited reversals of preference between the two presentation conditions. ----------------------------------------Insert Figure 6 about here ----------------------------------------Experiment 3b Participants, design, and evaluation task, and procedure. graduate students participated in this study. they did not complete the evaluation task.
Fifty-nine undergraduate and
Data from two participants were discarded because All aspects of this experiment were the same as
Number size framing
18
Experiment 3a, except that participants were asked to suggest a monthly salary for each candidate (this replaced the choice response). Results Again a reversal pattern was found (Figure 7). A 2 (Format: Andy-favored vs. David-favored) × 2 (Candidate: Andy vs. David) ANOVA confirmed this observation.
The focal
Format × Candidate interaction was significant, F (1, 55) = 7.85, MSE = 35824392, p < .01. Planned comparisons revealed that in the David-favored condition, the mean monthly salary for David (M = HK$8,089) was significantly higher than that for Andy (M = HK$6,671), F (1, 55) = 7.86, MSE = 35824392, p < .01.
Conversely, in the Andy-favored condition, the mean monthly
salary for David (M = HK$8,534) was lower than that for Andy (M = HK$9,103), though the difference was not statistically significant, F (1, 55) = 1.31, p > .05. Consistent with Experiment 3a, the present experiment showed that the preference for David or Andy in terms of monthly salary was contingent upon the number size of the two attributes. ----------------------------------------Insert Figure 7 about here ----------------------------------------Discussion Experiments 3a and 3b demonstrate reversal patterns that are consistent with the pattern predicted by the number size explanation, but are inconsistent with the pattern derived from the positive-negative framing explanation.
In this study, small numbers were associated with
positively framed attributes (e.g., 3% and 9% for percentages of software that can be used immediately without further debugging) and large numbers were associated with negatively framed attributes (e.g., 97% and 91% for percentages of software that cannot be used immediately without further debugging).
The positive-negative framing explanation would
Number size framing
19
predict that the perceived difference between Andy and David should mainly be driven by their performance in the negatively framed attribute, rather than the positively framed attribute. Accordingly, Andy should be judged better than David in the David-favored format whereas reverse should be true in the Andy-favored format. results.
This prediction contradicts with the current
Thus, this experiment not only replicates the major findings of Experiments 1 and 2, but
also rules out the positive-negative framing explanation.
General Discussion Implications for the preference reversal literature The primary contribution of this paper with respect to the preference reversal literature is to introduce a new type of preference reversal.
Preference reversals, as traditionally studied, occur
when the content of some peripheral information is changed (Highhouse, 1996).
Hsee (1996;
Hsee et al., 1999) noted that when identical information is involved, preference reversals would emerge if the evaluation scales or evaluation modes are altered.
The present paper advances this
literature by showing that when the information content, evaluation scales, and evaluation modes are held constant, people exhibit reversals of preference when the number size in numerical information is manipulated.
That is, depending on how you frame the numerical information of
two options – you may be comparing two tiny giants or two huge dwarfs –, your audience may actually reverse their relative evaluations of the alternatives. This number size preference reversal cannot be readily explained by mechanisms that underlie scale-type preference reversals or mode-type preference reversals. Specifically, scale-type preference reversals have been attributed to the compatibility between the evaluation scales and the evaluated attributes, such that the perceived difference between two options on an attribute weighs heavier when that attribute is compatible with the
Number size framing
20
evaluation scale than when it is not (Slovic, et al., 1990; Nowlis & Simonson, 1997; Tversky et al., 1988). For example, people are more influenced by the price attribute when preferences are elicited in comparison-based tasks than in tasks involving ratings (Nowlis & Simonson, 1997). This attribute-scale compatibility explanation is not applicable here because both the attributes and scales are held constant between conditions in the current effect. The mode-type preference reversal is explained by the difference in the evaluability of the attributes – whether the attributes are difficult or easy to evaluate independently (Hsee et al., 1999).
In general, an easy-to-evaluate attribute receives greater weight whereas a
difficult-to-evaluate attribute receives lower weight in separate evaluation modes and vice versa in joint evaluation modes.
This explanation, again, is not applicable to the number size
preference reversal because it occurs when the evaluation mode is held constant between conditions. Drawing upon prospect theory, we propose that number size preference reversals occur because comparisons of the options’ attributes follow an S-shaped value function.
When option
A’s superior attribute is framed with small numbers, the perceived difference with option B on this attribute is enlarged because the numbers fall on the steep slope of the value function. People’s subsequent evaluations are likely governed by the performance of both A and B on this attribute, thereby favoring option A.
In contrast, when option A’s superior attribute is framed
with large numbers, the perceived difference with option B on this attribute is compressed because the numbers fall on the flat slope of the value function.
This attribute has little impact
in differentiating the evaluations of A and B. Rather, subsequent judgments of A and B are likely shaped by other attributes.
This results in a reversed pattern.
The present findings are consistent with the above account. Experiment 1 demonstrated number size preference reversals in simple choice tasks.
Experiment 2 replicated the findings
Number size framing when the evaluation scales were changed to continuous variables.
21
Experiment 3 ruled out the
alternative explanation that the number size preference reversal is due to people paying more attention to negatively framed information than to positively framed information.
The findings
provide consistent support for the existence of number size preference reversals and the S-shaped value function from prospect theory as the underlying cause of this phenomenon. Implications for the framing literature Number size preference reversal is essentially a framing effect.
It perfectly fits the general
definition of framing effects, that is “decision makers respond differently to different but objectively equivalent descriptions of the same problem” (Levin et al., 1998, p. 150).
More
important, number size preference reversal is a novel framing effect that is different from what has been revealed in previous literature.
Levin et al.’s (1998) taxonomy includes three types of
framing effects, namely risky choice framing, attribute framing, and goal framing.
None of
these types is totally consistent with the number size framing demonstrated in Experiments 1 to 3. Number size framing is similar to risky choice framing in that both effects involve between-option comparisons and preference reversals.
They are nonetheless different because
risky choice framing concerns risky options (e.g., Kahneman & Tversky, 1979; Tversky & Kahneman, 1981), whereas number size framing regards two riskless options. In addition, number size framing seems to be the result of reference dependence and diminishing sensitivity in the subjective-value function, whereas risky choice framing seems to be driven by the combination of reference dependence and loss aversion. Number size framing overlaps with attribute framing in that both involve framing an attribute in one of two equivalent ways (e.g., framing beef as 25% fat vs. 75% lean). In attribute framing, usually only one option is presented. People generally find the option to be more attractive when the attribute is framed positively than when it is framed negatively (e.g., Levin &
Number size framing Geath, 1988).
22
Number size framing differs from attribute framing in that it extends beyond
single-option evaluation to multiple-option comparisons.
We also showed that number size
framing is not contingent upon the valence of the attributes. It is operative when the attributes are framed positively or negatively. There is no obvious overlap between number size framing and goal framing.
In goal
framing, people are more likely to perform an action when the consequence of that action is negatively framed (e.g., not performing the action will lead to negative consequences such as losses) than when it is positively framed (e.g., performing the action will lead to positive consequences such as gains).
Number size framing is different from goal framing in that
preferences between two choices are affected in number size framing, whereas the likelihood of performing a particular action is affected in goal framing. In sum, the number size effect is clearly a framing effect.
There is a fair amount of overlap
in the tasks used here and in risky choice framing as well as attribute framing.
Nonetheless, the
essence of number size framing, that is, multiple-option comparisons that entail numbers but not risk, sets itself apart from other framing effects documented so far and is a novel finding. Implications for riskless choice behaviors To extend their prospect theory from explaining risky choice behaviors to riskless choice behaviors, Tversky and Kahneman (1991) developed a reference-dependent model.
Among the
three essential characteristics of the reference-dependent model (reference dependence, loss aversion, and diminishing sensitivity), there has been research on how the combination of reference dependence and loss aversion is important to understanding riskless choice behaviors (e.g., Tversky & Kahneman, 1991), including some well-known phenomena such as the endowment effect (Thaler, 1980) and the status quo bias (Knetsch, 1989; Knetsch & Sinden, 1984).
Highhouse and Johnson (1996) also stress the combination of reference dependence and
Number size framing
23
loss aversion to explain riskless choice tasks such as choosing among job finalists. However, much less attention has been given to the role of diminishing sensitivity in riskless choice behaviors. Both departing from and complementing these prior studies, we focus on the role of diminishing sensitivity in riskless choice behaviors. We find that the combination of reference dependence and diminishing sensitivity is crucial in explaining number size preference reversals. In particular, the diminishing sensitivity characteristic helps explain why the perceived difference of two objects in an attribute is amplified when information is framed with small numbers but is attenuated when information is framed with large numbers.
Thus, the present study not only
adds new empirical evidence to the reference-dependent model, but also further reinforces the notion that prospect theory is potentially a more general theory of choice behaviors beyond risk and uncertainty contexts (Tversky & Kahneman, 1991; Highhouse & Johnson, 1996). Practical implications Number size preference reversals are particularly relevant to consumer behaviors.
The
present study reveals that when people are comparing two products with a tradeoff between attributes, they perceive a product to be more attractive when its superior attributes are framed with small numbers while its inferior attributes are framed with large numbers.
This finding
implies that the information displayed to consumers should not be arbitrarily decided; careful choices of number sizes may actually make the products more attractive. Our findings also seem to be relevant to the reliability and validity of the use of performance evaluations in organizational contexts.
Typically, between-individual comparison is one of the
major purposes of performance evaluation (Cleveland, Murphy, & Williams, 1989).
The
relative ranking among ratees is often used for administrative purposes, such as promotion, salary increases, and job separation (Murphy & Cleveland, 1995; Murphy, Garcia, Kerkar, Martin, &
Number size framing Balzer, 1982).
24
Number size framing, however, may influence the perceived performance
difference between two ratees (Wong & Kwong, 2005). In particular, when two ratees have a tradeoff between performance attributes, their relative evaluations may be altered by the way their performances were framed.
Their relative attractiveness or rankings will depend on the
number size associated with the performance attributes.
That is, a ratee is likely to have a
higher rank when his/her superior performance attributes are framed with small numbers and his/her inferior performance attributes are framed with large numbers. Limitations and future research One limitation the present study is that it did not address the rule(s) underlying the characteristic of diminishing sensitivity. Kahneman and Tversky (1979; Tversky & Kahneman, 1981) noted that the diminishing sensitivity follows Stevens’ power law (e.g., Galanter & Pliner, 1974).
Alternatively, people may use a ratio rule by comparing the ratio between the attributes
of two options.
That is, people might be attending to the ratio, instead of difference, between
two attribute values.
Accordingly, “96% vs. 99%” appears to be equivalent because their ratio
is very close to 1, while “4%” is four times bigger than 1%. This ratio rule essentially follows Weber’s law, which is the core assumption of Fechner’s law (Fechner, 1860).
Note that
psychophysics research has shown that Stevens’ power law is more accurate than Fechner’s law in a wide variety of areas (Galanter, 1990; Galanter & Pliner, 1974; Stevens, 1936, 1961, 1962). Nonetheless, it is unclear from the present study which law leads to the number size effects. It is also worth to note the potential connection between information leakage account of framing effects (McKenzie, 2004; McKenzie & Nelson, 2003) and the findings in the present study.
Specifically, Mckenzie and Nelson (2003) have argued that (a) speakers might
intentionally frame options in a way that can be informative to listeners, and (b) listeners appear to be aware of speakers’ preference from how the options are framed.
For example, listeners
Number size framing
25
might infer that a medical treatment leads to a relatively positive outcome (e.g., many survivors) if the speaker describes the outcome in terms of survival percentages than in terms death percentages.
In the context of number size framing, the information leakage account suggests
that respondents might get the implicit information that the weights of attributes expressed with large number should be lower than the weights of attributes expressed with small numbers.
This
speculation deserves further research to verify. Conclusion The present study shows that for two options involving a tradeoff between two attributes, the preference between these options may change depending on whether the attributes are framed with large or small numbers.
This type of preference reversal is distinctive from previously
identified preference reversals (e.g., Hsee et al., 1999; Highhouse, 1996) in that it occurs between conditions sharing identical information, evaluation scales, and evaluation modes.
The current
effect also makes a novel addition to the types of framing effects discussed in the existing literature. Our research further suggests that the S-shape value function from prospect theory and the reference-dependence model seem to provide a satisfactory explanation for number size preference reversals, reinforcing the notion that the core ideas of prospect theory is applicable to a broader context beyond risk-taking behaviors.
Number size framing
26
References Bazerman, M. H., Loewenstein, G. F., & White, S. B. (1992). Reversals of preference in allocation decisions: Judging an alternative versus choosing among alternatives. Administrative Science Quarterly, 37, 220-240. Bernoulli, D. (1954). A new theory on the measurement of risk (L. Sommer, Trans.). Econometrica, 22, 23-36. (Original work published 1738). Birnhaum, M. H. (1992). Issues in utility measurement. Organizational Behavior and Human Decision Processes, 52, 319-330. Cleveland, J. N., Murphy, K. R., & Williams, R. E. (1989). Multiple uses of performance appraisal: Prevalence and correlates. Journal of Applied Psychology, 74, 130-135. Coupey, E., Irwin, J. R., & Payne, J. W. (1998). Product category familiarity and preference construction. Journal of Consumer Research, 24, 459-467. Dunegan, K. J. (1993). Framing, cognitive modes, and image theory: Toward an understanding of a glass half full. Journal of Applied Psychology, 78, 491—503. Fechner, G. (1860). Elemente der Psychophysik. Berlin: Springer. Galanter, E. (1990). Utility functions for nonmonetary events. American Journal of Psychology, 105, 449-470. Galanter, D., & Pliner, P. (1974). Cross-modality matching of money against other continua. In H. Moskowitz, B. Sharf, & J. C. Stevens (Eds.), Sensation and measurement: Papers in honor of S. S. Stevens (pp. 65-76). Dordrecht, The Netherlands: Reidel. Grether, D. M., & Plott, C. R. (1979). Economic theory of choice and the preference reversal phenomenon. American Economic Review, 69, 623-638. Highhouse, S., & Johnson, M. A. (1996). Gain/loss asymmetry and riskless choice: Loss aversion in choices among job finalists. Organizational Behavior and Human Decision Processes, 68,
Number size framing
27
225-233. Highhouse, S., & Yuce, P. (1996). Perspectives, perceptions, and risk-taking behavior. Organizational Behavior and Human Decision Processes, 65, 159-167. Hsee, C. K. (1996). The evaluability hypothesis: An explanation of preference reversals between joint and separate evaluations of alternatives. Organizational Behavior and Human Decision Processes, 46, 247-257. Hsee, C. K., Loewenstein, G. F., Blount, S., & Bazerman, M. H. (1999). Preference reversals between joint and separate evaluations of options: A review and theoretical analysis. Psychological Bulletin, 125, 576-590. Kahneman, D., & Tversky, A. (1979). Prospect theory: An analysis of decision under risk. Econometrica, 47, 263-291. Knetsch, J. L. (1989). The endowment effect and evidence of nonreversible indifference curves. American Economic Review, 79, 1277-1284. Knetsch, J. L., & Sinden, J. A. (1984). Willingness to pay and compensation demanded: Experimental evidence of an unexpected disparity in measures of value. Quarterly Journal of Economics, 99, 507-521. McKenzie, C. R. M. (2004). Framing effects in inference tasks – and why they are normatively defensible. Memory & Cognition, 32, 874-885. McKenzie, C. R. M., & Nelson, J. D. (2003). What a speaker’s choice of frame reveals: Reference points, frame selection, and framing effects. Psychonomic Bulletin & Review, 10, 596-602. Murphy, K. R., & Cleveland, J. N. (1995). Understanding performance appraisal: Social, organizational, and goal-based perspectives. Thousand Oaks, CA: Sage. Murphy, K. R., Garcia, M., Kerkar, S., Martin, C., & Balzer, W. K. (1982). Relationship between
Number size framing
28
observational accuracy and accuracy in evaluating performance. Journal of Applied Psychology, 67, 320-325. Nowlis, S. M., & Simonson, I. (1997). Attribute-task compatibility as a determinant of consumer preference reversals. Journal of Marketing Research, 34, 205-218. Levin, I. P., Schneider, S. L., & Gaeth, G. J. (1998). All frames are not created equal: A typology and critical analysis of framing effects. Organizational Behavior and Human Decision Processes, 76, 149-188. Levin, I. P., & Gaeth, G. J. (1988). Framing of attribute information before and after consuming the product. Journal of Consumer Research, 15, 374–378. Lichtenstein, S., & Slovic, P. (1971). Reversal of preferences between bids and choices in gambling decisions. Journal of Experimental Psychology, 89, 46-55. Rozin, P., & Royman, E. B. (2001). Negativity bias, negativity dominance, and contagion. Personality and Social Psychology Review, 5, 296-320. Shafir, E. (1993). Choosing versus rejecting: Why some options are both better and worse than others. Memory & Cognition, 21, 546-556. Slovic, P., Griffin, D., & Tversky, A. (1990). Compatibility effects in judgment and choice. In R. M. Hogarth (Ed.), Insights in decision making: Theory and applications (pp. 5-27). Chicago: University of Chicago. Stevens, S. S. (1936). A scale for the measurement of a psychological magnitude: Loudness. Psychological Review, 43, 405-416. Stevens, S. S. (1961). To honor Fechner and repeal his law. Science, 133, 80-86. Stevens, S. S. (1962). The surprising simplicity of sensory metrics. American Psychologists, 17, 29-39. Thaler, R. (1980). Toward a positive theory of consumer choice. Journal of Economic Behavior
Number size framing
29
and Organization, 1, 39-60. Tversky, A., & Kahneman, D. (1981). The framing of decisions and the psychology of choice. Science, 211, 453-458. Tversky, A., & Kahneman, D. (1991). Loss aversion in riskless choice: A reference-dependent model. Quarterly Journal of Economic, 106, 1039-1061. Tversky, A., Sattath, S., & Slovic, P. (1988). Contingent weighting in judgment and choice. Psychological Review, 95, 371-384. Willemsen, M. C., & Keren, G.. (2002). Negative-based prominence: the role of negative features in matching and choice. Organizational Behavior and Human Decision Processes, 88, 643-666. Wong, K. F. E., & Kwong, J. Y. Y. (2005). Between-individual comparisons in performance evaluation: A perspective from prospect theory. Journal of Applied Psychology, 90, 284-294.
Number size framing Table 1. Product information on Hi-Fi systems A and B in Experiment 1a
Presentation format Small number
CD-changer
Hi-Fi
Hi-Fi
Hi-Fi
Hi-Fi
system A
system B
system A
system B
2
10
2
10
99.997%
99.99%
capacity a Sound quality b
Large number
CD-changer capacity
.003%
.01%
Sound quality c
Note. a CD-changer capacity is the number of CDs the Hi-Fi system can hold. b
Sound quality is expressed as audio signal distortion in the small number condition. It is
calculated by (Amount of noise signal / An audio signal output).
Expressed in percentage, the
lower the better. c
Sound quality is expressed as audio signal delivery in the large number condition. It is
calculated by 1 – (Amount of noise signal / An audio signal output). the higher the better.
Expressed in percentage,
30
Number size framing
31
Table 2. Performance information on Andy and David in Experiment 1b
Presentation format
Proficiency in using
David-favored
Andy-favored
format
format
David
Andy
95%
98%
CY a Attendance c
Proficiency in using
David
Andy
5%
2%
97%
92%
CY b 3%
8%
Attendance d
Note. a Proficiency in using CY was expressed as “percentage of software written in CY that can be used” in the David-favored condition b
Proficiency in using CY was expressed as “percentage of software written in CY that cannot be
used” in the Andy-favored condition c
Attendance was expressed as “absence rate” in the David-favored condition
d
Attendance was expressed as “presence rate” in the Andy-favored condition
Number size framing
32
Table 3. Performance information on Airlines A and B in Experiment 2a
Presentation format A-favored
Baggage delivery a Punctuality c
B-favored
Airline A
Airline B
2
9
996
999
Baggage delivery b Punctuality d
Airline A
Airline B
998
991
4
1
Note. a Baggage delivery in the A-favored condition: For every 1000 bags, the number of bags that were not delivered to the destination. b
Baggage delivery in the B-favored condition: For every 1000 bags, the number of bags that
were successfully delivered to the destination. c
Punctuality in the A-favored condition: For every 1000 flights, the number of flights that arrived
at the destination as scheduled. d
Punctuality in the B-favored condition: For every 1000 flights, the number of flights that did not
arrive at the destination as scheduled.
Number size framing
33
Table 4. Performance information on Andy and David in Experiment 2b
Presentation format Small number
Proficiency in
David
Andy
5%
2%
Large number
Proficiency in
using CY
using CY
(Failure rates)a
(Success rates)b
Academic record
A
B-
Academic record
David
Andy
95%
98%
A
B-
Note. a Failure rates was expressed as “percentage of software written in CY that cannot be used” in the small number condition. b
Success rates was expressed as “percentage of software written in CY that can be used” in the
large number condition.
Number size framing
34
Table 5. Performance information on Andy and David in Experiments 3a and 3b.
Presentation format
Knowledge about
David-favored
Andy-favored
format
Format
David
Andy
89%
80%
CYa Programming skill c
Knowledge about
David
Andy
11%
20%
91%
97%
CYb 9%
3%
Programming skill d
Note: a Knowledge about CY was expressed as “percentage of software written in CY that cannot be completed without consulting others” in the David-favored condition. b
Knowledge about CY was expressed as “percentage of software written in CY that can be
completed without consulting others” in the Andy-favored condition. c
Programming skill was expressed as “percentage of software written in CY that can be used
immediately without further debugging” in the David-favored condition d
Programming skill was expressed as “percentage of software written in CY that cannot be used
immediately without further debugging” in the Andy-favored condition
Number size framing
35
Figure Captions Figure 1.
An illustration of how presenting information with large numbers or small
numbers may influence the perceived difference between two performances.
In the positive
domain, the difference between 80% and 89% appears to be small because the two numbers are on the flat part of the value function. However, the difference between 20% and 11% in the negative domain appears to be large because the two numbers are on the steep part of the value function. Figure 2.
Results of Experiment 1a.
Figure 3.
Results of Experiment 1b.
Figure 4.
Results of Experiment 2a.
Figure 5.
Results of Experiment 2b.
Figure 6.
Results of Experiment 3a.
Figure 7.
Results of Experiment 3b.
Number size framing Figure 1.
Subjective Value
Flat
Negative
-100%
20 11
100%
Positive
80 89
Objective value
Steep
36
Number size framing
Numbers of people choosing the Hi-Fi system
Figure 2 Hi-Fi system A (Superior in sound quality)
30
Hi-Fi system B (Suprior in CD-changer capacity)
25 20 15 10 5 0 Small number condition
Large number condition
37
Number size framing Figure 3
Numbers of people choosing the candidate
David (Superior in attendance)
30
Andy (Superior in CY proficiency)
25 20 15 10 5 0 David-favored condition
Andy-favored condition
38
Number size framing Figure 4
Airline A (Superior in baggage delivery) Rating on likelihood to patronize
8
Airline B (Superior in punctuality)
7
6
5 A-favored condition
B-favored condition
39
Number size framing Figure 5
David (Superior in academic record)
Monthly Salary (HK$)
10500
Andy (Superior in CY proficiency)
10000 9500 9000 8500 Small number condition Large number condition
40
Number size framing
Numbers of people choosing the candidate
Figure 6.
David (Superior in programming skills)
30
Andy (Superior in Knowledge about CY)
25 20 15 10 5 0 David-favored condition
Andy-favored condition
41
Number size framing Figure 7
David (Superior in programming skills)
Monthly salary (HK$)
9500
Andy (Superior in Knowledge about CY)
9000 8500 8000 7500 7000 6500 David-favored condition Andy-favored condition
42