IEEE Workshop on Applications of Computer Vision, January 2013
HotSpotter - Patterned Species Instance Recognition Jonathan P. Crall Rensselaer Polytechnic Institute
Charles V. Stewart Rensselaer Polytechnic Institute
[email protected]
[email protected]
Tanya Y. Berger-Wolf University of Illinois-Chicago
Daniel I. Rubenstein Princeton University
Siva R. Sundaresan Denver Zoological Foundation
[email protected]
[email protected]
[email protected]
Abstract We present HotSpotter, a fast, accurate algorithm for identifying individual animals against a labeled database. It is not species specific and has been applied to Grevy’s and plains zebras, giraffes, leopards, and lionfish. We describe two approaches, both based on extracting and matching keypoints or “hotspots”. The first tests each new query image sequentially against each database image, generating a score for each database image in isolation, and ranking the results. The second, building on recent techniques for instance recognition, matches the query image against the database using a fast nearest neighbor search. It uses a competitive scoring mechanism derived from the Local Naive Bayes Nearest Neighbor algorithm recently proposed for category recognition. We demonstrate results on databases of more than 1000 images, producing more accurate matches than published methods and matching each query image in just a few seconds.
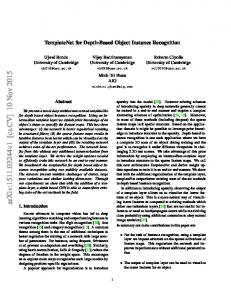
Figure 1: An example of HotSpotter. The ROI is placed on a query animal — in this case a foal — and a ranked list of matching animal images from the database is returned. Here, the correct match, an image of the same animal as an older juvenile, is the best match (top right). The green ellipses show the matching regions, or “hot spots”, between the two images. Images along the bottom of the figure show significantly lower matching scores for different animals.
1. Introduction
Fundamentally, exploiting the wealth of photographic data for animal population analysis depends on locating and recognizing the animals in each image. The recognition step requires comparing each animal image to a database of pictures of animals that have already been identified, and then either adding to the record of a previously known animal or creating an additional record for a new individual. Even for small populations of 100 animals, doing this comparison manually is tedious and error prone. It does not scale at all to large populations. Clearly, computer-based methods for automatic animal identification are needed. This need has spawned research on recognition of animals ranging from penguins to zebras to whale sharks [20, 2]. Some methods are species specific [5, 21, 11], while others have strived for generality [24, 4]. In particular, the Wild-ID algorithm of Bolger et al. [4] employs keypoint
Motivation: Conducting research on animal populations requires reliable information on the position and movement of individual animals. Traditionally, this information has been obtained by attaching tags and transmitters to captured animals. These methods do not scale well to large populations, are expensive, physically invasive, and require proximity to unwilling subjects [8, 27]. The widespread availability of inexpensive, good-quality digital cameras offers the promise of an alternative approach. Images of animals may be taken by anyone who has a camera — scientists and their assistants, ecotourists, and even ordinary citizens — producing the potential for enormous flood of image data. Moreover, recent cameras include both a clock and a GPS unit, allowing each image to also record location and time. 1
matching techniques from computer vision literature [13] to determine if two images show the same animal. In our paper, we build on more recent methods from the computer vision literature to take an important step beyond this, creating both an improved method for matching two images and a fast method for matching against the entire database without sequential image-to-image matching. Problem Statement: Our computational task is as follows. We are given a database of labeled images, where each label identifies (names) the individual animal in the image. The same animal may appear in more than one database image. We keep multiple images to accommodate viewpoint differences and appearance changes. Given a novel query image, IQ , and a manually-specified rectangular region of interest (ROI) locating the animal in the image, our goal is to assign a label to the animal in the ROI or to decide that the animal has not been seen before. More practically, the goal is modified slightly: to provide a set of potential animal labels from the database ranked by a similarity score. A high score should indicate a highly probable match, while low scores should indicate improbable matches. Figure 1 shows an example. Three comments about this problem are appropriate. First, user interaction is required only to select the animal ROI in the query image and to verify the labeling results. Ongoing work will replace both of these with more automated methods, but some user interaction will always be necessary, both for the hardest cases and to build user confidence in the system. Second, for the current work, we assume the collection protocol has produced images all of one flank of the animals, avoiding the ambiguity associated with seeing two different sides of the same animal. Third, for the experiments in this paper, the database of animal images and labels is static. In practice, however, the database will be dynamic. We bias our selection of techniques in light of this, and the system described here is already in use with a changing image set. However, fully addressing the issues of a efficiently searchable, large-scale, and dynamic database of animal images is beyond the scope of this paper. Algorithm Overview: We present two algorithms to solve the animal identification problem. A high-level summary of both is: (a) for every image, the algorithms locate keypoints and extract associated descriptors (128dimensional vectors), and (b) they then determine image matches based on the comparison of these descriptors. The first algorithm is similar to Wild-ID [4] in that it matches the query image against each database image separately, sorting the database images by the resulting similarity score in order to generate the final ranked results. This is our one-vs-one matching algorithm, and it contains several minor improvements over Wild-ID that result in a more robust algorithm. Our second algorithm, which we refer to as the one-vs-
many algorithm, matches each descriptor from the query image against all descriptors from the database image using a fast, approximate nearest neighbor search data structure. It generates scores for each database image based on these matches, and then aggregates the scores to produce the final, overall similarity score for each individual (each label). In addition to introducing fast matching to the animal identification problem, our most important contribution here is a new mechanism for scoring descriptor matches based on the Local Naive Bayes Nearest Neighbor methods [14]. Dataset: We test our algorithms, which are currently in use in the field in Kenya, on five different species of animals: giraffes, jaguars, lionfish, plains zebras and Grevy’s zebras. Our most extensive databases are for the zebras, so these are the focus of the experiments in this paper.
2. Related Work Animal Identification: A variety of techniques have been proposed for animal identification [5, 21, 24]. We outline the two most closely related in terms of feature representation, matching, scoring, and results. StripeSpotter [11] bases recognition on features called stripe-codes, two dimensional strings of binary values designed to capture the typical stripe patterns of zebras. Similarity between stripe-codes is measured by a modified editdistance dynamic-programming algorithm. Queries are run by measuring similarity to each database image individually and returning the top matches. On a database of 85 plains zebras, StripeSpotter achieves a median correct rank of 4. Wild-ID [4] uses the original SIFT [13] features and descriptors. It scores the query image against each database image separately. For each feature in the query image, the best match is found in each database image. These matches are tested for inter-image consistency using randomlysampled triples of matches, a variation on more typical RANSAC methods. The score of each database image is the proportion of consistent triples. On a database of 100 Wildebeest images, Wild-ID achieved a false positive rate of 8.1 × 10⁻⁴ , with a false rejection rate ranging from .06 − .08 [16]. In our one-vs-one algorithm we return to more common methods and introduce a number of recent innovations to produce somewhat better performance. Turning to the computer vision literature, instance recognition is the problem of finding the images in a database that match a query image. By contrast, category recognition is the problem of identifying the class an image belongs to — e.g. car, person, bicycle — rather than identifying a particular instance of the class. Our problem is closely related to instance recognition, but we are more interested in identifying (labeling) the object (animal) than in finding all images. Research in instance recognition during the last decade has primarily focused on large-scale search, starting with the development of visual vocabularies [23] and fast match-
ing through vocabulary tree construction [17]. Typical methods [19] build a visual vocabulary with millions of words and represent images as visual-word vectors. Scores between two images are computed using the TF-IDF [23] weighted distance between query and database visual-word vectors. Searching large databases is done efficiently by using an inverted file. Spatial verification re-ranks query results to produce a final ranking of matches to the database image. Recent innovations include query expansion [6], Hamming embedding, [9], and feature augmentation [1]. In our work, we adopt several of these features but ignore others because (a) we are only interested in correctly identifying the animal (high precision) not finding all matching images (total recall), and (b) we do not want to incur expensive preprocessing. Category recognition methods have tended to use dense sets of features and descriptors [12], with much smaller vocabularies than instance recognition methods. By contrast, Boiman et al. [3] demonstrate the harmful effect of quantization and describe an alternative non-quantized approach. Given a set of query image descriptors, for every category, its match score is the sum of the square distances between each query descriptor and the closet descriptor from that category, regardless of the descriptor’s parent image. McCann and Lowe [14] generalized this by simultaneously matching each query descriptor to its k nearest neighbors across all categories. Our one-vs-many algorithm applies this technique to animal identification.
ance to the gradient direction increases the discrimination power of matching. For each region (x, A) we extract a RootSIFT [1] descriptor, d ∈ R128 , which is the the component-wise square root of the usual SIFT descriptor vector [13]. Using the square root de-emphasizes the larger components in a SIFT vector, making it more resistant to changes between images. The feature locations, elliptic regions and descriptors for each image I are stored in three sets X = {xi }, A = {Ai }, D = {di }. The second part of preprocessing is the construction of a fast search data structure. For one-vs-one matching, we build a small forest of k-d trees [22] for the query image descriptors using the VLFeat [25] library. Since this is a one-vs-one algorithm it is not necessary to build a search data structure for each of the database images.
3. One-Vs-One Matching
exceeds some threshold, tratio = 1.62 . All such matches are collected into a set MD = {(i, j, ri,j )}.
We describe the one-vs-one algorithm first and then present the modifications to create the faster one-vs-many algorithm. Both algorithms consist of five steps: 1) preprocessing, 2) matching, 3) image scoring, 4) spatial reranking, and 5) label (animal name) scoring.
3.1. Preprocessing Preprocessing involves extracting features and building search data structures. Before feature extraction, each database and query image is cropped to a rectangular region of interest (ROI) and resized to a standard dimension, while preserving aspect ratio. For image, I, either from the database or from the query, the features are locations x of spatial and scale extrema of the ’Hessian-Hessian’ [18] operator applied to I. This operator is faster and more stable than the standard ’HessianLaplace’ [15], already known to outperform the ’DoG’ operator used in [4]. An elliptical shape is fit to the region [15], represented as a matrix A = [ ab 0c ], with orientation angle, θ [18]. Often θ is the aggregate of gradient directions in the region surrounding x, but instead, we assume that the “gravity vector” is downward in each image and use this to simply assign θ = 0. Removing the invari-
3.2. One-vs-One Matching Let ID be the database image, with descriptor vectors DD , and let IQ be the query image with descriptor vectors DQ . For each di ∈ DD , the two closest query image descriptors, {qj , qj2 } ⊂ DQ are found (with high probability) through a restricted, prioritized search of the k-d tree forest. Using the standard ratio-test [13], a correspondence is formed between the i-th feature of ID and the j-th feature of IQ only if the ratio of nearest descriptor squared distances ri,j =
||di − qj2 ||2 ||di − qj ||2
(1)
3.3. Initial Image Scoring
The initial image score between each database image ID and the query image IQ depends simply on the ratios stored in the match set, which encourages numerous distinctive correspondences. � Sim(MD ) = ri,j (2) (i,j,ri,j )∈MD
3.4. Spatial Reranking The initial image scores are computed without regard to spatial constraints. To filter out any “spatially inconsistent” descriptors we implement the standard RANSAC solution used in [19] and described in [7]. We limit the computation to the KSR = 50 images with top initial image-scores, Sim(MD ). To filter matches between ID and IQ , we compute a set of spatially consistent “inliers” for every match, (i, j, r) ∈ MD using the transformation between their affine shapes, H = A−1 i Aj . More precisely, inliers are matches where the distance of a query feature, projected by H, to its matching database feature is less than a spatial threshold, tsp . We
set this to 10% of ID ’s diagonal length. The largest set of inliers is used to estimate a final homography. Inliers with respect to this homography become the final set of correspondences, M�D . Applying the image scoring function Sim(M�D ) then determines the final, spatially-reranked image score.
3.5. Scoring of Labels Because we are interested in determining a query animal’s label and because there are typically multiple images associated with each label in the database, we must convert the scores for each image into scores for each label. The simplest, obvious version, which we refer to as image scoring, is to select the label of the highest scoring re-ranked image. A second method, building off intuitions from the Naive Bayes approach to category recognition [3, 14], combines the scores from all images with the same label. This score, which we refer to as label scoring, is computed in three steps: For each label, (a) aggregate match sets, M�D , over all reranked images with this label, (b) for each query descriptor, remove all but the best match, and (c) use the value of Sim applied to this new set as the score for this label.
4. One-Vs-Many Matching Our one-vs-many algorithm is described relative to the one-vs-one algorithm. These modifications give one-vsmany a logarithmic running time in the number of database descriptors. We achieve this by deriving a new matching algorithm for multi-image search from the Local Naive Bayes Nearest Neighbor (LNBNN) method [14].
4.1. Preprocessing For Faster Search Feature extraction is identical to one-vs-one, but computation of the efficient search data structure is very different. Unlike one-vs-one, no search data structure is computed for the query image. One-vs-many preprocessing computes one nearest neighbor data structure to index all database descriptors. This is a small forest of k-d trees [22]. We refer to the aggregate set of database descriptors as Dall .
4.2. Descriptor Matching and Match Scoring Similar to LNBNN [14] for each query image descriptor q ∈ DQ , the k + 1 approximate nearest neighbors, {d1 , d2 , ...dk+1 } ⊂ Dall are found by searching the forest of k-d trees. These are ordered by non-decreasing distance from q. Scores are computed for the first k of these (and added to their associated images) using the squared distance to the (k + 1)-th neighbor as a normalizer. Looking at this intuitively, if there were just one database image, then we would be in the same scenario as the one-vs-one matching, except with the roles of the query
and database images reversed, and our scoring mechanism should reflect this. On the other hand, in the usual case where there are many more than k database images, every query descriptor will only generate scores for (at most) k of them. Matches for database descriptors whose distances are beyond the k, just like matches whose ratio scores are below the ratio cut-off in one-vs-one matching, are considered non-distinct and (implicitly) given a score of 0. We present four scoring methods, using δ to denote the score instead of r (Equation 1): 1. Applying the measure from LNBNN [14] (modified to a maximization), we define: δLNBNN (q, dp , dk+1 ) = ||dk+1 −q||2 −||dp −q||2 (3) This is just the difference in distances between the pth and (k + 1)-th nearest neighbors. It tends towards 0 when the normalizing feature is numerically close to the matching feature (hence not distinct). 2. We generalize the ratio score in Section 3.2 to k nearest neighbors: δratio (q, dp , dk+1 ) =
||dk+1 − q||2 ||dp − q||2
(4)
Note that when k = 1, this is like the ratio test, but applied across all database images, not just one. 3. We introduce a log-ratio score to drive the previous score to 0 when the matches are non-distinct: δlnrat (q, dp , dk+1 ) = ln(
||dk+1 − q||2 ) ||dp − q||2
(5)
4. As a sanity check we use match counting: δcount (q, dp , dk+1 ) = 1
(6)
If q is the j-th query image descriptor and if the pth closest descriptor is at descriptor index i in its original database image, ID , then triple (i, j, δ(...)) is appended to the match set MD for ID . Overall, if there are M query image descriptors, then M k scores are generated and distributed across all database images. Once matching is complete, the initial image scoring (Sec. 3.3), spatial reranking (Sec. 3.4) and scoring of labels (Sec. 3.5) are all applied, just as in the one-vs-one algorithm.
4.3. Scaling to extremely large databases Our nearest neighbor methods are much simpler than the usual TF-IDF scoring mechanism used in large-scale instance recognition, avoiding the expensive off-line subcomputation of building the vocabulary and inverted-file structure [19]. If we can demonstrate that these are effective,
Species Grevy’s Plains Jaguars Giraffes Lionfish
Number of Images Labels 1047 592 824 86 45 21 45 15 13 5
Average Number of Descriptors per Image 837.6 403.6 2660.5 1418.3 1183.3
Table 1: Dataset statistics we will have taken a strong step toward a flexible, dynamic database. One drawback to our approach, however, is that each of the original descriptor vectors is stored in memory as opposed to quantized vectors. To address this problem, we investigate replacing our k-d tree indexing of database descriptor vectors with the product quantization technique introduced by J´egou et al. [10]. Product quantization is a method of computing approximate nearest neighbors by splitting a (descriptor) vector z = (z1 , z2 , . . . , zn ) into m subvectors (u1 , ..., um ), each of which is quantized individually with a relatively small, separate vocabulary. The trick is that the representation is very small, but the implicit vocabulary (number of distinct vectors) is enormous. We use m = 16 making each ui length 8, and quantize at 128 words per subvector. This structure represents 5 × 1033 distinct vectors and is 16 times smaller than the k-d tree forest representation. We explore the effects of this technique on match quality.
5. Experimental Results and Discussion All results were generated with MATLAB running on an i7-2600K 3.4GHz processor. We used the open source C implementations of kd-trees in VLFeat [25] and feature extraction from Perdoch [18]. We were provided with five datasets to test the HotSpotter algorithms. We thank the Rubenstein team in Kenya for the large Grevy’s and plains datasets as well as giraffes; Marcella Kelly for jaguars, and Juan David Gonz´alez Corredor for lionfish. Summaries of each are provided in Table 1, and examples of each are in Figure 2.
5.1. Data Sets Grevy’s zebras are an endangered species with a small but stable population ≈ 3, 000 [26]. They are characterized by a thin narrow stripe pattern, which produces many stable keypoints along the shoulder and rump, and sometimes flank. This dataset has been built from photos taken over several years and contains images of animals as both juveniles and adults, making it our most challenging set. Plains zebras are abundant and widespread. Having coarse and thick stripe patterns, they would seem to generate a comparatively low number of distinguishing markings for recognition, and indeed they generate the fewest keypoints / descriptors . Most images in this dataset were taken
within seconds of each other, however, leading to very little variation in either appearance or viewpoint. Jaguars, giraffes, and lionfish are smaller datasets used to test HotSpotter’s generalization to other species. The jaguar images were taken from camera traps, are of low image quality, and sometimes show variations in viewpoint. This difficulty is offset by a large number of distinguishing spots. Giraffes and lionfish, forming smaller datasets here, are primarily taken from the same viewpoint.
5.2. Experiments In every test configuration we take each database image with a known match and issued it as a query. (We take care to ignore-self matches; thus removing the need to reindex search structures.) Knowledge of the correct matches allows us to gather numerical results. (Interestingly, the software enabled us to catch and fix several ground-truthing errors.) Results of running various configurations of HotSpotter on the larger Grevy’s and plains zebras sets are summarized in Tables 2 and 3. The first three columns of each table summarize the algorithm configuration. Columns 4 and 5 give the number of queries for which the correct label is not the first label returned for label scoring (Column 4) and image scoring (Column 5) — see Sec. 3.5. This gives the overall accuracy of the system. Columns 6 and 7 give label scoring and image scoring for queries where the returned rank is above 5. This represents a “usability” measure since it is unlikely that a user will scan beyond the first five labels. Finally, the last column in the tables is the query time per image in seconds. Each row of Tables 2 and 3 gives a different algorithm configuration, with the primary variations being between the one-vs-one algorithm and the one-vs-many algorithm and, within the one-vs-many algorithm, the number of neighbors returned, the scoring function δ, and whether or not product quantization is used. In addition, the default is for 50 images to be reranked, so the notation +R0 and +RA in the first and last rows of the tables mean, respectively, that no images and all images are reranked. Finally, in all cases except those labeled +S, Root-SIFT descriptors are used. Results on the giraffes, leopard and lionfish datasets are provided in Table 4 in a much reduced form since these are easier and less extensive. The table includes a comparison to Wild-ID [4].
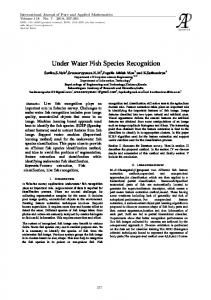
5.3. Results Overall, the results are quite strong. We achieve perfect results for the giraffe, jaguar, and lionfish datasets. On the Grevy’s data set, in the best configuration, HotSpotter produces correct top-ranked labels for 95% of the queries, and a top-five label for 98%. For the plains zebras dataset, these
Figure 2: Correct matches. The top images are queries and the bottom images are top results. Wild-ID failed on jaguar and lionfish examples.
Algorithm:
k
δ
1v1+R0 1v1
1 1
ratio ratio
Rank > 1 label image 33 25 26 24
1vM 1vM 1vM 1vM 1vM+PQ 1vM 1vM 1vM 1vM 1vM+PQ 1vM 1vM 1vM 1vM 1vM+PQ 1vM 1vM 1vM 1vM 1vM+PQ 1vM+S 1vM+S 1vM+R0 1vM+RA
1 1 1 1 1 5 5 5 5 5 10 10 10 10 10 20 20 20 20 20 1 1 1 1
ratio lnrat count LNBNN LNBNN ratio lnrat count LNBNN LNBNN ratio lnrat count LNBNN LNBNN ratio lnrat count LNBNN LNBNN lnrat LNBNN lnrat lnrat
33 32 27 40 152 37 34 32 39 41 38 33 32 39 43 38 32 32 38 43 33 40 34 32
36 34 28 47 173 34 33 36 41 49 35 33 36 41 51 36 31 36 41 51 35 45 36 34
Rank > 5 label image 11 8 6 7 8 6 7 8 92 5 5 7 4 13 6 4 8 4 14 6 5 8 6 15 6 7 7 6
5 5 9 9 92 6 5 7 5 13 6 5 7 5 16 6 5 7 6 16 7 7 5 5
TPQ (sec) 78.8 72.2
Algorithm:
k
δ
1v1+R0 1v1
1 1
ratio ratio
4.0 4.0 3.9 4.0 5.6 3.4 3.8 3.6 3.7 4.5 3.5 3.8 3.7 4.0 4.5 3.4 3.7 3.6 3.8 4.6 3.8 3.7 1.5 44.6
1vM 1vM 1vM 1vM 1vM+PQ 1vM 1vM 1vM 1vM 1vM+PQ 1vM 1vM 1vM 1vM 1vM+PQ 1vM 1vM 1vM 1vM 1vM+PQ 1vM+S 1vM+S 1vM+R0 1vM+RA
1 1 1 1 1 5 5 5 5 5 10 10 10 10 10 20 20 20 20 20 1 1 1 1
ratio lnrat count LNBNN LNBNN ratio lnrat count LNBNN LNBNN ratio lnrat count LNBNN LNBNN ratio lnrat count LNBNN LNBNN lnrat LNBNN lnrat lnrat
Table 2: Results on 657 Grevy’s queries and different algorithm configu-
rations. The notation for the first column of the table indicates one-vs-one (1v1) matching, one-vs-many (1vM) matching, product quantization (PQ), whether no images were reranked (R0), whether all were reranked (RA), and if original SIFT descriptors (S) are used in place of Root-SIFT. The column labeled k indicates the number of nearest neighbors scored for each query descriptor. The column labeled δ indicates the choice of match scoring function. The results are show in the right five columns, summarizing the label rankings for label scoring and image scoring, and giving the query time.
numbers are both well over 99%. More specific observations about the results are as follows: • One-vs-many is on par with one-vs-one matching, but many times faster.
Rank > 1 label image 9 5 7 4 6 7 6 6 25 7 5 8 6 7 7 7 8 7 7 7 7 8 7 7 7 6 7 6
2 4 3 5 29 3 3 4 3 7 3 3 4 3 7 3 3 4 5 6 4 6 5 4
Rank > 5 label image 5 3 3 3 3 2 2 1 15 3 2 3 2 3 3 3 3 2 2 3 3 3 3 2 3 2 4 3
2 1 2 1 15 2 2 2 2 4 2 2 2 2 3 2 2 2 2 3 2 2 3 2
TPQ (sec) 41.0 38.2 2.6 2.6 2.6 2.5 2.7 2.2 2.3 2.4 2.6 3.1 2.3 2.2 2.5 2.4 3.3 2.3 2.2 2.5 2.6 3.3 2.4 2.5 0.7 30.4
Table 3: Results on 819 plains zebras queries using the same notation at in Table 2.
• Product quantization rankings are substantially improved by increasing k from 1 to 5. We attribute this improvement to an increased k overcoming some of the effects of quantization; beyond k = 5 there is no improvement. For the other algorithms and configurations, setting k = 1, which is effectively a multi-image generalization of Lowe’s ratio test, works as well as any value of k. • The choice of scoring function δ does not make a substantial difference in the algorithm, and even the simple counting function works well.
Algorithm:
k
δ
Rank > 1 label image
Rank > 5 label image
TPQ (sec)
1v1+RA 1vM+RA Wild-ID
1 1 –
ratio ratio –
Dataset: Giraffes 1 0 1 0 – 4
1 0 –
0 0 1
3.3 1.1 0.5
1v1+RA 1vM+RA Wild-ID
1 1 –
ratio ratio –
Dataset: Jaguars 1 0 1 0 – 3
0 0 –
0 0 2
6.2 2.0 2.6
1v1+RA 1vM+RA Wild-ID
1 1 –
ratio ratio –
Dataset: Lionfish 0 0 0 0 – 1
0 0 –
0 0 0
0.7 0.7 1.5
Table 4: Results on giraffes, jaguars, and lionfish with 38, 35, and 13 queries, respectively.
• Numerically, the difference between label scoring and image scoring (Sec. 3.5 is minor, with small variations in either direction occurring with different algorithm configurations. Interestingly, it appears that one place label scoring does make a difference is matching images of foals as they grow and change toward adulthood. • Spatial reranking only marginally improves rankings, more so for the one-vs-one algorithm. • Unlike results reported in [1], Root-SIFT has no significant advantage over standard SIFT for our data sets. Combined, these observations suggest that the biggest reason for success is the shear number of matches from distinctive regions of an animal. The descriptors (“hotspots”) tend to be distinctive across many different animals, effectively creating a signature for that animal. This appears to be true for all five species that we experimented with. Even for the simple counting algorithm, the insensitivity to k is because the incorrect descriptor matches are uncorrelated across in the database. This slightly increases the noise in the scoring, but not enough to challenge the correct scores. As shown in Table 4, Wild-ID is faster than the onevs-one version of HotSpotter, but missed matches that HotSpotter finds. Two cases where Wild-ID fails are seen in Figure 2. Since Wild-ID is structurally similar to HotSpotter in its one-vs-one configuration, we attribute these successes primarily to the denser, affine-invariant keypoints and descriptors. Although Wild-ID is faster than one-vsone, this is largely due to it being multi-threaded and implemented in Java instead of MATLAB.
5.4. Failure Cases Further insight into HotSpotter can be gained through an analysis of failures. We closely analyzed the 34 Grevy’s
Figure 3: Three example failures. In the top example, the same back-
ground is seen (red matches) in two images showing different zebras. In the middle, the viewpoints are too different between the query image and the correct database image (green matches), and a different image is the top match. On the bottom, the poor illumination of the query image produces too few keypoints (small circles in the images) for correct matching.
queries which produce a rank greater than one for one-vsmany with k = 5 and δ = lnrat. In 2 cases the database contained a mislabeling, and in 5 cases the ROI covered two animals and matched the unlabeled animal. In 13 other cases, the background scenery was matched instead of the foreground zebra region. A classifier that weights a descriptor according to how likely it is to be a zebra should fix this problem. Of the remaining 14 cases, 8 failed because of substantial pose variations between query and database zebras, and the rest because of image quality, including focus, resolution and contrast. Examples are shown in Figure 3.
6. Conclusion We have presented HotSpotter, an algorithm for fast, reliable, multi-species animal identification based on extracting and matching keypoints and descriptors. In addition to the construction and testing of the overall system, the primary technical contribution of our work is the development of a fast and scalable one-vs-many scoring mechanism which outperforms current brute force one-vs-one image comparison methods in both speed and accuracy. The key to the success of HotSpotter is the use of viewpoint invariant descriptors and a scoring mechanism that emphasizes the most distinctiveness keypoints and descriptors by allowing only the k nearest neighbors of any descriptor to participate in the scoring. This has been borne out on experiments with Grevy’s zebras, plains zebras, giraffes, leopards and lionfish. From the perspective of the application, the failures are generally manageable through human interaction to eliminate problems due to (a) ROIs that overlap multiple animals, (b) matching against background, and (c) poor quality images. Additional algorithms could help identify and eliminate these problems as well. Other failures — those due to viewpoint variations — are the most difficult to handle. The best way to address this is to incorporate multiple images and viewpoints into the database for each animal. Looking toward future experimental work, we will apply the software to a wider variety of species, which will test the limit recognition based on distinctive feature matching. From the perspective of both the algorithm and the practical application, the next major step for HotSpotter is to build and manage a dynamically constructed database of animal images and labels. This is the focus of our ongoing effort.
References [1] R. Arandjelovic and A. Zisserman. Three things everyone should know to improve object retrieval. In CVPR, 2012. 3, 7 [2] Z. Arzoumanian, J. Holmberg, and B. Norman. An astronomical pattern-matching algorithm for computer-aided identification of whale sharks rhincodon typus. Journal of Applied Ecology, 2005. 1 [3] O. Boiman, E. Shechtman, and M. Irani. In defense of nearest-neighbor based image classification. In CVPR, 2008. 3, 4 [4] Bolger, Vance, Morrison, and Farid. Wild-id user guide: Pattern extraction and matching software for computer-assisted photographic mark-recapture analysis. http://software.dartmouth.edu/Macintosh/ Academic/Wild-ID_1.0.0.zip, 2011. 1, 2, 3, 5 [5] K. Bradfield. Photographic identification of individual archey’s frogs. In Science Internal Series, 2004. 1, 2 [6] Chum, Mikulik, Perd`och, and Matas. Total recall ii: Query expansion revisited. In CVPR, 2011. 3
[7] O. Chum, J. Matas, and S. Obdrzalek. Enhancing ransac by generalized model optimization. In ACCV, 2004. 3 [8] S. B. Elbin and J. Burger. In my experience: Implantable microchips for individual identification in wild and captive populations. In Wildlife Society Bulletin, 1994. 1 [9] H. J´egou, M. Douze, and C. Schmid. Improving bag-offeatures for large scale image search. IJCV, 2010. 3 [10] H. J´egou, M. Douze, and C. Schmid. Product quantization for nearest neighbor search. PAMI, 2011. 5 [11] M. Lahiri, C. Tantipathananandh, R. Warungu, D. Rubenstein, and T. Berger-Wolf. Biometric animal databases from field photographs: Identification of individual zebra in the wild. In ICMR, 2011. 1, 2 [12] S. Lazebnik, C. Schmid, and J. Ponce. Beyond bags of features: Spatial pyramid matching for recognizing natural scene categories. In CVPR, 2006. 3 [13] D. G. Lowe. Distinctive image features from scale-invariant keypoints. IJCV, 2004. 2, 3 [14] S. McCann and D. G. Lowe. Local naive bayes nearest neighbor for image classification. CVPR, 2011. 2, 3, 4 [15] K. Mikolajczyk, T. Tuytelaars, C. Schmid, A. Zisserman, J. Matas, F. Schaffalitzky, T. Kadir, and L. Gool. A comparison of affine region detectors. IJCV, 2005. 3 [16] T. Morrison and D. Bolger. Wet season range fidelity in a tropical migratory ungulate. Journal of Animal Ecology, 2012. 2 [17] D. Nister and H. Stewenius. Scalable recognition with a vocabulary tree. In CVPR, 2006. 3 [18] M. Perd`och, O. Chum, and J. Matas. Efficient representation of local geometry for large scale object retrieval. In CVPR, june 2009. 3, 5 [19] J. Philbin, O. Chum, M. Isard, J. Sivic, and A. Zisserman. Object retrieval with large vocabularies and fast spatial matching. In CVPR, 2007. 3, 4 [20] R. B. Sherley, T. Burghardt, P. J. Barham, and I. C. Cuthill. Computer vision monitoring of african penguins spheniscus demersus: New data on the field capacity from robben island. In IPC, 2010. 1 [21] B. Shorrocks and D. P. Croft. Necks and networks: a preliminary study of population structure in the reticulated giraffe (giraffa camelopardalis reticulata de winston). African Journal of Ecology, 2009. 1, 2 [22] C. Silpa-Anan and R. Hartley. Optimised kd-trees for fast image descriptor matching. In CVPR, 2008. 3, 4 [23] J. Sivic and A. Zisserman. Video google: a text retrieval approach to object matching in videos. In ICCV, 2003. 2, 3 [24] C. Speed, M. Meekan, and C. Bradshaw. Spot the match wildlife photo-identification using information theory. Frontiers in Zoology, 2007. 1, 2 [25] A. Vedaldi and B. Fulkerson. Vlfeat: an open and portable library of computer vision algorithms. In MMM, 2010. 3, 5 [26] S. Williams. Status and action plan for the grevy’s zebra (equus grevyi). Equids: Zebras, Asses, and Horses, 2002. 5 [27] P. Zhang, C. M. Sadler, S. A. Lyon, and M. Martonosi. Hardware design experiences in zebranet. In Embedded networked sensor systems. ACM, 2004. 1