for planning activities and large-scale energy pre-certification purposes. ⢠Building ..... 3D graphics API based on OpenGL ES 2.0, exposed through the HTML5.
Hybrid approach for large-scale Energy Performance estimation based on 3D city model data and typological classification Federico Prandi1, Umberto Di Staso1, Marco Berti1, Luca Giovannini2, Piergiorgio Cipriano2, Raffaele De Amicis1 1 2
Fondazione Graphitech, Via alla Cascata 56/c, Trento (TN) Italy Sinergis Srl, Via del Lavoro 71, Casalecchio di Reno (BO) Italy
Abstract. This paper illustrates the results of a research project focused on the development of a Web 2.0 system designed to compute and visualize building energy performance large-scale maps. The workflow and the framework include: emerging platform-independent technologies such as WebGL for data presentation, an extended version of the EU-Founded project TABULA/EPISCOPE for building energy parameters estimation and a data model based on CityGML OGC standard. The proposed platform will allow citizens, public administrations and government agencies to perform city-wide analyses on the energy performance of building stocks. To evaluate the accuracy of the model, the simulation results were compared to real data of energy performance of the energy certificates available and the model uncertainties were analysed. Keywords. CityGML, WebGL, Energy Maps, TABULA, EPISCOPE, Web 2.0, GeoVisual Analytics.
1.
Introduction
“Smart-cities” is certainly one of the current hottest topics in the information technology research area. Many definitions exist in current literature (Bowerman, et al. 2000), (Fenger, 1999), (Giffinger, 2007), (Giffinger, et al., 2010), (Washburn, et al., 2009) and all of them have a factor in common: the existence of an underlying ICT infrastructure that connects the physical infrastructure of the city with web 2.0 capabilities enabling innovative solutions for city management, in order to improve sustainability and the quality of life for citizens.
Urban metropolises, despite covering only 2%, of the Earth’s surface are the lead contributors of greenhouse gas production accountable for around 80% of the oil, gas and coal world consumption. Therefore, energy consumption efficiency of residential houses is an important factor having impact on the overall city ecosystem and quality of life and it would greatly benefit from an ICT-enabled smart approach. In fact, increasing building energy efficiency would not only mean a cut-down in energy expense for citizens, but would also have an impact on the overall production of CO2 at energy plants and also, even if less intuitively, on the city air pollution. In this context, 3D city modelling can be an essential tool (Prandi et al.2014) for energy planners and municipality managers, enabling them to perform accurate diagnostics of the existing building stock, and to plan lowcarbon urban energy strategies. Indeed on top of that several smart services can be designed in order to support the increase of building energy efficiency and improve the city quality of life. The paper will illustrate the concept and the development of smart services, which allow the assessment of the energy performance of all the residential buildings stock in a city, its validation and the easiest visualization in a format accessible to citizens and urban planning experts alike. The development of these services is part of the scope of the SUNSHINE (2013) project (Smart UrbaN ServIces for Higher eNergy Efficiency, www.sunshineproject.eu), that aims at delivering innovative digital services, interoperable with existing geographic web-service infrastructures, supporting improved energy efficiency at the urban and building level. SUNSHINE smart services will be delivered from both a web-based client and dedicated apps for smartphones and tablets. The project is structured into three main scenarios: •
Building Energy Performance Assessment: Automatic large-scale assessment of building energy behavior based on data available from public repositories (e.g. cadaster, planning data etc.). The information on energy performances is used to create urban-scale maps to be used for planning activities and large-scale energy pre-certification purposes.
•
Building Energy Consumption Optimization: Having access via interoperable web-services to real-time consumption data measured by smart-meters and to localized weather forecasts, it is possible to optimize the energy consumption of heating systems via automatic alerts that will be sent by the SUNSHINE app to the final users.
•
Public Lighting Energy Management: Interoperable control of public illumination systems based on remote access to lighting network facilities via interoperable standards enables an optimized management
of energy consumption from a web-based client as well as via the SUNSHINE app. The work focuses on the preliminary results for the Building Energy Performance Assessment. The aim is to evaluate the accuracy and strength of a new approach that automatically calculates the heating demand of whole district areas, modelled in 3D. The service provides an automatic largescale assessment of building energy behaviour and the visualization of the results using the so called Energy maps which will be made publicly available via a 3D virtual globe interface based on WebGL (Marrin 2011). The presentation of the energy maps in a 3D spatial-geographic framework, leveraging on interoperable OGC standards, allows citizens, public administrations and government agencies to evaluate and perform analysis on the building energy performance data, and provides a global perspective on the overall performance conditions of the residential building stock as well as on its fluctuations on the neighbourhood and block scale. The SUNSHINE methodology is first designed and tested on the SUNSHINE pilot cities. The influence of the input data, not the same in all cities and regions, is studied. Then, the accuracy of the model is investigated, comparing the simulated energy performance of buildings with information data contained within energy certificates. 1.1. State of the Art The current availability of relevant technologies and standards has encouraged the development of many research projects in the area of building energy performance estimation based on publicly available data with the aim of creating energy map. Virtual 3D city models, storing geometrical and semantic data of whole cities, have given a strong input in this context. An example is described in (Nouvel, et al. 2013), where the City Geography Markup Language (CityGML) standard (Gröger, et al. 2012) is used to semantically describe the set of objects that compose the urban environment, a building typology database is exploited to statistically estimate the energy performance properties of buildings and, finally, an Application Domain Extensions (ADE) to the CityGML model is defined to store the estimated information for each building. Some further examples of urban energy analysis based on virtual 3D city model have been realised at local scale for some city districts like in Berlin (Carriòn et al. 2010, Kaden et al. 2013). The main challenge is however the quality of the data effectively provided for the whole city area. These are very variable, depending on the available
public database (provided generally by the municipality), and the information data collected onsite. For example, building certificates, adopted by many of EU countries to describe building efficiency, can provide a very detailed insight on building energy properties, but on the other hand, these certifications are not mandatory for all the residential buildings and their availability is thus very sparse. Moreover, as they rely mostly on non-standardised data structures, they are with difficulty extensible to other cities or regions. Typically publicly available data generally do not include all the information needed for the energy performance calculation, so one of the most common approaches to energy map creation is to estimate the missing information in a reliable way, using the basic input data that is typically available, such as building geometry, building use, construction year, climatic zone, etc. For the estimation of some of these parameters building typology libraries are essential. These libraries can exist at a national level (e.g. in Germany: IWU, 2003) or in the different European countries as outcomes of some EU initiatives (Project TABULA, 2012) (Ballarini et. al. 2012). These approach, having to rely on typological databases to estimate the most of the energy parameters, yields a result that is typically not very statistically reliable at the building scale and is usually confined to residential buildings (where performance typologies are easier to define). Moreover, the overall software architecture is typically desktop based, so the access to the results is often limited to a small number of users with advanced GIS skills. Another limit is related to the dissemination and exploitation activities of the computed results: for performance reasons, the visualization is commonly provided via a conversion to KML, where the link between the building performance data and its geometry is color-coded in each buildingstyle parameter and the other information stored in the starting CityGML file is lost. The proposed approach belongs to the typological one, but makes an effort to reduce the common drawbacks that have been delineated. As will be described in more details in the following sections, our approach is in effect hybrid, leveraging on the outcomes of project TABULA-EPISCOPE but limiting the use of building parameters estimated typologically.
2.
SUNSHINE approach
2.1. Energy performance map calculation The energy performance of a building is usually computed from a series of detailed information on building energy properties that are not available in general as public domain data. Publicly available data is usually limited to more basic information, such as building geometry, year of construction, number of building sub-units, etc. The energy performance estimation approach developed in SUNSHINE is hybrid; it uses a deterministic approach for the geometrical properties, measured or computed, of the involved buildings and, a typological approach only for the estimation of the thermo-physical properties. A fully typological approach has in fact the intrinsic limitation that the statistical significance of the performance estimation directly proportional to the scale at which the approach is applied, so very low at the scale of the single building. A hybrid approach that takes into account the real geometrical properties of the building makes the estimate of the building energy performance more accurate. More specifically, the data necessary to the estimation are: •
Geometrical data: i.e. footprint, height, number of floors, etc. From these data, using specific geoprocessing procedures, other geometrical properties are derived, such as the building volume of the extent or the building wall surfaces shared with neighboring buildings.
•
Thermo-physical data: i.e. period of construction, prevalent building use, refurbishment level. From these data, using a typological approach and leveraging on a sample of representative buildings for the different thermo-physical typologies, the thermal properties of each building are estimated, such as U-values of envelope elements and the percentage of windowed surface.
•
Climatic data: i.e. the extent of the heating season and the average external temperatures. These data are derived from national and local directives.
The energy performance calculation is based on a simplified computation procedure based on ISO 13790 and ISO 15316 (international standard protocols for the energy sector). This, uses the geometrical, thermo-physical and climatic data to compute the following parameters are for each residential building: •
The energy need for heating;
•
The energy need for heating and domestic hot water;
•
The corresponding index for energy performance.
There are some considerations to highlight about this approach. The first is related to the fact that the building typological classification currently applies to residential buildings only and thus cannot be used to assess the energy performance of buildings with a predominant use that is other than residential (commercial, administrative, industrial, educational, etc). As a consequence, the energy map itself will carry information only for residential buildings. This seems to us a reasonable compromise as residential buildings are among the major causes for energy consumption and air pollution (Fenger 1999). A second important aspect is the use of thermo-physical typologies in order to estimate building properties that would be otherwise hardly obtainable on a large scale without employing a great deal of resources (money and time) and whose knowledge is instead necessary to determine an estimate of energy performance. The definition of these typologies is based on the results of project TABULA, integrated and extended to adapt to the specificities of SUNSHINE. Project TABULA defined a set of building typologies for each of the countries participating into the project, basing on 4 parameters: country, climate zone, building construction year, building size type (i.e. single family house, terraced house, apartment block, etc). A building stereotype, described in all its geometrical and thermo-physical properties, is associated to each class, with the aim of representing the average energy behavior for buildings of that class. So, if the 4 parameters are known, than it is possible to associate the building to a specific typology class and thus to its estimated energy performance class. A workflow for the automatic process for large-scale building energy performance estimation, has been implemented by using the following software: • •
A relational database with spatial extension, where an input shapefile, structured in accordance with the input data model (i.e. Postreges/postGIS). An ETL tool for manipulating spatial data (i.e. GeoKettle, FME).
The logical structure of the workflow is the follow: 1. The workflow starts initializing the system;
2. For each building, all the data gathered in the input data model is used and, in addition, additional geometries parameters are computed such as area, perimeter, shared and exposed walls perimeter; 3. The building typology, according to the categories provided by TABULA, is estimated with the algorithm described in Figure 1. 4. Using the previous estimated parameters, it is possible to query the TABULA database in order to obtain the set of U_VALUES in accordance with the climatic zone, typology, construction year and refurbishment level; 5. Having the set of U_VALUES and the real geometry proprieties it will be possible to estimate the Energy Performance Index (EPI) according with the EN ISO 13790 regulation. 6. An output shapefile extending the input data model with the new geometrical and thermo-physical data is produced. More details regarding the output data model will be provided in the next section.
Figure 1 Building type estimation
The procedure implemented, is represented in the following image.
Figure 2 ETL energy maps generation workflow
2.2. Input and Output data model To ensure the extendibility of the energy performance calculation developed during the project across different EU countries and regions, which have different input data sources and building characteristics, it is needed to define an input data model in order to harmonize the possible different data sources. The OGC Standard CityGML (Groeger et al., 2012) has been selected for the modelling of 3D building data. An advantage of CityGML compared to other 3D city model formats is its spatio-semantic model, which allows modelling even the specific semantic characteristics of the spatial features. However the CityGML language core does not provide explicit attributes for modelling energy consumption of buildings, utility infrastructure distribution and capacities, and transmission coefficient. For this reason, an extension of the data model by energy specific contents is required, in order to allow inventorying, classifying, mapping and analytical processing of energy related values with strong reference to the related city object. Thus, the CityGML core needs to be extended by an Energy ADE. One goal of SUNSHINE is, together with other research groups, the definition of a coordinated and harmonized version of an Energy ADE. A working group, which is led by the Modeling Working Group of the Special Interest Group 3D
(SIG 3D 2014), has been created for this purpose. Due to the fact that a final version of the Energy ADE is not yet available, a simplified data model designed based on the ADE draft version has been used to model the workflow’s output. Table 1 Energy maps output data model Attribute Name
Type
Building identifier
string
Building geometry
geometry
Begin construction year
integer
End construction year
integer
Building height Floors
real integer
Average floor height
real
Refurbishment level
{no/standard/adv}
Use
string
Area
real
Perimeter
real
Shared perimeter wall
real
Exposed perimeter wall
real
U_roof
real
U_floor
real
P_win
real
U_wall
real
U_win
real
EPI
real
EPGL
real
CRS
string
Delta_U_bridge
real
Building_typology
int
Heating_days
int
Pilot_id
int
Irradiation
real
Climatic_zone_id
int
To test and validate the conceptual idea explained in the previous section, a set of data related to the buildings in the pilot urban scenarios of the cities of Trento and Cles, Italy, has been collected and the SUNSHINE energy map estimation workflow has been executed on it.
3.
Analysis of results
3.1. Energy map validation Estimated energy performances, for residential building built after 1900 in the urban environment of Trento and Cles, has been validated comparing the obtained results with real energy certifications. The logical validation process was composed by several phases with some issues to solve. Table 2 Logical validation processes and related issues Phase Building choice Outputs from SUNSHINE
Statistical elaborations
Issue Thermal zone Misalignments between stored data and real data, in particular the refurbishment level Deegree of acceptability
General consideration: the SUNSHINE Workflow provides estimation based on the whole building geometry while energy certifications are based on thermal-zone and, the apartment position (ground floor/middle floor/last floor) influences the heat loss. Through the SUNSHINE web portal, the user is able to analyse – in a local mode - the thermal situation taking into account the aforementioned general consideration. For this reason, the energy performance estimation workflow is refined as follows and performed for the three mentioned conditions. According by EN ISO 13790:
𝑄𝑄H,nd = 0,024 ∙ �𝑄𝑄H,tr + 𝑄𝑄H,ve � ∙ t − ηH,gn ∙ (𝑄𝑄𝑖𝑖𝑖𝑖𝑖𝑖 + 𝑄𝑄sol )
(1)
𝐻𝐻𝑡𝑡𝑡𝑡,adj = ∑�𝛼𝛼𝑖𝑖 ∙ 𝐴𝐴𝑒𝑒𝑒𝑒𝑒𝑒,𝑖𝑖 ∙ 𝑈𝑈𝑒𝑒𝑒𝑒𝑒𝑒,𝑖𝑖 ∙ 𝑏𝑏𝑡𝑡𝑡𝑡,𝑖𝑖 � + ΔU𝑡𝑡𝑡𝑡 ∙ ∑(𝛼𝛼𝑖𝑖 ∙ 𝐴𝐴𝑒𝑒𝑒𝑒𝑒𝑒,𝑖𝑖 )
(3)
𝑄𝑄H,tr = 𝐻𝐻𝑡𝑡𝑡𝑡,adj ∙ (𝜃𝜃𝑖𝑖 − 𝜃𝜃𝑒𝑒 )
With:
(2)
αi = 1 for walls and windows; αi = {0,1} for roof or floor;
In particular:
α𝑤𝑤ℎ𝑜𝑜𝑜𝑜𝑜𝑜 𝑏𝑏𝑏𝑏𝑏𝑏𝑏𝑏𝑏𝑏𝑏𝑏𝑏𝑏𝑏𝑏,𝑖𝑖 = 1 for all elements; α𝑔𝑔𝑔𝑔𝑔𝑔𝑔𝑔𝑔𝑔𝑔𝑔 𝑓𝑓𝑓𝑓𝑓𝑓𝑓𝑓𝑓𝑓,𝑖𝑖 = 1 for {walls, windows, floor}; α𝑔𝑔𝑔𝑔𝑔𝑔𝑔𝑔𝑔𝑔𝑔𝑔 𝑓𝑓𝑓𝑓𝑓𝑓𝑓𝑓𝑓𝑓,𝑖𝑖 = 0 for roof; α𝑚𝑚𝑚𝑚𝑚𝑚𝑚𝑚𝑚𝑚𝑚𝑚 𝑓𝑓𝑓𝑓𝑓𝑓𝑓𝑓𝑟𝑟,𝑖𝑖 = 1 for {walls, windows}; α𝑚𝑚𝑚𝑚𝑚𝑚𝑚𝑚𝑚𝑚𝑚𝑚 𝑓𝑓𝑓𝑓𝑓𝑓𝑓𝑓𝑓𝑓,𝑖𝑖 = 0 for {floor, roof}; α𝑙𝑙𝑙𝑙𝑙𝑙𝑙𝑙 𝑓𝑓𝑓𝑓𝑓𝑓𝑓𝑓𝑓𝑓,𝑖𝑖 = 1 for {walls, windows, roof}; α𝑙𝑙𝑙𝑙𝑙𝑙𝑙𝑙 𝑓𝑓𝑓𝑓𝑓𝑓𝑓𝑓𝑓𝑓,𝑖𝑖 = 0 for floor;
In the first version of validation process (Giovannini 2014), the simulation was performed for each of the three available apartment-position possibility (ground/middle/last floor) and outputs compared with the real value. The main problem related with the previous approach is that thermal-zone placements was originally unknown. In order to create a validation with the least number of uncertainties, the mode has been modified. In the new validation approach the main parameter used is the S/V rate, where S - expressed in m2 - is area delimits indoor building from outside and V - expressed in m3 - is the heated volume. Selected buildings for the validation process are the one that have similar S/V value compared with real S/V. The second phase concerns the acquisition of outputs from the SUNSHINE web portal for the selected buildings. Here the first issue to solve is related to the building construction year: several time it was identified a misalignment between SUNSHINE data and real certifications. For the model structure, this influences the thermal properties and so the final EPI value. Another important aspect regards the unknown refurbishment level and in particular way which external building envelope part was improved. In order to solve these issues, the platform provides the possibility to update these data, and compute an updated analysis for the selected thermal zone. For the validation, SUNSHINE data of age are checked with real one and eventually changed locally. Table 3 reports a subset of the whole set of buildings involved in the urban environment where the following information is reported:
•
Building typology, in according with the TABULA classification;
•
City (TN/CL);
•
Real Construction year;
•
S/V rate difference between real and SUNSHINE data;
•
Real EPI [KWh/(m2 year)]: energy performance index provided by real certificates;
•
Estimated EPI – whole building [KWh/(m2 year)];
•
Difference between real and estimated EPi.
•
Absolute difference between real and estimated EPi.
Table 3 Validation Results ID
City
Year
∆ (S/V)
Real EPi
Est. EPi
∆ EPi
∆ EPi (%)
Building 1
TN
2013
0,015
35,44
49,88
14,44
41
Building 2
TN
1999
0,02
106,02
109,8
3,78
4
Building 3
TN
1960
0,041
54,8
45,61
9,19
17
Building 4
TN
1925
0,068
55,5
45,45
10,05
18
Building 5
TN
1992
0,059
73,4
61,64
11,76
16
Building 6
TN
1996
0
88,6
63,1
25,5
29
Building 7
TN
2002
0,047
14,94
39,8
24,86
166
Building 8
TN
2007
0,082
42,77
37,11
5,66
13
Building 9
TN
2002
0,096
124,4
80,5
43,9
35
Building 10
TN
1970
0,029
66,62
38,17
28,45
43
Building 11
TN
1962
0,054
75,23
75,97
0,74
1
Building 12
TN
2007
0,093
67,57
61,57
6
9
Building 13
CL
2011
0,035
32,57
61,72
29,15
89
Building 14
CL
2001
0,082
41,63
37,28
4,35
10
Building 15
CL
1960
0,094
62,2
42,79
19,41
31
Building 16
CL
1980
0,081
116,08
111,6
4,48
4
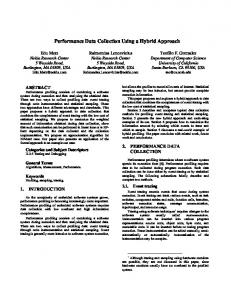
Figure 3 reports the comparison of real (blue bars) and estimated (red bar) data on the whole dataset.
Figure 3 Difference between estimated and real EPIs
In the third phase we set up acceptability scale for the model. Looking at outputs, it is clear the impossibility to refer to the absolute difference between EPI and neither to percentage difference, because all depends on the baseline value, as it is refer in next table. Table 3 Samples of some result Real Epi
Epi SUNSHINE
Absolute difference (KWh/m^2 year)
Percentage difference
362,01
287,98
74,03
20
95,61
76,72
18,89
20
90,3
56
34,3
38
34,02
70,04
36,02
106
The solution was to use a mixed scale. It should be considered that different software used to calculate the energy performance index produces similar results. These differences are variable and can reach up to 20%, with an absolute difference between 20 ÷ 30 KWh/(m2 year). The final acceptability scale is reported in following table. ∆EPi < 20% ∆EPi > 20% and ∆EPi < 25 KWh/m2a ∆EPi > 20% and 25 KWh/m2a < ∆EPi < 40 KWh/m2a ∆EPi > 20% and ∆EPi > 40 KWh/m2a
The model is acceptable if the average difference scale was in one of the first two classes.
The following diagram represents the results in a pie chart. As it is possible to see, the average error between estimated and real data is near the 22 KWh/(m2 year) and the percentage difference near to 30%.
Figure 4 Acceptability classes
3.2.
Energy Map Visualization
The final data model selected to host the 3D buildings and their data is CityGML at the LoD-1 level of detail that will be extended with a new Application Domain Extension (ADE) defined with the aim of describing the properties of the buildings in the energy domain. Previous works already provided the visual representation of these outcomes in 3D GIS environment allowing more intuitive understanding of the building stock energy performance. However these systems was limited to specific GIS desktop tools or in such case in intranet client/server infrastructure. In the new smart-city paradigm all the involved stakeholders (citizens, public administrations and government agencies) should be aware about the outcomes of the research and development activities and rely on that in order to provide feedback and take decision. For this reason, a paradigm shift on the client platform to access the information is fundamental. The system should be usable by the majority of users via web so a great effort was put in designing and implementing, both mobile and desktop-based SUSNHINE web-client. To achieve the widest dissemination possible for the project’s results, the emerging WebGL technology (Marrin, 2011) has been employed, in conjunction with HTML5 elements, as the main component of the application layer. WebGL is a cross-platform royalty-free web standard for a low-level
3D graphics API based on OpenGL ES 2.0, exposed through the HTML5 Canvas element as Document Object Model interface. Energy maps are generated merging geometry LOD-1 information from the CityGML of the displayed city with the output of the energy performance estimation procedure; however CityGML is designed to represent 3D city models, but not to present or visualise 3D city models directly (Soave et al, 2013). In order to overcome this lack we proposes an approach to provide 3D geographic information via web. The service is based on providing the geometrical information using a format more suitable for 3D visualization (i.e. KML) and the related semantic information using a WFS services. The reference between each building feature in KML file and the corresponding building in 3D CityDB is ensured by storing the unique GML UUID of the building in the KML polygon name property. By the use of a WFS web service it will then be possible to retrieve the energy-related parameters corresponding to the selected object and stored as semantic features of the CityGML.
Figure 5 Energy map visualization
Three interconnected parts compose the energy map visualizer 1. An HTML5 canvas that displays the WebGL virtual globe in which KML energy maps, based on CityGML LOD-1 geometries, are loaded; 2. A classical HTML tab, displaying overall statistics for the selected ecomap. By the use of this interface, the user can estimate how many buildings belongs to a specific Energy Performance Index range, the total emission of CO2 etc.; 3. A HTML console to refine the energy performance calculation for the selected building acting on the input data such as year of construction, refurbishment level or U values. This increase the energy performance index estimation accuracy also providing some information for the apartment-level estimation (position of the apartment: ground, middle, last: already discussed in the previous chapter)
4.
Conclusions and future works
In this paper we have presented some of the results of the SUNSHINE project. 3D city models combined to reliable TABULA building typology database offer a good base for large-scale energy performance estimation. Correctness of results is strongly influenced by the quality of input data. a reasonable energy performance estimation error of around 20÷25 KWh/(m2 year). For us the model is valid, and the possibility for the user to recreate a local simulation was a basic instrument. Future improvements will be focused on refurbishment in order to separate the different element and year of restructuring; in this way it will be possible improve the estimation quality.
Figure 6 Building Analysis and Simulation Tool
Building energy performance assessment using 3D city models offers opportunities to simulate energy scenarios, that could support municipal managers in the development of long-term urban energy strategies. Accurate data collection to retrieve missing input data and to validate the existing ones are the major challenges for the 3D city model use. Several approaches including crowd sourcing could be exploited in order to reduce time and costs of these data collection and validation. Moreover, the use of the emerging WebGL technology ensures the largest available audience in terms of devices, both desktop and mobile, avoiding
the development of device-dependent custom clients for 3D city map visualization. Future improvements will be focused on increasing the quality of the geometry displayed, making it possible to render buildings based on CityGML LoD-2 level of detail and on the development of more detailed building typologies estimation procedures.
Acknowledgements The project SUNSHINE has received funding from the EC, and it has been co-funded by the CIP-Pilot actions as part of the Competitiveness and innovation Framework Programme. The authors are solely responsible of this work, which does not represent the opinion of the EC. The EC is not responsible for any use that might be made of information contained in this paper.
References Ballarini I., Corgnati S., P., Corrado V., Talà N., 2012 et al. Definition of building typologies for energy investigations on residential sector by TABULA IEE-project: application to Italian case studies. Proceedings of the 12th. International Conference on Air Distribution in Rooms, Trondheim, Norway, p. 19-22 (2012) Bowerman, B., Braverman, J., Taylor, J., Todosow, H., Von Wimmersperg, U. 2000. The vision of a smart city. 2nd International Life Extension Technology Workshop, Paris (2000) Carrión D., Lorenz A., Kolbe T. H. 2010 Estimation of the energetic rehabilitation state of buildings for the city of Berlin using a 3D city model represented in CityGML. ISPRS international conference on 3D Geoinformation, p. 4 (2010) Fenger, J. Urban air quality. Atmospheric environment, 33.29: 4877-4900 (1999) Giffinger, R. 2007. Smart cities: Ranking of European medium-sized cities. Final report, Centre of Regional Science, Vienna UT (2007) Giffinger, R., Gudrun, H. 2010. Smart cities ranking: an effective instrument for the positioning of the cities? ACE: Architecture, City and Environment, vol. 4, num. 12, p. 7-26 (2010) Groeger, G., Kolbe, T.H., Nagel, C., Häfele, K.H 2012. OGC City Geography Markup Language (CityGML) En-coding Standard. OGC Doc. No. OGC 12-019.
Kaden, R., Kolbe T. 2013. City-wide total energy demand estimation of buildings using semantic 3D city models and statistical data. ISPRS Annals of the Photogrammetry, Remote Sensing and Spatial Information Sciences, Volume II-2/W1 (2013) Marrin, C. 2011. WebGL specification. Khronos WebGL Working Group (2011) Nouvel R., Schulte C, Eicker U., Pietruschka D., Coors V. 2013 CityGML-based 3D city model for energy diagnostics and urban energy policy support. Proceedings of BS2013, 13th Conference of International Building Performance Simulation Association, Chambéry, France (2013) Prandi, F., Soave, M., Devigili, F., Andreolli, M., De Amicis, R. 2014. Services Oriented Smart City Platform Based On 3d City Model Visualization. ISPRS Annals of Photogrammetry, Remote Sensing and Spatial Information Sciences, 1, 59-64. Soave M., Devigili F., Prandi F., and De Amicis R., 2013. Visualization and analysis of CityGML dataset within a client sever infrastructure. In Proceedings of the 18th International Conference on 3D Web Technology (Web3D '13). ACM, New York, NY, USA, 215215. DOI=10.1145/2466533.2466573 http://doi.acm.org/10.1145/2466533.2466573 Special Interest Group 3D, http://www.sig3d.org/index.php?&language=en SUNSHINE Project, Smart UrbaN ServIces for Higher eNergy Efficiency. 2013 – 2016. Website (January2015): http://www.sunshineproject.eu/ Washburn, D., Sindhu, U. 2009. Helping CIOs Understand “Smart City” Initiatives. Report by Forrester Research, Inc (2009) Giovannini, L., Pezzi, S., Di Staso, U., and Prandi, F., 2014. Large-scale Assessment and Visualization of the Energy Performance of Buildings with Ecomaps. Proceedings of DATA 2014, Wien, Austria (2014)