Center for Environmental Applications of Remote Sensing. Departments of .... comprised of compiler directives and function calls (Jordan and Alaghband, 2003).
Hybrid Image Classification Using a Shared Memory Parallel Algorithm Rhonda D. Phillips, Layne T. Watson, Randolph H. Wynne Center for Environmental Applications of Remote Sensing Departments of Computer Science, Mathematics, and Forestry Virginia Polytechnic Institute and State University Blacksburg, VA 24061 Abstract Although the processing speeds of personal computers have increased dramatically during the past few years, the newer, faster computers cannot keep pace with the size increases in remote sensing datasets due to higher resolution sensors, larger study regions, and the like. A single workstation may not be sufficient to process these large datasets, but there are increasingly more powerful parallel computers available for use within the scientific community. To facilitate the transition to parallel processing from serial processing, this work modifies the iterative guided spectral class rejection (IGSCR) classification algorithm for implementation on a parallel platform. The code utilizes the data format HDF5 (Hierarchical Data Format, version 5) and data access library to simplify data access while maintaining storage and input/output efficiency, even for parallel access. This work uses the shared memory parallel programming paradigm, and the Fortran 95 language with OpenMP directives. Results are given for the SGI Altix 3300 shared memory computer with as many as 12 processors to demonstrate parallel speedup.
Introduction As remote sensing datasets continue to increase in size, there is a demonstrated need for faster computing resources to decrease processing time. Furthermore, when dealing with certain classification algorithms, more accurate results may be obtained by using slightly different input parameters. A significantly faster (parallel) implementation of these classification algorithms would allow an analyst to make several runs using different parameters in the equivalent time required to make one serial run, potentially producing more accurate classification results. Although there are increasingly more parallel computers available to the research community, porting existing serial applications to a parallel environment is usually nontrivial. This paper discusses specific changes that are made to the IGSCR classification algorithm to produce a shared memory parallel algorithm. A further goal of this implementation is to create source code that is both portable and open source. The final parallel IGSCR code runs on multiple hardware platforms and operating systems, and it does not have the same “black box” that is associated with commercial software libraries. The sections of this paper contain background information, a description of classification algorithms that are used, a description of the HDF data files, a description of the parallel classification algorithms, parallel results and discussion, and a conclusion of the paper.
Background IGSCR Historically, there have been two types of classification, supervised and unsupervised. In supervised classification, a user must identify exhaustive spectral classes within the image and assign each spectral class to only one informational class (informational classes are pre-defined prior to classification). The process of identifying spectral classes that encompass all land-cover types in the image and map to exactly one informational class is both laborious and error-prone (Campbell, 1996). Another approach is to perform unsupervised classification where spectral classes are automatically created based on homogeneous spectral properties inherent in the data. This may result in better spectral classes; however, this process is still analyst intensive because the analyst must place the resulting spectral classes into informational classes, which may be nontrivial (Campbell, 1996). There have been several attempts to incorporate the two above methods into a hybrid approach, combining the more accurate automated spectral class creation with the user input training data based on a priori knowledge of the landscape (Richards, 1999). One of these hybrid Pecora 16 “Global Priorities in Land Remote Sensing” October 23 – 27, 2005 * Sioux Falls, South Dakota
methods is guided clustering, where a user selects training data to represent pre-defined informational classes, applies an unsupervised classification to each informational class to obtain spectral classes, and uses the resulting spectral class signatures to perform a supervised classification (Bauer et al., 1994). This method is advantageous because accurate results are produced while allowing for a greater amount of automation (Bauer et al., 1994). This method cannot be entirely automated, however, as user interaction is required after the training process to oversee spectral class creation and refine parameters. In some cases, it may be necessary to restart the algorithm and modify training data. A method more disposed to automation is the IGSCR classification method. IGSCR requires an analyst to input training data for each informational class, an unsupervised classification is performed on the image, and informational class homogeneity of each resulting spectral class is determined based on the training data. This process of rejecting spectral classes that contain more than one informational class was first presented by Jensen et al. (1987). IGSCR has proven to be both accurate and ideal for automation, as no user intervention is required after the initial training phase (Wayman et al., 2001). Furthermore, IGSCR was shown to exceed precision standards for the area estimation for the USDA Forest Service Forest Inventory and Analysis (FIA) (Musy, 2003). It was used recently for a study on Sudden Oak Death where Kelly et al. (2004) demonstrated that the IGSCR hybrid classification method outperformed both supervised and unsupervised methods alone. Automation. In 2003, IGSCR was implemented using ERDAS Imagine’s C Toolkit and Macro Language (ERDAS, 1999) with the C language (Musy 2003). The supervised classification algorithm in this implementation is maximum likelihood (Richards, 1999) and the unsupervised classification algorithm is ISODATA (Ball and Hall, 1965). Both of these algorithms are contained in the proprietary ERDAS Imagine software library.
Parallel Computing The first distributed memory parallel computers were both expensive and difficult to use, making them inaccessible to the general scientific community, although vector parallel computers (CDC and Cray) quickly became the norm in scientific computing (Quinn, 2004). The emergence of commodity clusters has reduced the startup cost required to build a very powerful computer containing thousands of processors. Even specialized shared memory multi computers containing a modest number of processors have become a viable, affordable option for scientific researchers. To coincide with more publicly available hardware solutions, two software solutions have emerged as standards for programming on their respective architectures. MPI (Message Passing Interface) is a standard describing directives that extend an already existing programming language such as C or Fortran (Snir et al., 1996). MPI is the protocol of choice for a distributed memory parallel computer because communication between processors using MPI is done explicitly. For shared memory programming, OpenMP is the standard that is commonly used (Jordan and Alaghband, 2003). OpenMP uses a fork/join model of parallelization and is an extension to an existing programming language comprised of compiler directives and function calls (Jordan and Alaghband, 2003). OpenMP directives are formed such that the underlying serial code is not perturbed and will therefore still compile without using OpenMP. Using OpenMP to parallelize applications on a shared memory computer allows a programmer to specify serial and parallel portions of code while hiding communication and memory access details. Comparison of OpenMP and MPI. Although MPI can be used on a shared memory computer, it is more advantageous to develop parallel code using OpenMP on a shared memory platform. First, OpenMP does not require explicit communication between processors because all processors have access to one large global memory. Data transfer is completely contained in the underlying memory management hardware and is not exposed to the programmer. A second advantage resulting from a single memory space is having the luxury of developing parallel code incrementally from the serial code (Quinn, 2004). For example, starting with a serial program it is possible to separate different parts of code into blocks and parallelize one block at a time. With the fork/join model, the benefit of partial parallelization is realized using multiple processors while the serial portions of code are run using just one processor. The main disadvantage associated with OpenMP is that it is effectively limited to shared memory programming and is not (yet) suitable on a distributed memory platform. If the speedup required is much larger than the number of processors available on a shared memory machine, a large distributed memory supercomputer and MPI should be used.
Classification Algorithms K-means Pecora 16 “Global Priorities in Land Remote Sensing” October 23 – 27, 2005 * Sioux Falls, South Dakota
Algorithm Description. K-means clusters N data points in E n (real n-dimensional Euclidean space, all n-tuples of real numbers) into K different clusters such that the sum of the distances between each cluster mean and the data points belonging to the cluster cannot be reduced by reassigning any of the data points to any of the existing clusters (Hartigan, 1975). K-means will converge in a finite number of steps to a local minimum point of the objective function K X 2 X (n) x − m(k) . k=1 n∈Ik
There is no guarantee or expectation that this local minimum point is equal to or even close to the global minimum point (Hartigan, 1975). There have been several methods proposed for initializing the cluster means in order to produce a good clustering, which will be discussed in a later section. Implementation. Because of the vector operations that are implicit with an implementation of Kmeans, there are numerous opportunities to exploit the use of Fortran 95 intrinsic functions for both serial and parallel implementations (Fortran, 1997). During an iteration of K-means where each pixel is being assigned to a cluster, the cluster assignment can be stored in an array with dimensions equal to that of the two-dimensional image. Element (i, j) of the cluster assignment array would correspond to the (i, j) element, a brightness vector, of the image array. This classification array is not only the output classification image for K-means, but it is also a mechanism for elegantly computing certain cluster statistics after the iteration terminates. A running tally of the sum and number of data values for each cluster is computed during each iteration in order to compute each cluster mean upon completion of cluster assignment for the entire image. Since the operator ’/’ is defined for arrays in Fortran 95, all the cluster means are elegantly computed by dividing the sum vector by the previously calculated number of data values N(k) via mean(1:b, k) = sum(1:b, k) / N(k), where mean is a two-dimensional array containing mean vectors for each cluster, sum is the sum of the data values belonging to cluster k, and b is the number of bands in the image. Once the iteration has converged, there are additional statistics calculated as part of the output signature of each cluster. These include minimum and maximum vectors, and a covariance matrix for each cluster. The covariance matrix calculation will be described in greater detail in a later section. In order to calculate the minimum and maximum, an array containing only data values belonging to a specific cluster is created using the Fortran 95 function PACK. The cluster assignment array may be used to form a masked array that will be input into the function PACK to produce a one-dimensional array that can be input into an array intrinsic function. For example, for a specific cluster and a specific band, the minimum value is found by masking out all values not associated with the cluster of interest from the two-dimensional array of data values for the band of interest, and then the resulting array is the input to PACK. The resulting output is a one-dimensional array containing all data values belonging to the cluster of interest for one band, and this will be the input array for the Fortran 95 intrinsic function MINVAL, which will return the minimum value. An example of the use of the above functions is min(b) = MINVAL(packedArray(1:N(k))) where min is a one-dimensional array of length bands, packedArray is the one-dimensional result of the call to PACK, b is the band of interest, and N(k) is the number of data values attributed to the cluster k that the statistics are being computed for. The maximum is found using MAXVAL, �������� the �� �� �Fortran ������ ���95 ������intrinsic ��������� �function ��!�"� which is analogous to the function MINVAL described above. Principal components analysis (PCA) or Karhunen-Loeve analysis transforms a highly correlated dataset into an uncorrelated dataset where the first principal component (PC1) accounts for the most variance in the original multi-dimensional dataset (Jensen, 2005). PCA is often used to reduce the dimensionality of a dataset without losing much information (Jensen, 2005). K-means Initialization. There are numerous ways to determine initialized mean placement for Kmeans, including randomly seeding the means (Hartigan, 1975). As an improvement, Hartigan suggests that the means be seeded along the axis of greatest variance (PC1), and Huang (2002) showed that placing the initial means plus or minus one standard deviation from the mean results in higher classification accuracies. Pecora 16 “Global Priorities in Land Remote Sensing” October 23 – 27, 2005 * Sioux Falls, South Dakota
Implementation. The PCA calculation first requires a covariance matrix N
Σ=
1 X (i) (x − m)(x(i) − m)t N − 1 i=1
where Σ is the covariance matrix, x(1) , . . . , x(N ) ∈ E b are b-dimensional data points, m is the sample mean, and N is the total number of data points. This formula for the covariance matrix requires a previously calculated mean and would require two iterations through the data. Consider the i, j element of (N − 1)Σ, (N − 1)Σi,j
=
N X
(n)
(xi
(n)
− mi )(xj
− mj )
n=1
=
N X
(n) (n)
xi xj
(n)
(n)
− x i mj − x j mi + m i mj
n=1
= Ai,j − si mj − sj mi + N mi mj , where s=
N X
x(n) ,
n=1
A=
N X
x(n) x(n)t ,
n=1
and m=
s N
can be calculated in one iteration through the data points x(1) , . . . , x(N ) . To save computation time and storage space, only half of Σ and A need be stored and calculated as they are both symmetric. To calculate the eigenvalues λ1 ≥ λ2 ≥ · · · ≥ λb ≥ 0 and corresponding eigenvectors v (1) , . . . , v (b) , where b is the number of bands of the data values x(1) , . . . , x(N ) , only one LAPACK routine SSYEV (or its double precision equivalent DSYEV) is required (Anderson et al., 1992). Once these are calculated, the brightness vectors x(1) , . . . , x(N ) and the mean m may be transformed to PC1 using the transformation P C1k = v (1)t x(k) , µP C1 = v (1)t m, k = 1, . . . , N, where v (1) is the eigenvector corresponding to the largest eigenvalue λ1 . Once the mean and all brightness values are transformed to PC1, K cluster means are initialized equally spaced in the interval [µ P C1 − λ1 , µP C1 + λ1 ], and each brightness vector is assigned to the nearest cluster based on its first principal component. Once all vectors have been assigned to a cluster, each cluster mean is calculated using each pixel’s non-transformed brightness vector.
Maximum Likelihood Algorithm Description. Maximum likelihood is a highly used supervised classification algorithm (Richards, 1999, Jensen, 2005). The algorithm determines the class a pixel belongs to based on the probability that it belongs to each of the input training classes ω1 , . . . , ωt . Richards gives the following function to be maximized (with respect to i), gi (x) = − ln |Σi | − (x − mi )t Σ−1 i (x − mi ), where a pixel is assigned to class i for which gi (x) is maximized (1999). In this maximum likelihood implementation, it is assumed that mean vectors and covariance matrices will be input as part of spectral class signatures. The goal of this implementation is to efficiently and portably code the above decision rule. A quick glance at the above equation reveals that the most costly computations are calculating the determinant and inverse of the covariance matrix. Because the covariance matrix is symmetric, it may factored Σ = P DP −1 , where the columns of P are the orthonormal eigenvectors Pecora 16 “Global Priorities in Land Remote Sensing” October 23 – 27, 2005 * Sioux Falls, South Dakota
u(1) , . . . , u(n) and D is a diagonal matrix containing eigenvalues λ1 , . . . , λn , corresponding to the eigenvectors (Lay, 2000). The determinant of Σ is the determinant of D, and the determinant of a triangular matrix is the product of the elements of the diagonal (Lay, 2000). To calculate the inverse of Σ, the inverse of P DP −1 may be calculated as (P DP −1 )−1 = (P −1 )−1 (D)−1 (P )−1 = P D−1 P −1 . P −1 = P t because the eigenvectors are orthonormal and D −1 is trivial to calculate because only the inverse of each scalar term in the diagonal matrix need be calculated. In order to implement this efficiently, the LAPACK function SSYEV (DSYEV for double precision) is used to calculate the eigenvectors and eigenvalues of Σ (Anderson et al., 1992). After determining P and D, Fortran 95 intrinsic functions MATMUL and TRANSPOSE maybe be used to complete the inverse calculation.
IGSCR IGSCR is an iterative process that produces a classification of an image based on user input training data containing informational classes associated with select pixels within the image of interest. This is an important advantage over classification algorithms requiring a user to define and input spectral classes. An informational class is a category, such as deciduous forest or row crops, that is defined separate from the image to be classified. A spectral class is a cluster grouping within an image that is inherent in that image. In a classification, the spectral classes in an image are used in the classification algorithm to assign each pixel to a spectral class, and the human analyst assigns each spectral class to an informational class so that the classification image may be recoded from spectral classes to categorical informational classes. One approach to classification is to have a user identify the spectral classes that are inherent in the image and input them into the classification scheme. This is often difficult because the user must ensure that each spectral class contains only one informational class and no spectral classes have been omitted (each spectral class in the image has been identified). IGSCR tackles the above issues by using a clustering algorithm to identify the spectral classes within the image, and the algorithm determines the informational class homogeneity of a spectral class using the training data. A common issue with unsupervised classification, or clustering, is that once the spectral classes are identified it is often a non-trivial task to associate each spectral class with an informational class. In IGSCR, once the spectral classes are identified, the training data is also used to determine the informational class value of a spectral class, and this is used to recode all final output classification images. The algorithm begins with the user inputting an image to be classified, training data specific to that image, and various parameters for the unsupervised classification and the spectral class homogeneity test. K-means clustering is performed on the input image, and the resulting spectral classes are analyzed for informational class homogeneity to ensure that only one informational class is present (with high probability) in each spectral class. If more than one informational class is present with significant probability, that spectral class will be rejected, and all pixels belonging to that class will have the opportunity to be reclustered. In order to conduct the homogeneity test, the training data must be analyzed to determine how many points from each informational class fall into each spectral class. For any training point, ti , the point’s coordinates in the original image are used to determine which spectral class it was assigned to in the unsupervised classification. Each spectral class has an informational count vector that has a length equal to the number of informational classes, and the component of the vector that corresponds to the informational class that was associated to ti (by the analyst in the training phase) is incremented. After this process has been applied to each training point, the homogeneity test is conducted for each spectral class. The homogeneity test is given by Musy (2003) as Nk (1 − p0 ) ≥ 5 (spectral class must have minimum number of pixels) and Z > Z(α) (homogeneity test), where p Z = (ˆ p − p0 − 0.5)/ p0 (1 − p0 )/Nk , α is the type-I error rate, Z(α) is the value such that P (Z ≥ Z(α)) = α for a N (0, 1) variable Z, pˆ = Nmaj /Nk , p0 is the user input threshold, Pecora 16 “Global Priorities in Land Remote Sensing” October 23 – 27, 2005 * Sioux Falls, South Dakota
Nk is the total number of training pixels in the spectral class, and Nmaj is the majority informational class count (count of training pixels belonging to the informational class with the highest count). If a spectral class is determined to be pure (Z > Z(α)), then the majority informational class is assigned to the spectral class, and each pixel that was assigned to the spectral class by K-means clustering is recoded to the informational class value in the output classification image. Furthermore, each pixel belonging to a pure spectral class is removed from the input image for successive applications of K-means clustering. The pure spectral class and its signature (a set of statistics for the class such as mean and covariance among bands) are kept for later processing. After all spectral classes have been processed, K-means clustering (with the same value of K that was used in each previous iteration) is used again on the remaining pixels and the homogeneity test ensues. This iteration continues until no pixels belonging to impure classes remain in the input image, no pure classes were found during the previous iteration, or a maximum number of iterations has occurred. In this manner, all pixels belonging to impure spectral classes are reclustered during the subsequent iteration and each iteration operates on a proper subset of the pixels used in the previous iteration. Once the iteration terminates, there is a set of pure spectral classes, an unsupervised classification image recoded to informational class values with zeroes for background and unclassified pixels, a set of unclassified pixels remaining from the original image, and the original image. There are three options for output classification images at this stage, and any or all of them may be selected by the user. First, a maximum likelihood classification may be run on the original image using the pure spectral classes as training classes. Second, all unclassified pixels may be recoded to a reserved value designating unclassified pixels (the number of informational classes plus one) and added to the unsupervised classification image to produce a stacked classification image. Finally a maximum likelihood classification may be performed on only the unclassified pixels (using the pure spectral classes as training classes), and the resulting classification may be added to the unsupervised classification image to produce the final output image. Implementation. The biggest opportunities to exploit the intrinsic functions in Fortran 95 are in the masking and recoding phase. Absent vector operations, it would be necessary to loop over each pixel and test the pixel’s class value explicitly. Based on this test, the pixel’s brightness vector from the input image would either be masked out of the input image or recoded to its informational class value in the output classification image. Using the Fortran 95 intrinsic function WHERE with an array mask, an array can be used as a boolean test to determine whether an operation should be performed on corresponding elements of another array of equal dimensions. An example of using the WHERE statement to recode to informational class values is WHERE(class.eq.k) recodeImage = classValue(k) end WHERE, where the dimensions of class and recodeImage are equal.
Hierarchical Data Format 5 (HDF5) Description of HDF5 The previous incarnation of IGSCR uses the ERDAS Macro Language and the ERDAS Developer’s Toolkit, which allows the use of ERDAS library functions and access to the ERDAS Imagine data format through Application Programming Interface (API) calls. One goal of this implementation is to achieve portability by removing dependencies on specific platforms and software. The HDF5 data format and API library was chosen because it is flexible, robust, and already widely used in the scientific community (HDF5, 2004). HDF5 can be used on a variety of operating systems with many C and Fortran compilers (HDF5, 2004). HDF5 is a standard that defines a grouping of large scientific datasets and associated properties stored on disk, and it is an API that implements the standard in order to provide efficiency and ease to a programmer. There are various objects defined in HDF5 that can be grouped together in a conceptual tree structure within an HDF5 file. Reading and writing of each object is done through a series of function calls. The table below describes all of the HDF5 objects that are used in the implementation of IGSCR. Pecora 16 “Global Priorities in Land Remote Sensing” October 23 – 27, 2005 * Sioux Falls, South Dakota
file group dataset dataspace datatype attribute
container to store file objects acts like unix directory to form hierarchy of objects within file large array objects used to store multi-dimensional data describes dimensionality of a dataset can be intrinsic or derived type; description of data in a dataset generally a small dataset (can be scalar) used to describe metadata for a user-defined property of a group, dataset, or a named datatype
These objects are all that is necessary to describe the files that will be input into and output from IGSCR.
File Descriptions Image File. The input image file contains a three-dimensional dataset containing the image with a corresponding dataspace and datatype. The three dimensions correspond to rows, columns, and bands of the image. Additionally, there are multiple attributes used to specify information such as corner map coordinates, pixel size, and projection information for the image. This information corresponds to data that would typically be found in a header file accompanying binary data. Training Data Files. A single training data file is input into IGSCR. The training data is represented by a set of x,y coordinates with a corresponding class value. The x and y coordinates are file indices for specific points in the input image. Each set of training points is a two-dimensional dataset where the first dimension has a length of two (for two coordinates) and the length of the second dimension is the number of points. Signature Files. IGSCR outputs the pure class signatures that were used for the supervised classification to an HDF5 file. Each class signature is represented by an HDF5 group with the class name as the group name. The class name takes the form of basename[iteration]-[informational class] where basename is user defined, the iteration is the number of the iteration when the signature was created, and the informational class is the number corresponding to the class number. Each signature group contains the following datasets: minimum, maximum, mean, covariance matrix, and n, a scalar value representing the total number of points in the class.
Parallel IGSCR The strategy for parallelizing IGSCR is to locate operations in the original algorithm that may be run in parallel and to concentrate on those operations that will result in the greatest speedup. These operations that may be run concurrently will fall into one of two categories of parallelism, functional or data parallelism. Data parallelism, or single instruction multiple data (SIMD) parallelism, is exhibited when multiple processes perform identical operations on different members of one dataset, whereas functional parallelism, or multiple instruction multiple data (MIMD) parallelism, occurs when distinctly different operations are performed concurrently on potentially independent data (Quinn, 2004). An example of functional parallelism inherent in IGSCR is when three different operations may be applied to the input image to produce three independent classifications. Data parallelism is prevalent throughout IGSCR; a simple example of this is the maximum likelihood classification where all pixels are classified using identical operations. Loops over many data values are common indicators of potential data parallelism. In order to isolate those sections of code that may be run in parallel with a modest shared memory programming adaptation, it is necessary to determine which parts of the sequential algorithm are independent. The following three conditions, known as Bernstein’s conditions, guarantee that two statements S i and Sj are independent: 1. O(Si ) ∩ O(Sj ) = ∅, 2. I(Sj ) ∩ O(Si ) = ∅, 3. I(Si ) ∩ O(Sj ) = ∅, where the set of all input, output variables to statement Si is denoted by I(Si ), O(Si ) respectively (Bernstein, 1966). Simply put, two statements may be considered independent if the two statements do not write to the same variable and one statement does not have an output variable that is also an input variable to the other statement. Pecora 16 “Global Priorities in Land Remote Sensing” October 23 – 27, 2005 * Sioux Falls, South Dakota
Once the candidate sections for parallelization are selected, it is necessary to determine whether parallelization will result in an appreciable speedup in the overall algorithm. An example of parallelism that does not best take advantage of potential processing power is the functional parallelism inherent in the multiple classifications at the end of IGSCR, because there are at most three classification tasks and therefore this (functional) parallelism is not scalable beyond three processors. There are other cases when parallelizing a section of code does not result in a faster algorithm, such as when the overall speedup of a parallel section will be negated by overhead associated with parallel communication. Therefore it is important to locate sections of code that may be run in parallel and have a large potential speedup and high likelihood of contributing to large speedup of the entire algorithm. A profiler is a useful tool to aid an analyst in determining which sections of code might benefit most from parallelization efforts. The output of a profiler will specify the percentage of total time spent in each function within code. By profiling a serial implementation of an algorithm, an analyst may gain insight into which portions of the code are most costly, and the analyst will consequently concentrate most parallelization effort on those sections. Table 1 shows the approximate results of profiling a serial implementation of IGSCR. The most costly functions are listed. Table 1: Profiling Results function percentage of overall time IGSCR 100 K-means 79.5 calculate output statistics for K-means 22 initialize K-means cluster means 11.5 maximum likelihood 14 These results show that the majority of time spent running IGSCR is spent running K-means followed by maximum likelihood. A significant reduction in time spent in K-means will significantly reduce the overall time required to run IGSCR. Furthermore the profiling provides further insight into the various functions within K-means that are contributing to the large amount of processing time required. It is interesting to note that the time spent in the IGSCR code (determining class homogeneity and subsequently modifying the input and output images) is relatively small in comparison to the total time required to run its clustering and classification functions. The most obvious opportunities for parallelization and largest performance gains in IGSCR are the loops that have a large number of predetermined independent iterations. These loops are present throughout IGSCR, most notably in the K-means clustering and maximum likelihood classification algorithms. For clustering, an operation is applied to an individual pixel to determine a cluster assignment, and the calculations for all pixels may be performed concurrently as the operation on each pixel is independent of all other pixels and resulting clustering output. The same is true for the loop to calculate spectral class statistics in maximum likelihood. Because there are far fewer spectral classes than pixels, the speedup may not be as high, but there will still be speedup as a result of calculating class statistics in parallel when many spectral classes are present (enough to compensate for parallel overhead). The shared memory parallel maximum likelihood algorithm therefore differs from the serial version when one process forks to form several processes to calculate class statistics and perform the classification of the image. In K-means, there are several large loops over all pixels to consider for parallelization. The largest consumer of time is the cluster reassignment loop where each pixel is assigned to the nearest cluster and the cluster mean is recalculated for the subsequent iteration. In the interest of having a large task granularity, it is desirable to spread the outermost loop over all processes. This reduces the overhead associated with forking multiple processes repeatedly in an inner loop. In this algorithm, the outer loop is arbitrarily over all rows, so all rows will be spread over all processes. The cluster assignment loop is ideal for parallelization because it is large and costly, and each iteration is independent. Each pixel is assigned to the closest cluster, and during a single iteration, no pixel’s assignment is dependent on another pixel. At the end of the cluster assignment, the mean is determined through the use of a running sum and count that is tallied within the assignment loop. These are arrived at by each process maintaining its local running sum and count, and when the loop terminates all local copies are combined through addition to produce global totals. This is known as a reduction operation. Pecora 16 “Global Priorities in Land Remote Sensing” October 23 – 27, 2005 * Sioux Falls, South Dakota
The other functions within K-means that use a significant amount of time are the functions that initialize the cluster means using principal components analysis and calculate final cluster statistics. In the mean initialization function, there are three loops that iterate over all data values in the input image. These large loops are a good focus for parallelization efforts as they are costly and independent of each other. First the covariance calculation loop may be broken up across the rows of the image. Recall that the covariance matrix can be calculated in one pass of the image by storing various sums. These sums may be calculated in parallel using a reduction as described above. The second large loop converts each pixel to its corresponding first principal component. This is a straightforward linear transformation that is independent of other pixel values and can rather trivially be done in parallel. Finally, the last large loop assigns each pixel to a cluster based on the distance to the cluster’s mean value located on the first principal axis. This loop is conceptually identical to the main K-means cluster assignment loop and can be parallelized in the same manner.
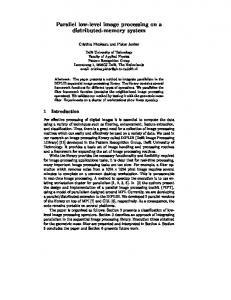
Parallel Results Parallel IGSCR was tested using three datasets (referred to as “15m”, “16m”, and “17m”) that were used to test the automated version of IGSCR written by Musy for her master’s thesis (2003). The three images are Landsat ETM+ images from Virginia that contain two or three full scenes that have been merged together. Image 15m contains Worldwide Reference System (WRS) path fifteen, rows 34 and 35, image 16m contains WRS path sixteen, rows 34 and 35, and image 17m contains path seventeen, rows 33, 34, and 35, where each image contains six bands and the dimensions of the images are 6284 × 7441, 6291 × 7963, and 9288×9939, respectively. For each of the parallel and serial runs using these images, a homogeneity threshold of .9 and a Type I error rate of .05 was used to determine spectral class purity. The convergence threshold for K-means was .975, and the number of initial clusters was 100. The maximum number of iterations for IGSCR was 15, and the maximum number of iterations for K-means was 100, although both iterations terminated early. Tables 2, 3, and 4 give the execution times in seconds and the speedup (serial execution time/parallel execution time) for the three test images using one, two, four, eight, and twelve processors of an SGI Altix 3300 with 24 Gb of RAM, a 292 Gb hard drive, and twelve 1.3 Ghz processors. Figures 1, 2, and 3 show the speedup as a function of the number of processors used for each test run as the solid line, and ideal speedup is shown as the dashed line. Table 2: Execution Time and Speedup for 15m number of processors time (seconds) speedup 1 12,482 1 2 5,159 2.42 4 2,645 4.72 8 1,479 8.44 12 1,246 10.02 Table 3: Execution Time and Speedup for 16m number of processors time (seconds) speedup 1 21,216 1 2 6,671 3.18 4 3,742 5.67 8 2,386 8.89 12 2,116 10.03 Table 4: Execution Time and Speedup for 17m number of processors time (seconds) speedup 1 25,307 1 2 6,332 4 4 3,793 6.67 8 2,742 9.23 12 2,575 9.83 Pecora 16 “Global Priorities in Land Remote Sensing” October 23 – 27, 2005 * Sioux Falls, South Dakota
speedup 12 10 8 6 4 4
6
8
10
12
number of processors
Figure 1. Speedup for Test Image 15m.
speedup 12 10 8 6 4 4
6
8
10
12
number of processors
Figure 2. Speedup for Test Image 16m.
speedup 12 10 8 6 4 4
6
8
10
12
number of processors
Figure 3. Speedup for Test Image 17m. Pecora 16 “Global Priorities in Land Remote Sensing” October 23 – 27, 2005 * Sioux Falls, South Dakota
REFERENCES REFERENCES For an application that parallelizes perfectly, the ideal speedup will be equal to the number of processors that are used. This is rarely achieved, however, as most parallel applications require communication that causes additional overhead and contain sequential sections of code. When twelve processors are used for parallel IGSCR for these three images, the speedup is roughly equal to ten. This might be expected as several sections of the code are still executed sequentially. It is interesting to note that for several cases above, the value of the speedup is actually greater than the number of processors used for a test run. The SGI Altix 3300 that was used to generate these results contains twelve processors, and each processor has its own cache memory and main memory. The increase in this type of fast memory could explain how the speedup is greater than the number of processors in these instances. As the images increase in size, the speedup is proportionally greater for the test runs with two, four, and eight processors, which would support the claim that additional cache and processor memory resources are contributing to faster execution times.
Conclusions Prior to this work, IGSCR classification was performed using a “black box” proprietary software library, and classification of a full Landsat scene required several hours of processing time. With the creation of a portable and open-source serial version of IGSCR, analysts are able to verify the algorithms that are used. The parallel implementation of IGSCR runs on a modest number of processors and saves an analyst several hours of processing time, allowing the analyst to process more data or spend more time interpreting results.
References [1] Anderson, E., Z. Bai, C. Bischof, J. Demmel, J. Dongarra, J. Du Croz, A. Greenbaum, S. Hammarling, A. McKenney, S. Ostrouchov, and D. Sorensen (1992). LAPACK Users’ Guide. SIAM. [2] Ball, G. H., and D. J. Hall (1965). A novel method of data analysis and pattern classification. Stanford Research Institute, Menlo Park, California. [3] Bauer, Marvin E., Thomas E. Burk, Alan R. Ek, Pol R. Coppin, Stephen D. Lime, Terese A. Walsh, David K. Walters, William Befort, and David F. Heinzen (1994). Satellite Inventory of Minnesota Forest Resources. Photogrammetric Engineering & Remote Sensing 60(3):287-298. [4] Campbell, James B. (1996). Introduction to Remote Sensing. Image Classification. The Guilford Press, pp. 313-354. [5] Bernstein, A. J. (Oct. 1966). Analysis of programs for parallel processing. IEEE Transactions on Computers, pp. 746-757. [6] Duda, Richard O., and Peter E. Hart (1973). Pattern Classification and Scene Analysis. Parameter Estimation and Supervised Learning. John Wiley & Sons, pp. 44–84. [7] ERDAS (1999). ERDAS field guide (5th ed.), revised and expanded. Atlanta, GA: ERDAS. [8] Fortran (1997). Information technology — Programming languages — Fortran —. ISO. [9] Hartigan, John A. (1975). Clustering Algorithms. The K-Means Algorithm. John Wiley & Sons, pp. 84–112. [10] HDF5 User’s Guide (2004). Hierarchical Data Format (HDF) Group, National Center for Supercomputing Applications (NCSA), University of Illinois at Urbana-Champaign (UIUC). [11] Huang, K. Y. (2002). A synergistic automatic clustering technique (SYNERACT) for multispectral image analysis. Photogrammetric Engineering & Remote Sensing 68(1):33-40. [12] Jensen, J. R., E. W. Ramsey, H. E. Mackey, Jr., E. J. Christensen, and R. R. Shartz (1987). Inland wetland change detection using aircraft MSS data. Photogrammetric Engineering & Remote Sensing, 53(5):521-529.
Pecora 16 “Global Priorities in Land Remote Sensing” October 23 – 27, 2005 * Sioux Falls, South Dakota
REFERENCES REFERENCES [13] Jensen, John R. (2005). Introductory Digital Image Processing, A Remote Sensing Perspective. Prentice Hall. [14] Jordan, Harry and Gita Alaghband (2003). Fundamentals of Parallel Processing. Prentice Hall. [15] Kelly, Maggi, David Sharri, Qinghua Guo, and Desheng Liu (2004). A comparison of standard and hybrid classifier methods for mapping hardwood mortality areas affected by “sudden oak death.” Photogrammetric Engineering & Remote Sensing, 70(11):1229-1239. [16] Lay, David C. (2000). Linear Algebra and its Applications. Addison Wesley. [17] Musy, R.F. (2003). Refinement of Automated Forest Area Estimation via Iterative Guided Spectral Class Rejection. M.S. Thesis, Department of Forestry, Virginia Polytechnic Institute and State University, Blacksburg, VA [18] Quinn, Michael J. (2004). Parallel Programming in C with MPI and OpenMP. McGraw Hill. [19] Richards, John A., and Xiuping Jia (1999). Remote Sensing Digital Image Analysis. Springer. [20] Snir, M., S. W. Otto, S. Huss-Lederman, D. W. Walker, and J. Dongarra (1996). MPI: The Complete Reference. The MIT Press. [21] Wayman, Jared P., Randolph H. Wynne , John A. Scrivani, and Gregory A. Reams (2001). Landsat TM-based forest area estimation using Iterative Guided Spectral Class Rejection. Photogrammetric Engineering & Remote Sensing 67(10):1155-1166.
Pecora 16 “Global Priorities in Land Remote Sensing” October 23 – 27, 2005 * Sioux Falls, South Dakota