Debugging shared memory parallel programs using record/replay
Recommend Documents
mentation on the same application suite we use for perfor- mance debugging. ...... potheses postulated by the tool builder, and is re ned until a few hypotheses ...
trol in shared memory programs, their use is a complex and error-prone task, .... the programmer specifies that the updates to both bank accounts must be done ..... by analyzing synchronization patterns in three large software packages: ...
Department of Computer Science and Engineering, ‡ IBM T.J. Watson Research ... University of Illinois at Urbana-Champaign. {pmontesi, torrella}@cs.uiuc.edu.
task that draws on tools and techniques developed over many years. One early .... impractical to monitor programs during normal execution. Use of this method ...
in Candidacy for the Degree ... A graduate school career is about much more than just research. I could ..... 4.4 Runtim
acts as a summarizing block for its descendant blocks and is used when its descendants constitute an e-block; an e-block is the unit of incremental tracing during.
or corrupt data. Not all data-races are bugs: in fact, research suggests that only 2â10% of data races are harmful [1]
Oct 16, 2011 - Parallel Programs ... Email addresses: [email protected] (Phil Miller), .... for bulk remote array segments or incur remote communication costs ..... We avoid this complexity by sending messages containing array handles to.
Center for Environmental Applications of Remote Sensing. Departments of .... comprised of compiler directives and function calls (Jordan and Alaghband, 2003).
community, porting existing serial applications to a parallel environment is usually nontrivial. ... class, an unsupervised classification is performed on the image, and ... K-means will converge in a finite number of steps to a local minimum point o
clusive, royalty-free right to publish or reproduce this article, or to allow others to do so, .... Labs Linux Checkpoint/Restart [10] provide checkpointing for SMP systems. ...... points all the data malloc()-ed by an application regardless of wheth
Simulation results for two parallel application programs, Gaussian elim- .... Parallel Gaussian elimination (dgauss) 4] and Fast Fourier Transform (FFT) 11] codes ...
parallelizing such algorithms on shared memory multiprocessor systems. We present ... server behavior by prefetching resources as users move the web application according to their ..... When a node's dedicated queue is empty, it attempts to.
Computing Machinery. To copy ... I988 ACM O-8979 I -269-l/88/0006/0 135 $1.50 ... anticipate the types of bugs that exist in the program until an error is.
ing replay can dramatically slow down a ... The IDD system [Harter et al. ..... 2 eventwait on 3. Figure 5. The mtdbx time-process diagram. Display. Filter w. Time.
Syntax errors: occur when a program statement does not conform to the rules ...
When SAS detects a syntax error, it first tries to correct the error by deleting,.
In (Friedrich, Stumptner, & Wotawa 1999) VHDL con- ... changes on signals CLK and RESET are provided) is shown ..... and loops, we can check whether a condition is wrong or ..... They work as a filter for the computed diagnosis candi- dates.
Jul 9, 2007 - Thus, developers usually tar- get one fault at a time in their debugging. A developer can inspect a single failed test case to attempt to find its ...
bugger), a prototype scalable omniscient debugger for Java, which aims at making omniscient debug- ging practical, at last. Omniscient Debugging in a Nutshell.
It has been implemented using the Apache Felix framework, the. iPOJO
component ..... of our examples, and like JOnAS is just an “enhanced” OSGi
framework ...
Commercial software developers are hesitant to adopt aspect-oriented .... Exhibited by activities: dynamic aspect selection, aspect activation, and bookkeeping.
Mar 20, 2014 - AI] 20 Mar 2014. Interactive Debugging of ASP Programs. Kostyantyn Shchekotykhin. University Klagenfurt, Austria [email protected].
Commercial software developers are hesitant to adopt aspect-oriented software devel- ..... that updates the debug information, which is made possible by the Microsoft Phoenix ..... Aspect-Oriented Software Development (AOSD'02), Apr. 2002.
Mar 20, 2014 - Broad application of answer set programming (ASP) for declarative problem solving requires the development of tools supporting the coding ...
Debugging shared memory parallel programs using record/replay
tices that the biggest part of the development time is ... ferent threads of the application, it is possible that .... importance as an overhead that is too big will alter.
Future Generation Computer Systems 19 (2003) 679–687
Debugging shared memory parallel programs using record/replay Michiel Ronsse∗ , Mark Christiaens, Koen De Bosschere Department of Electronics and Information Systems, Ghent University, St.-Pietersnieuwstraat 41, B-9000 Ghent, Belgium
1. Introduction If there is one resource that computational scientists always seem to be short of, this would be computing power. Indeed, many simulations (e.g. Monte Carlo) require inordinate amounts of time in order to produce a solution. It is possible to speed this up by using a farm of PCs with a number of simulations being executed in parallel. The same farm can be used to make a parallel execution of one simulation, e.g. by using some kind of message passing runtime system such as MPI [1]. It is also possible to use shared memory as a means for communication. In the past, this required an expensive multiprocessor system. Fortunately, these days, it is possible to buy cheap ∗
multiprocessor PCs that have ample computing power. However, computing power alone will not solve the problem, as a parallel version of the software should be developed in order to fully exploit the computing power. Although a number of advanced programming environments, formal methods and design methodologies for developing reliable software are emerging, one notices that the biggest part of the development time is spent while debugging and testing applications, which is not a simple task. As it is, for all but the simplest programs, unfeasible to debug a program by checking the source code alone, most programs are debugged by observing one or more executions of the program. Using this method, one usually starts with a hypothesis about the bug that one wants to prove or deny. In order to check the hypothesis, one must collect information about the execution (e.g. the values of variables at different times during the execution). Collecting all the information needed
M. Ronsse et al. / Future Generation Computer Systems 19 (2003) 679–687
during one program execution is rather impractical, and therefore, most programmers collect the information during a number of successive program runs. After each program execution, the collected information (using watchpoints, breakpoints or by adding print instructions) is used to adapt the hypothesis about the cause of the bug, resulting in more detailed and specific information about the cause of the bug. This type of debugging is generally called cyclic debugging and is based on the ability to create equivalent repeated executions. Repeating a particular execution of a deterministic program (e.g. a sequential program) is not that difficult. As soon as one can reproduce the program input, the program execution is known (input and program code define the program execution completely). This turns out to be considerably more complicated for non-deterministic programs. The program execution of such a program cannot be determined a priori using the program code and the input only, as these programs make a number of non-deterministic choices during their execution, such as the order in which they enter critical sections, the use of signals, etc. All modern thread-based applications are inherently non-deterministic because the relative execution speed of the different threads is not stipulated by the program code. Cyclic debugging cannot be used as such for these non-deterministic programs as one cannot guarantee that the same execution will be observed during repeated executions. Moreover, the use of a debugger will have a negative impact on the non-deterministic nature of the program. As a debugger can manipulate the execution of the different threads of the application, it is possible that a significant discrepancy in execution speed arises, giving cause to appearing or disappearing bugs. The existence of these kind of errors, combined with the primitive debugging tools used nowadays, makes debugging parallel programs a laborious task. In this paper, we present our tool, RecPlay, that deals with non-determinism that is specific for parallel programs: unsynchronized accesses to shared memory (the so-called race conditions). RecPlay uses a combination of techniques in order to allow the usage of standard debuggers (e.g. the ones used for sequential programs such as gdb, dbx and ddd) for debugging parallel programs. RecPlay is a socalled record/replay mechanism: information about a
program execution can be traced (record phase) to a file and this information is used to guide a faithful re-execution1 (replay phase).
2. Record/replay for parallel programs This paper deals with record/replay for parallel programs; programs that have multiple threads running on a computer with one or more processors. The threads communicate with each other using variables placed in shared memory. However, the ideas presented in this paper are also applicable to so-called distributed shared memory systems, as evidenced in [2]. This paper does not deal with distributed programs (parallel programs that communicate using messages) as these programs can be taught of as being multiple sequential programs running at the same time and communicating using messages. As such, the non-determinism present in these programs is basically input-related non-determinism. However, the ideas presented can also be applied to these programs [3].
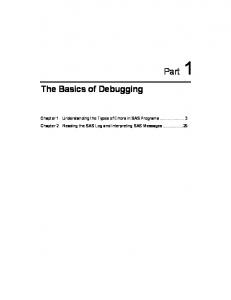
3. The RECPLAY method Technically, a race condition occurs whenever two threads access the same shared variable in an unsynchronized way, and at least one thread modifies the variable. Fig. 1 shows an example: after the execution, global contains one of the values 77, 41, 35 or 11. This type of race condition is called a data race. In order to replay a program execution containing race conditions it suffices to make sure that all load operations read the same value as during the recorded execution. This can be solved using two approaches: Contents-based replay traces the values of the variables read. During a replayed execution, this value is read from the trace file and is fed to the load operations. As such, the actual read operation is not performed. It is clear that this approach will lead to huge trace files. An advantage of this method is the fact that individual threads can be replayed without replaying the other threads. 1 Two executions of the same program are equivalent if they have the same internal program flow. In this case, the second execution is said to be a faithful re-execution of the first execution.
M. Ronsse et al. / Future Generation Computer Systems 19 (2003) 679–687
681
Fig. 2. An example showing Lamport timestamps. Two threads use two variables, denoted by the filled circle and the box. The dotted arrows show the dependencies.
Fig. 1. A program containing a data race on global.
Ordering-based replay does not log the values read by the read operations, but the order in which the read and write operations are executed. The idea is that if we make sure that a read operations is re-executed after the same write operation as during the recorded execution, the same value will be read. Although, at first sight, it is not evident that ordering-based methods produce smaller trace files than contents-based methods this turns out to be the case. RecPlay uses the ROLT method [4], an ordering-based record/replay method, for logging the order of the synchronizations operations. ROLT logs, using Lamport clocks [5], the partial order of the synchronization operations. A timestamp is attached to each synchronization operation, taking the so-called clock condition into consideration: if operation a causally occurs before b during a given execution the timestamp LC(a) of a should be smaller than the timestamp LC(b) of b: a → b ⇒ LC(a) < LC(b). A Lamport timestamp is a scalar value, and as such a Lamport clock maps the partial order of the memory operations onto a total order of scalar clocks. The fact that the order we trace using these timestamps is stricter than the actual order noticed during an execution is however no problem. A Lamport clock calculates a new timestamp each time a memory operation is performed: if operation
n is executed after operations t (the previous memory operation performed by the same thread) and m (the previous memory operation performed on the same memory location) the timestamp for n is calculated as (see Fig. 2 for an example): LC(n) = max(LC(t), LC(m)) + 1. Note that this is the most simple way to implement a clock that obeys the clock condition. In order to obtain a faithfully replayed execution it suffices to trace the Lamport timestamps (a list of timestamps for each thread) calculated for all memory operations in a trace file. During replay, the Lamport timestamps are read from the trace file and a memory operation with timestamp x is delayed until all operations with timestamps y < x have been executed. It is clear from the clock condition and the calculation of the Lamport timestamps that the timestamps calculated for one thread form a row of monotonous growing numbers. Moreover, benchmarks prove that most of the time, a Lamport timestamp is one time bigger that the previous timestamp of the thread [6]. ROLT uses this fact to compress the trace files considerably: only information about timestamp increments larger than 1 is logged. The ROLT method has therefore the advantage that it produces small trace files and that it is less intrusive than other existing methods [7]. This is of paramount importance as an overhead that is too big will alter the execution, giving rise to Heisenbugs (bugs that disappear or alter their behavior when one attempts to isolate or probe it [8]). Although the ROLT method described above does work, this solution is not ideal as the overhead introduced is too large. This overhead is caused by the fact that all memory operations have to be intercepted.
682
M. Ronsse et al. / Future Generation Computer Systems 19 (2003) 679–687
and replaying them will of course fail if a data race shows up during an execution. However, as has been shown in [9], a replayed execution will be guaranteed to be correct up to the race frontier, i.e. the point in the execution of each thread were a data race event is about to take place. Of course, the premise that a program (execution) does not contain data races is not correct. Unfortunately, declaring a program free of data races is an unsolvable problem, at least for all but the simplest programs [10]. RecPlay therefore uses a dynamic data race detector that checks for data races that occur during a replayed execution. In order to detect the conflicting memory operations, RecPlay collects all memory operations performed during a particular execution together with information about their concurrency. The concurrency depends on the (order of the) executed synchronization operations. There exists basically two (dual) methods for detecting data races using collected memory and concurrency information: Fig. 3. A correct implementation of the program depicted in Fig. 1.
An alternative approach we advocate in this paper is to record an execution as if it did not contain data races, and check for the occurrence of data races during a replayed execution. As data races are normally regarded as being programming errors,2 programmers normally try to avoid them by adding proper synchronization to parallel programs. Fig. 3 shows a corrected version of the example program, now without a data race. The data race has been removed by adding semaphore synchronization operations. Note that the program still has two possible results (41 and 77) and is therefore still non-deterministic. However, this remaining non-determinism (called synchronization race) present in the application is intended by the programmer. Synchronization races (introduced by synchronization operations) intentionally introduce non-determinism in a program execution to allow for competition between threads to enter a critical section, lock a semaphore or implement load balancing. RecPlay starts from the (erroneous) premise that an application only contains these kind of races. Tracing the order (using the ROLT method described above) in which the synchronization operations are executed
• For each access to a global variable, the access is compared against previous accesses by other threads to the same variable. This requires us to collect, for each global variable, information about past accesses.3 It is obvious that this will lead to a huge memory consumption, especially if each memory location is a potential global variable with life time equal to that of the program itself, as is the case, for example programs written in the C language. This method can however be applied for programs with a rigorous object model that is adhered to, such as Java programs as is shown in [11]. The benefit of this method is that it will detect a data race as soon as the second (racing) memory operation is executed. • For all parallel pieces of code, the memory operations are collected and compared. This method consolidates the fact that all memory operations between two successive synchronization operations (called segments from now on) satisfy the same concurrency relation: they are all either concurrent or not concurrent with a given operation and therefore with the segment containing the latter operation. 3
2
Notable exceptions are relaxation algorithms.
It suffices to collect information about the last load and store operation of each thread.
M. Ronsse et al. / Future Generation Computer Systems 19 (2003) 679–687
683
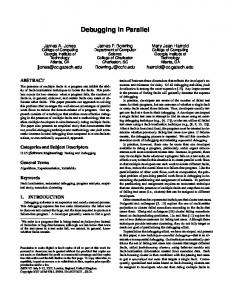
Fig. 4. RecPlay uses a 3-level bitmap where each level is addressed using a different part of the address: the first two parts are used to address lists of pointers, while the last part of the address points to the actual bit. Such a bitmap favors programs with a substantial memory locality.
Given the sets L(i) and S(i) containing the addresses used by the load and store operations in segment i, the concurrent segments i and j contain racing operations if and only if ((L(i) ∪ S(i)) ∩ S(j)) ∪((L(j) ∪ S(j)) ∩ S(i)) = ∅. Therefore, data race detection basically boils down to collecting the sets L(i) and S(i) for all segments executed and comparing parallel segments. Note that (contrary to the first method) a data race will be detected at the end of the segment containing the second racing instruction, possibly a long time (e.g. at the end of the program) after the actual occurrence of the data race. It is clear that the second method is better suited for programming languages with unconstrained life time of and access to shared variables. RecPlay therefore uses this approach. The online data race detection used by RecPlay consists of three parts: 1. First, memory reference information is collected for each sequential block between two successive
synchronization operations executed by the same thread (called segments). This yields two sets of memory references per segment: S(i) are the locations that were written and L(i) the locations that were read in segment i. RecPlay uses multilevel (see Fig. 4) bitmaps for registering the memory accesses. Note that multiple accesses to the same variable in a segment will be counted as 1, but this is no problem for detecting data races. The sets L(i) and S(i) are collected on a list. 2. Each time a segment ends, RecPlay will check for conflicting memory references in concurrent segments. There will be a data race between segment i and segment j if either (L(i) ∪ S(i)) ∩ S(j) = ∅ or (L(j) ∪ S(j)) ∩ S(i) = ∅ is true. If the comparison indicates the existence of a data race, RecPlay saves information about the data race (address and threads involved, and type of operations (load or store)). For each synchronization operation, RecPlay will compare the bitmaps of the segment that just ended against the bitmaps of the parallel segments on the list. Moreover, RecPlay will try to remove obsolete segments from the list. A segment becomes obsolete if it is no longer
684
M. Ronsse et al. / Future Generation Computer Systems 19 (2003) 679–687
Table 1 Basic performance of RecPlay (all times in seconds) Program
Cholesky fft LU Radix Ocean Raytrace Water-Nsq. Water-spat.
Replay + detect
Normal
Record
Replay
Runtime
Runtime
Slow-down
Runtime
Slow-down
Runtime
Slow-down
8.67 8.76 6.36 6.03 4.96 9.89 9.46 8.12
8.88 8.83 6.40 6.20 5.06 10.19 9.71 8.33
1.024 1.008 1.006 1.028 1.020 1.030 1.026 1.026
18.90 9.61 8.48 13.37 11.75 41.54 11.94 9.52
2.18 1.10 1.33 2.22 2.37 4.20 1.26 1.17
721.4 72.8 144.5 182.8 107.7 675.9 321.5 258.8
83.2 8.3 22.7 30.3 21.7 68.3 34.0 31.9
possible for future segments to be parallel with the given segment. 3. If a data race was found, the conflicting memory accesses will be identified given the traced information. This requires another replayed execution. In our race detection tool, we use a classical logical vector clock [12] for detecting concurrent segments as segments x and y can be executed in parallel if and only if their vector clocks are not ordered (px is the thread on which segment x was executed): VCx [px ] ≥ VCy [px ] and VCx [py ] ≤ VCy [py ], x y ⇔ or VCx [px ] ≤ VCy [px ] and VCx [py ] ≥ VCy [py ]. This is possible thanks to the strong consistency property of vector clocks: a → b ⇔ LC(a) < LC(b) For detecting and removing the obsolete segments, RecPlay uses an even stronger clock: snooped matrix clocks [13]. It is clear that data race detection is not a cheap operation. The fact that all memory accesses must be intercepted does indeed impose a huge overhead. Fortunately, RecPlay performs the data race detection during a replayed execution, making it impossible for the data race detector to alter the normal execution. Moreover, for each recorded execution, only one data race check is necessary. If no data races are found, it is possible to replay the execution without checking for data races. This will lead to a much faster re-execution that can be used for cyclic debugging.
4. Evaluation The RecPlay system has been implemented for Sun multiprocessors running Solaris and for ia32 systems running Linux4 using the JiTI instrumentation tool [14]. The implementation uses the dynamic linking and loading facilities present in all modern Unix operating system and instruments (for intercepting the memory accesses and the synchronization operations) on-the-fly: the running process is instrumented. While developing RecPlay, special attention was given to the probe effect during the record phase. Table 1 gives an idea of the overhead caused during record, replay, and race detection for programs from the SPLASH-2 benchmark suite.5 The average overhead during the record phase is limited to 2.1% which is small enough to keep it switched on all the time. The average overhead for replay is 91% which seems high, but is feasible during debugging. The automatic race detection is however very slow: it slows down the program execution about 40 times (the overhead is mainly caused by JiTI intercepting all memory accesses). Fortunately, it can run unsupervised, so it can run overnight and we have to run it only once for each execution. The memory consumption is far more important during the data race detection. The usage of vector clocks for detecting the races is not new [7], but the mechanism used for limiting the memory consumption 4 You can download this version at http://www.elis.rug.ac.be/ ∼ ronsse/jiti/. 5 All experiments were done on a SUN multiprocessor machine with four processors and all benchmarks were run with four threads. All benchmarks ran five times, and the best time was used.
M. Ronsse et al. / Future Generation Computer Systems 19 (2003) 679–687
685
Table 2 Number of segments created and compared during the execution, and the maximum number of segments on the list Program
Created
Maximum stored
Compared
Cholesky fft LU Radix Ocean Raytrace Water-Nsq. Water-spat.
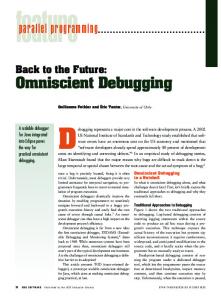
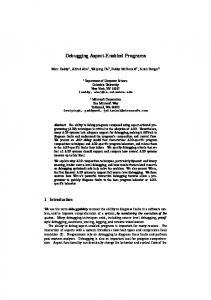
is. The usage of multilevel bitmaps and the removal of obsolete segments (and their bitmaps) allows us to limit the memory consumption considerably. Table 2 shows the number of segments that was created during the execution, the maximum number on the list, and the number of parallel segments during a particular execution (this is equal to the number of segments compared). The average maximum number of segments on the list is 8.0%, which is a small number. Without removing obsolete segments, this number would of course be 100%. Figs. 5 and 6 show the number of segments on the list and the total size of the bitmaps in function of the time (actually the number of synchronization operations executed so far) for two typical cases: lu and cholesky, respectively.6 For lu, the number of segments is fairly constant, apart from the start and the end of the execution. The size of the bitmaps is however not that constant; this is caused by the locality of the memory accesses as can be seen in the third graph showing the number of bytes used by the bitmaps divided by the number of segments. The numbers for cholesky are not constant, but the correlation between the number of segments and the size of the bitmaps is much higher, apart from a number of peaks. The number of segments drops very quickly at a number of points during the execution, caused by barrier synchronization creating a large number of obsolete segments. 5. Related work In the past, other replay mechanisms have been proposed for shared memory computers. Instant Replay [15] is targeted at coarse grained operations and traces 6
These are not the runs used for Table 2.
Fig. 5. Number of segments, size of the bitmaps and number of bytes per segment for lu.
686
M. Ronsse et al. / Future Generation Computer Systems 19 (2003) 679–687
Fig. 6. Number of segments, size of the bitmaps and number of bytes per segment for cholesky.
all these operations. It does not use any technique to either reduce the size of the trace files or limit the perturbation introduced. It does not work for programs containing data races. A prototype implementation for the BBN Butterfly is described. Netzer [7] introduced an optimization technique based on vector clocks. As the order of all memory accesses is traced, both synchronization and data races will be replayed. It uses comparable techniques as ROLT to reduce the size of the trace files. However, no implementation was ever proposed (of course, the overhead would be huge as all memory accesses are traced, introducing Heisenbugs). We believe that it is far more interesting to detect data races than to record/replay them. Therefore, RecPlay replays the synchronization operations only, while detecting the data races. Race Frontier [9] describes a similar technique as the one proposed in this paper (replaying up to the first data race). Choi and Min prove that it is possible to replay up to the first data race, and they describe how one can replay up to the race frontier. A problem they do not solve is how to efficiently find the race frontier. RecPlay effectively solves the problem of finding the race frontier, but goes beyond this. It also finds the data race event. Most of the previous work, and also our RecPlay tool, is based on Lamport’s so-called happened-before relation [5]. This relation is a partial order on all synchronization events in a particular parallel execution. By checking the ordering of all events and monitoring all memory accesses data races can be detected for one particular program execution. Another approach is taken by a more recent race detector: Eraser [16]. It goes slightly beyond work based on the happens-before relation. Eraser checks that a locking discipline is used to access shared variables: for each variable it keeps a list of locks that were hold while accessing the variable. Each time a variable is accessed, the list attached to the variable is intersected with the list of locks currently held and the intersection is attached to the variable. If this list becomes empty, the locking discipline is violated, meaning that a data race occurred. The most important problem with Eraser is however that its practical applicability is limited in that it can only process mutex synchronization operations and in that the tool fails when other synchronization primitives are build on top of these lock operations.
M. Ronsse et al. / Future Generation Computer Systems 19 (2003) 679–687
6. Conclusions In this paper we have presented RecPlay, a practical and effective tool for debugging parallel programs with classical debuggers. Therefore, we implemented a highly efficient two-level record/replay system that traces the synchronization operations, and uses this trace to replay the execution. During replay, a race detection algorithm is run to notify the programmer when a race occurs. After removing the data races, normal sequential debugging tools can be used on the parallel program using replayed executions.
[12]
[13]
[14]
References [1] Message Passing Interface Forum, MPI: A Message-passing Standard, University of Tennessee, Knoxville, TN, May 1994. [2] M. Ronsse, W. Zwaenepoel, Execution replay for TreadMarks, in: Proceedings of the Fifth Euromicro Workshop on Parallel and Distributed Processing, IEEE Computer Society, London, 1997, pp. 343–350. [3] M. Ronsse, D. Kranzlmüller, RoltMP—replay of lamport timestamps for message passing systems, in: Proceedings of the Sixth Euromicro Workshop on Parallel and Distributed Processing, Madrid, IEEE Computer Society, January 1998, pp. 87–93. [4] L. Levrouw, K. Audenaert, J. Van Campenhout, A new trace and replay system for shared memory programs based on Lamport clocks, in: Proceedings of the Second Euromicro Workshop on Parallel and Distributed Processing, IEEE Computer Society, January 1994, pp. 471–478. [5] L. Lamport, Time, clocks, and the ordering of events in a distributed system, Commun. ACM 21 (7) (1978) 558–565. [6] M. Ronsse, L. Levrouw, K. Bastiaens, Efficient coding of execution-traces of parallel programs, in: J.P. Veen (Ed.), Proceedings of the ProRISC/IEEE Benelux Workshop on Circuits, Systems and Signal Processing, STW, Utrecht, March 1995, pp. 251–258. [7] R. Netzer, Optimal tracing and replay for debugging sharedmemory parallel programs, in: Proceedings of the ACM/ ONR Workshop on Parallel and Distributed Debugging, May 1993, pp. 1–11. [8] J. Gait, A probe effect in concurrent programs, Softw. Pract. Exper. 16 (3) (1986) 225–233. [9] J.-D. Choi, S.L. Min, Race frontier: reproducing data races in parallel-program debugging, in: Proceedings of the Third ACM SIGPLAN Symposium on Principles and Practice of Parallel Programming, vol. 26, July 1991, pp. 145–154. [10] H. Lu, P. Klein, R. Netzer, Detecting race conditions in parallel programs that use one semaphore, in: Proceedings of the Workshop on Algorithms and Data Structures (WADS), Montreal, August 1993. [11] M. Christiaens, K. De Bosschere, Trade, a topological approach to on-the-fly race detection in Java programs, in:
[15]
[16]
687
Proceedings of the Java Virtual Machine Research and Technology Symposium (JVM’01), USENIX, April 2001, pp. 105– 116. F. Mattern, Virtual time and global states of distributed systems, in: Cosnard, Quinton, Raynal, Roberts (Eds.), Proceedings of the International Workshop on Parallel and Distributed Algorithms, Elsevier/North-Holland, Amsterdam, 1989, pp. 215–226. K. De Bosschere, M. Ronsse, Clock snooping and its application in on-the-fly data race detection, in: Proceedings of the 1997 International Symposium on Parallel Algorithms and Networks (I-SPAN’97), Taipei, IEEE Computer Society, December 1997, pp. 324–330. M. Ronsse, K. De Bosschere, JiTI: a robust just in time instrumentation technique, in: Chapter Proceedings of the Workshop on Binary Translation, 2000, Series Computer Architecture News, vol. 29, ACM Press, March 2001, pp. 43–54. T. LeBlanc, J. Mellor-Crummey, Debugging parallel programs with instant replay, IEEE Trans. Comput. C-36 (4) (1987) 471–482. S. Savage, M. Burrows, G. Nelson, P. Sobalvarro, T. Anderson, Eraser: a dynamic data race detector for multithreaded programs, ACM Trans. Comput. Syst. 15 (4) (1997) 391–411. Michiel Ronsse graduated as an Electrotechnical Engineer at Ghent University, Belgium, in 1994. He obtained his PhD in Computer Science from the same university in 1999. His research focusses on execution replay and data race detection for parallel programs.
Mark Christiaens received his Computer Science degree from Ghent University, Belgium, in 1997. He is currently a Research Assistant at the Department of Electronics and Information Systems of the same university, where he is finishing his PhD on data race detection.
Koen De Bosschere received the degrees of Electrotechnical Engineering and Computer Science from Ghent University, in 1986 and 1987, respectively. He obtained his PhD from the same university in 1992. His research interests include computer architecture, systems programming, parallelism and debugging.