Jul 2, 2016 - our study with classical Dynamic Programming methods to solve "Markov Decision ... commonly used for energy stock management, mainly "Model .... 1.4.4 Policies . ...... are usually unknown in practice and estimating the random ..... standard Bellman equations (which is what Value Iteration does). Indeed ...
Hybridization of dynamic optimization methodologies Jérémie Decock
To cite this version: Jérémie Decock. Hybridization of dynamic optimization methodologies. Computational Complexity [cs.CC]. Université Paris Sud - Paris XI, 2014. English. .
HAL Id: tel-01103935 https://hal.inria.fr/tel-01103935 Submitted on 2 Jul 2016
HAL is a multi-disciplinary open access archive for the deposit and dissemination of scientific research documents, whether they are published or not. The documents may come from teaching and research institutions in France or abroad, or from public or private research centers.
L’archive ouverte pluridisciplinaire HAL, est destinée au dépôt et à la diffusion de documents scientifiques de niveau recherche, publiés ou non, émanant des établissements d’enseignement et de recherche français ou étrangers, des laboratoires publics ou privés.
Université Paris-Sud 11 École Doctorale d'Informatique, ED 427 Inria Saclay / LRI
Ph.D. Thesis in Computer Science
Hybridization of dynamic optimization methodologies
By
Jérémie DECOCK advised by Olivier TEYTAUD Presented and publicly defended on November 28 2014 in Orsay, France
Malaterre, Liva Ralaivola, Yacine Chitour, Damien Ernst, Pierre Martinon, Marc Schoenauer, Olivier Teytaud, Pierre-Olivier
With the following jury : HDR, CR Irstea Montpellier, France
(Reviewer)
Professor, University of Aix-Marseille, France
(Reviewer)
Professor, University of Paris-Sud 11, France
(Examiner)
Associate Professor, University of Liège, Belgium
(Examiner)
CR Inria Saclay, CMAP Polytechnique, France
(Examiner)
DR Inria Saclay, LRI/TAO, France
(Thesis Advisor)
HDR, CR Inria Saclay, LRI/TAO, France
(Thesis Advisor)
Malaterre, Ralaivola,
Reviewers :
Pierre-Olivier
HDR, CR Irstea Montpellier, France
Liva
Professor, University of Aix-Marseille, France
Inria Saclay - Île-de-France � TAO Project Team Bât 660 Claude Shannon, Université Paris Sud, Rue Noetzlin, 91190 Gif-sur-Yvette, FRANCE
ii
Université Paris-Sud 11 École Doctorale d'Informatique, ED 427 Inria Saclay / LRI
Thèse de doctorat en Informatique
L'hybridation de Méthodes d'optimisation dynamique
Par
Jérémie DECOCK sous la direction d'Olivier TEYTAUD Présentée et soutenue publiquement le 28 Novembre 2014 à Orsay, France
Malaterre, Ralaivola, Yacine Chitour, Damien Ernst, Pierre Martinon, Marc Schoenauer, Olivier Teytaud,
Devant le jury ci-dessous :
Pierre-Olivier
HDR, CR Irstea Montpellier, France
(Rapporteur)
Liva
Professor, University of Aix-Marseille, France
(Rapporteur)
Professor, University of Paris-Sud 11, France
(Examinateur)
Associate Professor, University of Liège, Belgium
(Examinateur)
CR Inria Saclay, CMAP Polytechnique, France
(Examinateur)
DR Inria Saclay, LRI/TAO, France
(Directeur de Thèse)
HDR, CR Inria Saclay, LRI/TAO, France
(Directeur de Thèse)
Malaterre, Liva Ralaivola, Pierre-Olivier
Rapporteurs : HDR, CR Irstea Montpellier, France Professor, University of Aix-Marseille, France
Inria Saclay - Île-de-France � TAO Project Team Bât 660 Claude Shannon, Université Paris Sud, Rue Noetzlin, 91190 Gif-sur-Yvette, FRANCE
ii
Abstract This thesis is dedicated to sequential decision making (also known as multistage optimization) in uncertain complex environments. Studied algorithms are essentially applied to electricity production ("Unit Commitment" problems) and energy stock management (hydropower), in front of stochastic demand and water in�ows. manuscript is divided in 7 chapters and 4 parts:
The
Part I, "General Introduction",
Part II, "Background Review", Part III, "Contributions" and Part IV, "General Conclusion". The �rst chapter (Part I) introduces the context and motivation of our work, namely energy stock management. "Unit Commitment" (UC) problems are a classical example of "Sequential Decision Making" problem (SDM) applied to energy stock management. They are the central application of our work and in this chapter we explain main challenges arising with them (e.g.
stochasticity, constraints,
curse of dimensionality, ...). Classical frameworks for SDM problems are also introduced and common mistakes arising with them are discussed. We also emphasize the consequences of these - too often neglected - mistakes and the importance of not underestimating their e�ects. Along this chapter, fundamental de�nitions commonly used with SDM problems are described.
An overview of our main contributions
concludes this �rst chapter. The second chapter (Part II) is a background review of the most classical algorithms used to solve SDM problems.
Since the applications we try to solve are
stochastic, we there focus on resolution methods for stochastic problems. We begin our study with classical Dynamic Programming methods to solve "Markov Decision Processes" (a special kind of SDM problems with Markovian random processes). We then introduce "Direct Policy Search", a widely used method in the Reinforcement Learning community.
A distinction is made between "Value Based" and "Policy
Based" exploration methods. The third chapter (Part II) extends the previous one by covering the most classical algorithms used to solve UC's subtleties. It contains a state of the art of algorithms commonly used for energy stock management, mainly "Model Predictive Control",
iii
iv
"Stochastic Dynamic Programming" and "Stochastic Dual Dynamic Programming". We brie�y overview distinctive features and limitations of these methods. The fourth chapter (Part III) presents our main contribution: a new algorithm named "Direct Value Search" (DVS), designed to solve large scale unit commitment problems. We describe how it outperforms classical methods presented in the third chapter. We show that DVS is an "anytime" algorithm (users immediately get approximate results) which can handle large state spaces and large action spaces with non convexity constraints, and without assumption on the random process. Moreover, we explain how DVS can reduce modelling errors and can tackle challenges described in the �rst chapter, working on the "real" detailed problem without "cast" into a simpli�ed model. Noisy optimisation is a key component of DVS algorithm; the �fth chapter (Part III) is dedicated to it. In this chapter, some theoretical convergence rate are studied and new convergence bounds are proved - under some assumptions and for given families of objective functions. Some variance reduction techniques aimed at improving the convergence rate of graybox noisy optimization problems are studied too in the last part of this chapter. Chapter sixth (Part III) is devoted to non-quasi-convex optimization. We prove that a variant of evolution strategy can reach a log-linear convergence rate with non-quasi-convex objective functions. Finally, the seventh chapter (Part IV) concludes and suggests some directions for future work.
Résumé en Français Dans ce manuscrit de thèse, mes travaux portent sur la comparaison et la combinaison de méthodes pour la prise de décision séquentielle (plusieurs étapes de décision corrélées) dans des environnements complexes et incertains. Ces travaux ont été exercés dans le cadre d'un partenariat (� Inria Innovation Lab �) entre l'équipe TAO (LRIInria) et l'entreprise Artelys, spécialisée dans l'optimisation de systèmes complexes. Les méthodes mises au point sont essentiellement appliquées à des problèmes de gestion et de production d'électricité (� unit commitment �) tels que l'optimisation de la gestion des stocks d'énergie (réservoirs d'eau dans les centrales hydrauliques, etc.) dans un parc de production a�n d'anticiper au mieux la �uctuation de la consommation des clients. Le manuscrit comporte 7 chapitres regroupés en 4 parties : Partie I, � Introduction générale �, Partie II, � État de l'art �, Partie III, � Contributions � et Partie IV, � Conclusion générale �. Le premier chapitre (Partie I) introduit le contexte et les motivations de mes travaux, à savoir la résolution de problèmes d' � Unit commitment �, c'est à dire l'optimisation des stratégies de gestion de stocks d'énergie dans les parcs de production d'électricité. Les particularités et les di�cultés sous-jacentes à ces problèmes sont décrites ainsi que le cadre de travail et les notations utilisées dans la suite du manuscrit. Le second chapitre (Partie II) dresse un état de l'art des méthodes les plus classiques utilisées pour la résolution de problèmes de prise de décision séquentielle dans des environnements incertains. Ce chapitre introduit des méthodes générales (i.e. non spéci�ques à notre domaine d'application) et des concepts nécessaires à la bonne compréhension des chapitres suivants (notamment le chapitre 4). Les méthodes de programmation dynamique classiques (algorithmes d'itération de la valeur et d'itération de la politique) et les méthodes de recherche de politique directe y sont présentées. Le 3e chapitre (Partie II) prolonge le précédent en dressant un état de l'art des principales méthodes d'optimisation spéci�quement adaptées à la gestion des parcs de production d'énergie et à leurs subtilités. Ce chapitre présente entre autre les
v
vi
méthodes MPC (Model Predictive Control), SDP (Stochastic Dynamic Programming) et SDDP (Stochastic Dual Dynamic Programming) avec pour chacune leurs particularités, leurs avantages et leurs limites. Ce chapitre complète le précédent en introduisant d'autres concepts nécessaires à la bonne compréhension de la suite du manuscrit. Le 4e chapitre (Partie III) contient la principale contribution de ma thèse : un nouvel algorithme appelé � Direct Value Search � (DVS) créé pour résoudre des problèmes de prise de décision séquentielle de grande échelle en milieu incertain avec une application directe aux problèmes d' � Unit commitment �. Ce chapitre décrit en quoi ce nouvel algorithme dépasse les méthodes classiques présentées dans le 3e chapitre. Cet algorithme innove notamment par sa capacité à traiter des grands espaces d'actions contraints dans un cadre non-linéaire, avec un grand nombre de variables d'état et sans hypothèse particulière quant aux aléas du système optimisé (c'est à dire applicable sur des problèmes où les aléas ne sont pas nécessairement Markovien). Le 5e chapitre (Partie III) est consacré à un concept clé de DVS : l'optimisation bruitée. Ce chapitre expose une nouvelle borne théorique sur la vitesse de convergence des algorithmes d'optimisation appliqués à des problèmes bruités véri�ant certaines hypothèses données. Des méthodes de réduction de variance sont également étudiées et appliquées à DVS pour accélérer sensiblement sa vitesse de convergence. Le 6e chapitre (Partie III) décrit un résultat mathématique sur la vitesse de convergence linéaire d'un algorithme évolutionnaire appliqué à une famille de fonctions non quasi-convexes. Dans ce chapitres, il est prouvé que sous certaines hypothèses peu restrictives sur la famille de fonctions considérée, l'algorithme présenté atteint une vitesse de convergence linéaire. Le 7e chapitre (Partie IV) conclut ce manuscrit en résumant mes contributions et en dressant quelques pistes de recherche intéressantes à explorer.
Acknowledgements First and foremost I want to thank my advisors, Olivier and Marc, for a rich and friendly scienti�c environment they have created. I'm glad to have worked with so highly competent colleagues; many thanks to all the member of the INRIA-TAO team and to Artelys' employees. Once again, I want to thanks a lot Olivier for his consideration, his kindness and his great patience. I am very grateful for everything he has taught me over the last 3 years. I am also very grateful I had the pleasure to work
with
him, and not
for
him.
A lot of thanks to all others PhD students too for the great atmosphere and for the wonderful work environment they all contributed to build. I also thank Marie Carol and Olga for their outstanding work as the secretary of the team. A lot of thanks to the NUTN-OASE team, for their warm welcome and their help during my stay in Taiwan. Also a lot of thanks to Olivier Teytaud, Liva Ralaivola and Michele Sebag for the proofreading of this manuscript. I also thank Yacine Chitour, Damien Ernst, PierreOlivier Malaterre, Pierre Martinon, Liva Ralaivola and Marc Schoenauer for being members of the comity. I wouldn't get results without Grid5000 and Inria's SIC sta�, a lot of thanks to them. Also, a lot of thanks to my family and my friends for their presence and their support. And �nally, a huge thank to my wife and my daughter for giving me the courage to move forward.
vii
viii
ix
To Laura, the love of my life and Léna, my adored daughter.
x
Contents I 1
General Introduction Introduction
3
1.1
Thesis Outline . . . . . . . . . . . . . . . . . . . . . . . . . . . . . . .
3
1.2
Context and Motivation
. . . . . . . . . . . . . . . . . . . . . . . . .
4
1.3
Power Systems
. . . . . . . . . . . . . . . . . . . . . . . . . . . . . .
6
1.4
1.5
1.6
II 2
1
1.3.1
Unit Commitment and Related Problems . . . . . . . . . . . .
6
1.3.2
Challenges . . . . . . . . . . . . . . . . . . . . . . . . . . . . .
10
1.3.3
Investment Problems . . . . . . . . . . . . . . . . . . . . . . .
14
Modelling Sequential Decision Making Problems . . . . . . . . . . . .
15
1.4.1
Decision epochs . . . . . . . . . . . . . . . . . . . . . . . . . .
17
1.4.2
State variables
. . . . . . . . . . . . . . . . . . . . . . . . . .
17
1.4.3
Action variables . . . . . . . . . . . . . . . . . . . . . . . . . .
18
1.4.4
Policies
1.4.5
Random processes
. . . . . . . . . . . . . . . . . . . . . . . .
19
1.4.6
Transition function . . . . . . . . . . . . . . . . . . . . . . . .
20
1.4.7
Reward function and cost function
. . . . . . . . . . . . . . . . . . . . . . . . . . . . . .
19
. . . . . . . . . . . . . . .
21
. . . . . . . . . . . . . . . . . . . . .
22
. . . . . . . . . . . . . . . . . . . . . . . .
22
Optimization and Model Errors 1.5.1
Optimization error
1.5.2
Objective function and constraint errors
. . . . . . . . . . . .
22
Main Contributions . . . . . . . . . . . . . . . . . . . . . . . . . . . .
23
1.6.1
Direct Value Search . . . . . . . . . . . . . . . . . . . . . . . .
23
1.6.2
Noisy Optimization . . . . . . . . . . . . . . . . . . . . . . . .
25
1.6.3
Non quasi-convex functions
25
. . . . . . . . . . . . . . . . . . .
Background Review
27
Classical Algorithms for Sequential Decision Making xi
29
CONTENTS
xii
2.1
Backward Induction
2.2 2.3
2.4
3
Value Iteration
. . . . . . . . . . . . . . . . . . . . . . . . . . . . . .
30
Policy Iteration
. . . . . . . . . . . . . . . . . . . . . . . . . . . . . .
34
2.3.1
Convergence . . . . . . . . . . . . . . . . . . . . . . . . . . . .
34
2.3.2
Notable Policy Iteration variants
Direct Policy Search
. . . . . . . . . . . . . . . .
34
. . . . . . . . . . . . . . . . . . . . . . . . . . .
36
39
3.1
Model Predictive Control . . . . . . . . . . . . . . . . . . . . . . . . .
40
3.2
Stochastic Dynamic Programming . . . . . . . . . . . . . . . . . . . .
41
3.3
Stochastic Dual Dynamic Programming . . . . . . . . . . . . . . . . .
44
3.4
Approximate Stochastic Dynamic Programming (ADP) . . . . . . . .
45
3.5
Anticipativity and Cross-validation
. . . . . . . . . . . . . . . . . . .
47
3.6
Other Methods
. . . . . . . . . . . . . . . . . . . . . . . . . . . . . .
47
Contributions
49
Direct Value Search
51
4.1
Introduction . . . . . . . . . . . . . . . . . . . . . . . . . . . . . . . .
51
4.1.1
Motivation . . . . . . . . . . . . . . . . . . . . . . . . . . . . .
51
4.1.2
Direct Value Search Principle
4.1.3
Detailed algorithm
4.2
4.3
5
29
Classical algorithms for Power systems
III 4
. . . . . . . . . . . . . . . . . . . . . . . . . . .
. . . . . . . . . . . . . . . . . .
54
. . . . . . . . . . . . . . . . . . . . . . . .
60
Experiments . . . . . . . . . . . . . . . . . . . . . . . . . . . . . . . .
62
4.2.1
Settings
. . . . . . . . . . . . . . . . . . . . . . . . . . . . . .
62
4.2.2
Baselines . . . . . . . . . . . . . . . . . . . . . . . . . . . . . .
63
4.2.3
Results . . . . . . . . . . . . . . . . . . . . . . . . . . . . . . .
64
Conclusion . . . . . . . . . . . . . . . . . . . . . . . . . . . . . . . . .
64
Noisy Optimization
69
5.1
Motivation . . . . . . . . . . . . . . . . . . . . . . . . . . . . . . . . .
69
5.2
Lower bounds on runtimes . . . . . . . . . . . . . . . . . . . . . . . .
70
5.2.1
Introduction . . . . . . . . . . . . . . . . . . . . . . . . . . . .
70
5.2.2
Main results . . . . . . . . . . . . . . . . . . . . . . . . . . . .
79
5.2.3
Conclusion . . . . . . . . . . . . . . . . . . . . . . . . . . . . .
80
5.3
Variance reduction
. . . . . . . . . . . . . . . . . . . . . . . . . . . .
83
5.3.1
Introduction . . . . . . . . . . . . . . . . . . . . . . . . . . . .
83
5.3.2
Algorithms
. . . . . . . . . . . . . . . . . . . . . . . . . . . .
89
5.3.3
Experiments . . . . . . . . . . . . . . . . . . . . . . . . . . . .
89
CONTENTS 5.3.4
6
Conclusions
. . . . . . . . . . . . . . . . . . . . . . . . . . . .
92
Convergence in non-quasi-convex problems
97
6.1
Introduction . . . . . . . . . . . . . . . . . . . . . . . . . . . . . . . .
97
6.2
A Simple Pattern Search Method
. . . . . . . . . . . . . . . . . . . .
99
6.3
6.4
IV 7
xiii
6.2.1
The Objective Function
. . . . . . . . . . . . . . . . . . . . .
99
6.2.2
Conditioning
. . . . . . . . . . . . . . . . . . . . . . . . . . .
99
6.2.3
Good Sampling . . . . . . . . . . . . . . . . . . . . . . . . . .
99
6.2.4
Discussion on Assumptions . . . . . . . . . . . . . . . . . . . . 101
Mathematical Analysis . . . . . . . . . . . . . . . . . . . . . . . . . . 101 6.3.1
Main Theorem
6.3.2
Proof . . . . . . . . . . . . . . . . . . . . . . . . . . . . . . . . 102
. . . . . . . . . . . . . . . . . . . . . . . . . . 101
6.3.3
Application to Quadratic Functions . . . . . . . . . . . . . . . 105
Discussion and Conclusion . . . . . . . . . . . . . . . . . . . . . . . . 108 6.4.1
Extensions . . . . . . . . . . . . . . . . . . . . . . . . . . . . . 108
6.4.2
Limitations
. . . . . . . . . . . . . . . . . . . . . . . . . . . . 109
General Conclusion
Conclusion
111 113
7.1
A general trend in arti�cial intelligence: reducing the model error
7.2
Summary of Contributions . . . . . . . . . . . . . . . . . . . . . . . . 114
7.3
Direct Value Search Bene�ts . . . . . . . . . . . . . . . . . . . . . . . 115
7.4
Further work
A Appendix
. . 113
. . . . . . . . . . . . . . . . . . . . . . . . . . . . . . . 116
131
xiv
CONTENTS
List of Figures
1.1
Consequences of the cascading failure on September 28th 2003 . . . .
12
1.2
Input-output curve of a typical steam turbine generator . . . . . . . .
13
1.3
Characteristics of a steam turbine generator with four steam admission valves
. . . . . . . . . . . . . . . . . . . . . . . . . . . . . . . . . . .
14
1.4
Sequential Decision Making Problems . . . . . . . . . . . . . . . . . .
16
3.1
Receding horizon
. . . . . . . . . . . . . . . . . . . . . . . . . . . . .
42
3.2
Tactical horizon . . . . . . . . . . . . . . . . . . . . . . . . . . . . . .
42
3.3
Tactical horizon with Receding
. . . . . . . . . . . . . . . . . . . . .
43
4.1
Direct Value Search test case . . . . . . . . . . . . . . . . . . . . . . .
66
4.2
Direct Value Search results . . . . . . . . . . . . . . . . . . . . . . . .
68
4.3
Direct Value Search results with rescaled outputs
. . . . . . . . . . .
68
5.1
Expected values of
. . . . . . . . . . . . . .
72
5.2
Pairing and strati�cation on the power system test case . . . . . . . .
93
6.1
Six graphical representations of "easy" objective functions
98
6.2
The linear convergence proof in a nutshell
fx∗ ,β,γ
with respect to
xv
x
. . . . . .
. . . . . . . . . . . . . . . 102
xvi
LIST OF FIGURES
List of Tables
1.1
Tested Unit Commitment problems . . . . . . . . . . . . . . . . . . .
24
4.1
Direct Value Search vs constant marginal valorization . . . . . . . . .
67
5.1
Convergence rates for noisy optimization: a state of the art . . . . . .
82
5.2
E�ciency of pairing in the continuous case . . . . . . . . . . . . . . .
95
5.3
Pairing results . . . . . . . . . . . . . . . . . . . . . . . . . . . . . . .
96
xvii
xviii
LIST OF TABLES
List of Algorithms 1
Backward Induction
. . . . . . . . . . . . . . . . . . . . . . . . . . .
31
2
Value Iteration
. . . . . . . . . . . . . . . . . . . . . . . . . . . . . .
33
3
Policy Iteration
. . . . . . . . . . . . . . . . . . . . . . . . . . . . . .
35
4
Direct Policy Search optimisation procedure
5
Direct Policy Search simulation procedure
6
Stochastic Dual Dynamic Programming . . . . . . . . . . . . . . . . .
46
7
Self-Adaptive Evolution Strategy with reevaluations . . . . . . . . . .
59
8
Optimization of DVS parameters (o�ine SR) . . . . . . . . . . . . . .
60
9
Performing a simulation with DVS (online DMR)
. . . . . . . . . . .
61
10
Noisy optimization framework . . . . . . . . . . . . . . . . . . . . . .
71
11
R-EDA . . . . . . . . . . . . . . . . . . . . . . . . . . . . . . . . . . .
73
12
Bernstein race between 3 points . . . . . . . . . . . . . . . . . . . . .
74
13
The Simple Evolution Strategy algorithm . . . . . . . . . . . . . . . . 100
xix
. . . . . . . . . . . . . .
37
. . . . . . . . . . . . . . .
37
xx
LIST OF ALGORITHMS
List of Acronyms ADP Approximate Dynamic Programming DP Dynamic Programming DPS Direct Policy Search DVS Direct Value Search ES Evolution Strategy CMA-ES Covariance Matrix Adaptation Evolution Strategy SA-ES Self-Adaptive Evolution Strategy GA Genetic Algorithm LP Linear Programming MDP Markov Decision Process MILP Mixed Integer Linear Programming MPC Model Predictive Control QP Quadratic Programming RL Reinforcement Learning SDP Stochastic Dynamic Programming SDDP Stochastic Dual Dynamic Programming RBF Radial Basis Function SVM Support Vector Machine
xxi
xxii
LIST OF ALGORITHMS
Part I General Introduction
1
Chapter 1 Introduction
1.1 Thesis Outline This �rst chapter introduces the context and motivation of our work, namely energy stock management.
Decision Making
Unit Commitment problems are a classical example of Sequential
problem applied to energy stock management. They are the cen-
tral application of our work and we will explain main challenges arising with them (e.g. stochasticity, constraints, curse of dimensionality, . . . ). In this chapter, classical frameworks for Sequential Decision Making problems will be introduced and common mistakes arising with them will be discussed. We will emphasize the consequences of these � too often neglected � mistakes and the importance of not underestimating their e�ects. Along this chapter, fundamental de�nitions commonly used with Sequential Decision Making problems will be described.
An overview of our main
contributions will conclude this �rst chapter. The second chapter is a background review of the most classical algorithms used to solve Sequential Decision Making problems. Since the applications we try to solve are stochastic, we there focus on resolution methods for stochastic problems. We begin our study with classical
Processes
Dynamic Programming
methods to solve
Markov Decision
(a special kind of Sequential Decision Making problems with Markovian
random processes). We then introduce
Direct Policy Search,
a widely used method
in the Reinforcement Learning community. A distinction will be made between
based
and
policy based
value
exploration methods.
The third chapter extends the previous one by covering the most classical algorithms used to solve Unit Commitment's subtleties. It contains a state of the art of algorithms commonly used for energy stock management, mainly Model Predictive Control, Stochastic Dynamic Programming and Stochastic Dual Dynamic Program-
3
CHAPTER 1.
4
INTRODUCTION
ming. We will brie�y overview distinctive features and limitations of these methods. The fourth chapter presents our main contribution: a new algorithm named
rect Value Search,
Di-
designed to solve large scale unit commitment problems. We will
describe how it outperforms classical methods presented in the third chapter. We will show that Direct Value Search is an
anytime
algorithm (users immediately get
approximate results) which can handle large state spaces and large action spaces with non convexity constraints, and without assumption on the random process. Moreover, we will explain how Direct Value Search can reduce modelling errors and can tackle challenges described in the �rst chapter, working on the "real" detailed problem without "cast" into a simpli�ed model. Noisy optimisation is a key component of Direct Value Search algorithm; the �fth chapter is dedicated to it. In this chapter, some theoretical convergence rate will be studied and new convergence bounds will be proved � under some assumptions and for given families of objective functions. Some variance reduction techniques aimed at improving the convergence rate of graybox noisy optimization problems will be studied too in the last part of this chapter. Chapter sixth is devoted to non-quasi-convex optimization.
We prove that a
variant of evolution strategy can reach a log-linear convergence rate with non-quasiconvex objective functions. Finally, the seventh chapter concludes and suggests some directions for future work.
1.2 Context and Motivation Energy management problems have received a considerable attention in recent years.
French Environment and Energy Management Agency (ADEME) to work on several strategic and priority For instance, in France, the government recently undertook the
1
project on this thematic (as part of the "Investissement d'avenir" program ). As explained in [1] and [2], among the likely reasons behind this rise of interest, we could mention the economic weight of energy market and the strategic and political importance of this sector for many countries (especially since 1970s energy crisis). Indeed, electricity is an essential consumer goods of which the global demand and
2
production is rising sharply for some years . Because of the increasing demand in newly industrialized countries, the global energy demand should grow by more than
1 http://investissement-avenir.gouvernement.fr/ 2
For instance, China's electricity production increased from 621TWh to 4716TWh between 1990 and 2012 (respectively 5% and 21% of the world electricity production) as reported in [3]
1.2. CONTEXT AND MOTIVATION
5
one-third over the period to 2035 according to the
International Energy Agency (IEA)
[4]. As fossil fuels remain the main primary energy sources for the world electricity production nowadays [3], the foreseeable scarcity and the geographical concentration of these fossil fuels cause a growing rivalry between states to access energy. Another explanation to this rise of interest for energy management is the sudden awareness of the global warming and other deterioration of the environment and global health caused by fossil fuels exploitation [5, 6]. As a result, new environmental constraints have appeared for energy producers.
Kyoto Protocol
3
is probably the
most famous one. Adopted in 1997 by 84 countries and joined by 191 states since, the Protocol's major feature is that it has mandatory targets on reducing greenhouse-
4
gas
emissions for the world's leading economies which have accepted it. As a result,
these constraints pushed the development of "green"
5
renewable and sustainable
energies. Since hydroelectric is almost already developed at its full capacity in many countries and as there exists a noticeable pressure of public opinion against nuclear power plants (especially since the Fukushima nuclear disaster in Japan in 2011 [7, 8]), the global trend in many countries [9, 10] is to develop solar power plants and wind turbines. But these fast-growing energy sources make the exploitation strategy more di�cult to de�ne for energy producers. depend on weather conditions.
Indeed wind and solar energy production
Their production level is often di�cult to predict
and can vary a lot. Another good reason to be preoccupied with energy management is the growing interconnection of electrical networks which increases the negative impact of potentials blackout (by the domino e�ect). Avoiding these blackout requires more attention and better investment and exploitation strategies by energy producers. Finally, the worldwide industrial and economical competition prompts towards a cheap energy and therefore further optimized exploitation and investment strategies. To sum up, electricity makers have to face new di�cult problematics and the environmental, economical and political consequences of inappropriate choices are more and more serious. Within this context, prospective models are a very valuable decision support. They are commonly used to forecast and optimise the short and mid term electricity production likewise long-term investment strategies. Our motivation in this thesis is to create new decision aids tools �tted for the latest political, economical, environmental and sociological constraints. Our goal is to help electricity managers to �nd better exploitation and investment strategies on
3 See
http://unfccc.int/2860.php
4 Carbon
dioxide (C02), Methane (CH4), Nitrous oxide (N20), Hydro�uorocarbons (HFCs), Per�uorocarbons (PFCs) and Sulphur hexa�uoride (SF6) 5 Greenhouse gas emission-free
CHAPTER 1.
6
INTRODUCTION
di�erent scenarios, with larger, more detailed and more realistic models (section 1.5).
1.3 Power Systems The problems we try to solve in this thesis are mainly energy management problems and in particular
Unit Commitment
problems (see [11]).
thermal economic dispatch, coordination of hydroelectric and thermal (and sometimes pumpedstorage), proper commitment, optimal economic maintenance scheduling, . . . We will There exist many others classic problems for energy management like
not consider them in this manuscript as they are more speci�c and less important than Unit Commitment to achieve our goal. But for the interested readers, some of these problems are de�ned in [11].
1.3.1
Unit Commitment and Related Problems
Unit Commitment problems are
stage optimization problems)
Sequential Decision Making
where an energy producer (the
to meet a certain energy demand (unknown in advance).
6
multidecision maker) has
problems
(or
In order to satisfy this
demand, the decision maker has several power plants like:
•
hydroelectric power stations (dams),
•
thermal plants (coal power plants, fossil-fuel power stations, gas turbine plants, nuclear plants, geothermal power plants, . . . ),
•
solar power plants,
•
wind turbines,
•
...
These power plants are composed of production units (also named generators). All these plants and production units have di�erent properties, di�erent constraints and di�erent exploitation costs making them more or less appropriate in a given situation [11]. The goal for the decision maker is to �nd the optimal operating strategy (or
policy)
which satisfy consumers energy demand for a given period of time at the
lowest production cost possible. To sum up, Unit Commitment is the art and science of choosing which power plants to switch on and o� over time to satisfy consumers demand at the lowest cost. These choices are made considering the features and the
6
Sequential Decision Making problems are described in section 1.4. Classical methods to solve these problems are studied in chapter 2 and 3.
1.3. POWER SYSTEMS cost of each power plants, but also endogenous factors (e.g. the
7
state of power plants,
the energy stocks in dams, . . . ), varied constraints (laws, energy transportation, . . . ) and uncertain exogenous factors with more or less limited forecast (e.g. consumers demand, weather, . . . ). Usually, the following constraints have to be satis�ed during the optimization process [12, 13, 14]:
•
System power balance: demand, losses, exports.
•
System reserve requirement: safety stocks required in case of technical incident.
•
Unit initial production level: the level at which it is operating before the �rst time period of our schedule.
•
Unit minimum and maximum generation level (in MW).
•
Unit rate limits: generation level inertia.
•
Unit minimum-up time: this is the minimum number of hours a generator must be on once turned on.
•
Unit minimum-down time: this is the minimum number of hours a generator must be o� once turned o�.
•
Unit start-up and shut-down ramps: this is the maximum amount that a generator can increase or decrease production in an hour.
•
Unit status restrictions: must-run, �xed-MW, unavailable, available.
•
Unit fuel availability (or for instance stock volume for hydro and wind for wind turbine).
•
Plant crew constraints: the number of units that can start at the same time in a particular plant.
•
Electricity transmission constraints (electricity transportation is constrained by the transmission network topology, transmission lines have limited capacities and are subject to losses).
•
Various plant type and unit type speci�c constraints (fuel, coal, nuclear, hydro, wind turbine, ...). E.g. for fuel and coal thermal plants:
� Unit �ame stabilization fuel mix (dual fuels are used for �ame stabilization when the units operates at low output levels, e.g. when start-up).
� Unit dual or alternate fuel usage. � Unit start-up fuel consumption coe�cient. � Unit fuel consumption formula.
CHAPTER 1.
8
INTRODUCTION
� System environmental constraints (e.g. allowance of CO2 emissions) � ... Thus, generic Unit Commitment problems can be formulated as the following mathematical optimization problem:
min s.t.
Operational Costs
(1.1)
constraints
Operational costs to minimize generally consist of a sum of following terms (formulations are taken from [12, 13, 14]):
•
Energy production costs: for instance Eq. (1.2) could be applied in the case of thermal plants;
•
Start-up costs: expressed as a function of the number of hours the unit has been down (exponential when cooling and linear when banking) (Eq. (1.3));
•
Shut-down costs: a �xed price for each unit per shut-down;
•
Maintenance costs: calculated using base maintenance cost and incremental maintenance cost (Eq. (1.4))
F Ci,t (Pi,t ) = Fi,t .Hi,t (Pi,t ) where
F Ci,t (Pi,t ) Pi,t Fi,t Hi,t (Pi,t ) for unit
i
at time step
t
is the fuel cost (e/h) is the power level (MW) is the fuel cost (e/MBTu) is the heat rate curve (MBTu/h)
with BTu the British Thermal Unit (1 BTu
� STi = T Si Fi + 1 − exp−Di /ASi BSi Fi + M Si where
STi T Si Di ASi BSi M Si
(1.2)
is the startup cost is the turbine startup energy (MBTu) is the number of hours down is the boiler cool-down coe�cient is the boiler startup energy (MBTu) is the startup maintenance cost
'
1055 Joules).
(1.3)
1.3. POWER SYSTEMS
9
M Ci (Pi ) = BMi + IMi Pi
(1.4)
where
M Ci (Pi ) BMi IMi
is the maintenance cost is the base maintenance cost is the incremental maintenance cost
Decision variables (free variables) are generally [13, 14]:
•
the list of units to be on and o�;
•
the power generation for each unit;
•
the reserve margins;
•
plant or unit speci�c variables.
Depending on the type of plants, the model choices and the resolution horizon, the following random variables may be considered:
•
the electricity demand;
•
the electricity production market price (fuel price, ...);
•
the weather, which in�uences the electricity demand and the electricity production (especially for hydroelectric power stations, solar plants and wind turbines).
Depending on the type of power plants considered and the model choices, optimization is performed for very di�erent horizons, going from the short term (some days) to the long-term (several years) and using very di�erent time step resolutions (from hours to months). The complexity of the problem also depends on the number of units optimized (up to hundreds units for some large scale models like the one used in [15]). Our motivation is to design numerical methods (algorithms) to help the decision maker to choose the best possible decisions. As we saw in section 1.2, these problems are very important and bad choices may have serious consequences. We will see in section 1.3.2 that these problems can also be very challenging, and are commonly used as benchmark in the
Operations Research
(RL) community (as we do here).
(OR) and
Reinforcement Learning
CHAPTER 1.
10
1.3.2
INTRODUCTION
Challenges
Power systems problems like Unit Commitment have existed for several decades. They are complex problems. Resolution methods exist but in most cases, with realistic models, the optimal solutions cannot be reached due to the excessive computation time requirement [16]. As a result, these resolution methods aim at �nding e�ciently a nearly optimal solution. As any slight improvement on proposed solutions may save millions of euros for decision makers [11], there is still a relevance for research on power systems algorithms. Moreover, new challenges recently appeared like those described in section 1.2: the recent and profound mutation on the operation of electric systems due to deregulation, the increase in the interconnections and the distribution networks size, the irregular and hardly predictable production with renewable energies, . . . With these new needs, some power systems problems became much more challenging and classical algorithms are unsuited. In this section, main (old and new) power systems challenges are described.
State Space and Action Space Dimensions Unit Commitment is a large-scale optimisation problem, often dealing with hundreds
7
of generating units in a region , making it di�cult to �nd the optimal solution in an acceptable amount of time [15]. Thus, the number of state variables, i.e. variables necessary for describing the current state of the system, can be large. The physical system has already tenths of variables for describing water levels in dams, just for France alone. A detailed model must include the variables accounting for the current power output of thermal plants.
Taking into account costs associated to humans
operating the machine introduces additional variables. The variables corresponding to the demand forecasts and wind/solar power should also be taken into account. The number of state variables also increases with the number of time steps. As far as that goes, the action space, i.e. the set of possible decisions, is huge. As for state space, its size is proportional to the number of generators and the number of time steps. Many methods aggregate several time steps into an operational horizon. This means that the number of time steps is reduced, and it helps a lot for ensuring that constraints are satis�ed, but the action space becomes bigger - the number of actions is multiplied by the number of aggregated time steps. Some of these state and decision variables are integers or binaries (e.g. the on/o� status of generators). Thus, the problem to be optimized becomes much more di�cult to solve.
7 For
combinatorial and
This challenge is often addressed by simplifying the
instance, in France, there were 630 production units in 2011 [17, 18].
1.3. POWER SYSTEMS model using
relaxation methods
11
but this approximation yields suboptimal solutions
8
which may cost millions of euros per year to decision makers .
Stochasticity Unit Commitment are stochastic problems that are often solved like deterministic problems with a predicted scenario in order to make it simpler to solve. But ignoring uncertainties may lead to hazardous results as exposed in [20]. Unit Commitment have di�erent sources of randomness [2].
Variations in electricity demand.
The demand curve is made of daily, weekly
and seasonal cycles (roughly corresponding to the global activity of consumers). But this demand is very sensitive to weather conditions and unpredicted weather changes may cause unpredicted demand changes. For example, in France, a drop in ◦ temperature of 1 C during winter usually leads to an increased consumption of about 1400 MW. Similarly, the di�erence in cloud cover can cause variations of about 6000 MW [21].
Variations in electricity production.
The electricity production can vary more
or less for various reasons. Firstly, technical hitch in production units or transmission network can cause a sudden and unexpected variation of production (for instance a failure in a generator or a power line breakdown).
Then, some production meth-
ods, like most of those based on renewable energies, are naturally irregular (and hardly predictable). As the generation mix shifts to include more and more of these intermittent renewable energy, the production level is more and more a�ected by variations [20]. This variability involves di�erent time constants [22] depending on the type of unit:
• • •
multiannual variations for biomass; seasonal and annual variations for hydroelectricity; hourly variations (or less) for wind turbines and solar power plants.
The latter is the most problematic. Indeed, these variations are less regular and more di�cult to forecast [20].
Moreover, signi�cant variations in the production
level may occur for smaller periods of time than the model's time resolution (often a hourly resolution) and thus are ignored in simulations.
8 see
the case of PJM [19], a regional transmission organization (RTO) in USA, whose annual bid costs savings were estimated at $60 million since they switched to Mixed Integer Programming solvers.
CHAPTER 1.
12
INTRODUCTION
Decision makers usually deal with the variations in electricity production by increasing their reserve capacity and use it whenever it is necessary. safe but economically ine�cient. problems using
This is rather
Another approach is to solve Unit Commitment
robust decision making
methods like
stochastic programming
[23]. A
large number of scenarios is necessary to have con�dence in the approach, and this signi�cantly increases the complexity of the problem.
Variations in interconnected networks.
Regional or national electric networks
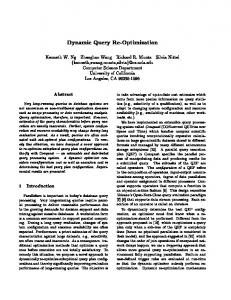
are more and more interconnected (for economical and technical reasons). For instance, European countries are connected to each others. As a result, any big technical hitch in a region can propagate to the other and cause cascading failure by domino e�ect. For instance, on September 28, 2003, an incident on a transmission line in Switzerland ensued an almost total blackout in Italy (see Fig.1.1).
Power variation around the average value 50% 40% 30% 20%
% France % Switzerland
10%
% Austria % Slovenia
0% -10% -20%
3.15.00
3.00.00
2.45.00
2.30.00
2.15.00
2.00.00
1.45.00
1.30.00
1.15.00
1.00.00
-30%
Figure 1.1: Consequences of the cascading failure on September 28th 2003 between 1:00 AM and 3:30 AM. The power went o� at about 3:00 AM in Italy. This �gure shows the power variation around the average level in interconnections with each neighboring country of Italy. These countries had to face a sudden and unexpected
Autorita per l'Energia Elettrica e il Gas Commission de Régulation de l'Electricité [24]
increase in the power demand. Source:
.
and
1.3. POWER SYSTEMS
13
Constraints and objective function As we saw in section 1.3.1, many di�erent constraints apply in Unit Commitment problems.
Some of these constraints may be non-linear (with respect to decision
9
variables) or non-convex .
Similarly, the objective function may be non-linear or
non-convex. For instance:
•
the input-output curve of steam turbine generators is non-linear [11] (see Fig. 1.2);
•
the input-output curve of hydroelectric unit is non-linear [11];
•
the input-output curve of steam turbine generators with multiple admission valves is non-convex [11] (see Fig. 1.3);
combined cycle units
•
the input-output curve of
•
some hydroelectric units are non-convex with respect to the stock level (as the
is non-convex [11];
output e�ciency can depends on the water drop height on turbines).
Figure 1.2:
Input-output curve of a typical steam turbine generator (coal, fuel, . . . ).
with H = British thermal unit (Btu) per hour heat input to the unit (or MBtu/h) and P = Output power (in MW). Source:
Power Generation, Operation and Control
[11].
9
Conventionally, the term convex (or non-convex) objective function implicitly means convex (or non-convex) function within minimization problems and concave (or non-concave) function within maximization problems.
CHAPTER 1.
14
Figure 1.3:
INTRODUCTION
Characteristics of a steam turbine generator with four steam admission
valves, with H = British thermal unit (Btu) per hour heat input to the unit (or MBtu/h) and P = Output power (in MW). Source:
and Control
Power Generation, Operation
[11].
These non-linear and non-convex constraints and objective functions make the problem even more di�cult to solve. A classical solution adopted by most decision makers is to transform the non-linear problem into a linear one or the non-convex problem into a convex one. But we will see in section 1.5 that good solutions for the simpli�ed model can be bad solutions for the actual one and thus, directly solving the non transformed system may be more desirable.
1.3.3
Investment Problems
So far, we have considered how to optimize the exploitation of power plants. interesting related problem is the investment problem.
An
It attempts to answer the
following question: when, where and how much should we invest on new capacities
1.4. MODELLING SEQUENTIAL DECISION MAKING PROBLEMS
15
(plants, transmission lines, . . . ) in order to optimize pro�ts, keep the system in a reasonable condition and adapt it to the future changes of its environment in the long run? In the case of long-term investment studies (several decades), there are nonstochastic uncertainties, which are usually handled by considering several scenarios. These uncertainties are typically:
•
political constraints: nuclear power or not, real
CO2
penalization or not, mas-
sive renewable sources or not, geopolitical events (for instance the Russian gas), ...
•
technological breakthroughs;
•
climate change uncertainty (green gas e�ect, . . . );
•
uncertainties about the evolution of demand and usage (expansion of electric cars, . . . );
•
prices (oil, gas) which highly depend on the international context;
Moreover, the investment part in Unit Commitment strongly increases the state space and action space dimensions, as state variables should describe the current �nancial energy portfolio, including contracts at the scale of days, weeks, months, years. These long-term investment studies are extremely important, as they involve investments in hundreds of billions of euros � and they have to be made with huge uncertainties.
We will, in this work, develop algorithms suitable for the former
challenges but the non-stochastic uncertainties are not considered.
1.4 Modelling Sequential Decision Making Problems Sequential Decision Making is a class of optimization problems (also named multistage optimization problems or dynamic programs in [25]) where an agent (also named controller) interacts with a given environment (also named system) over time. In Sequential Decision Making, the time is discretized and interactions between the agent and the environment occur for a certain number of
time steps
(or
stages).
state and the agent can modify this state actions (or decisions) on the environment. The result of successive actions
The environment starts in a given initial by taking
is correlated as actions taken at a given time step in�uence future actions.
Thus,
CHAPTER 1.
16
INTRODUCTION
Sequential Decision Making problems are more complex than a series of multiple independent decision making problems since the agent has to consider the long-term e�ect of his decisions. At each time step, the actions of the agent alter the state of the environment according to a stochastic
transition model.
To choose among the
possible actions, the agent uses information given by the environment. Each time an action is executed, a resulting reward is transmitted to the agent. This reward usually depends on the new state of the environment but it sometimes may also depend on the former state and the executed action. The goal for the agent is to take actions such that its global
utility
is maximized. This utility is either the sum
of all rewards gained over time or a discounted sum of these rewards.
Agent Next state + Reward
Actions
Stochastic process
Environment
Figure 1.4: Sequential Decision Making Problems This problem is depicted in Fig.1.4: starting from a given initial state, the environment sends information about its state to the agent; the agent uses this information to alter the environment with an action; this action updates the environment's state according to a (stochastic)
transition model;
the environment sends back infor-
mation about its new state and the immediate reward resulting in this action; the agent uses those information to take another action on the environment; this action updates the environment's state according to the transition model; the environment sends back information about its new state and the immediate reward resulting in this action; and so forth until the environment is in a
terminal state
(i.e. no further
action is required). Later in this manuscript, we will refer to Markov Decision Processes. This is a particular case of Sequential Decision Making problems where the transition model 0 is Markovian (i.e. the probability of reaching state s from the state s and an action
a
depends only on
s
and
a,
not on the history of earlier states).
Unless speci�ed otherwise, we assume a fully observable environment (i.e.
the
environment does not "hide" information to the agent) and a Markovian transition
1.4. MODELLING SEQUENTIAL DECISION MAKING PROBLEMS
17
model. In following sections, we give further details on de�nitions and chosen notations for the di�erent elements composing a Sequential Decision Making problem. These
Operations Research community, and from [27] and [28] for the Reinforcement Learning de�nitions and notations are mainly taken from [26] and [25] for the control and community.
1.4.1
Decision epochs
Decision epochs are the times at which a decision has to be made by the agent, or in other words, the times at which an action has to be executed by the agent. In this manuscript, we only consider the case of discrete decision epochs (thus called
time steps).
For the interested readers, [26] gives additional information about the
continuous time setting, where decisions are made continuously. Note that discrete time steps don't necessarily mean equally spaced decision epochs; time steps simply de�ne time when the agent has to execute an action. When relevant, we will index variables with their corresponding time step t, using convention from [25]: a variable at time
t,
variable
Xt+1
Xt
indexed by
t
is deterministic at time
t.
While
could be both deterministic or stochastic, depending on the
context. When relevant, variables are indexed with the iteration index the distinction between the actual time step
t
i
in order to make
and the iteration index
i
of iterative
resolution methods.
1.4.2
State variables
The state variables could contain information about the physical state of the agent, pure information received from the environment or information about history.
To
make things as clear as possible, we borrow the following de�nition from [25]:
State variable. A state variable is the minimally dimensioned function of history that is necessary and su�cient to compute the decision function, the transition function, and the contribution function. According to this de�nition, the state variable includes enough of the observable information to compute the optimal decision (if this exists with respect to the observable information).
Moreover, this de�nition makes the distinction between
Markovian (i.e. history independent) processes and non-Markovian (i.e. history dependent) processes almost useless. Note that this is true from the modelling point
CHAPTER 1.
18
INTRODUCTION
of view, but actually, this distribution still have a big impact on the computational cost when solving or simulating problems. If the history information is required to make decision, to compute the next state, or to compute rewards resulting from an action, then it should be included in the state variable. Otherwise, there is no reason to include it. Similarly, if the time is required to make decision, to compute the next state, or to compute rewards, then it should be included in the state variable. Otherwise, there is no reason to include it. We will generally refer to state variables as possible states.
X
x ∈ X,
with
X
referring to the set of
can be �nite, in�nite but countable, or in�nite and uncountable.
It is also common to use
s and S
respectively as a notation for the state variable and
the state space, but it tends to imply that the state space is �nite, as it is often used in the framework of �nite Markov Decision Process (like in chapter 2). This set is determined by the environment, that is to say by the nature of the problem and by the choices of the model. Some resolution methods require to have a discrete state space, and will thus need to �rst discretize a continuous state space before doing anything else. We use a bold font for the state variable as in the general case
1.4.3
x and s are vectors.
Action variables
As de�ned previously, actions (or decisions or controls) are the way for the agent to act on the environment in order to achieve its goal. They are the free variables to be optimized by the agent.
a ∈ A (or sometimes u ∈ U ), where A is the set of d is also used when we talk about decisions. As for
Usually, actions are denoted possible actions. The notation the state space,
A
can be �nite, in�nite but countable, or in�nite and uncountable.
We use the bold notation for the action variable as in the general case
a
is a vector.
Feasible actions (or legal actions) are actions that are possible from a certain state x and/or at some time step t. In this case, the action set is denoted At (x) or A(x) depending on whether the time determines the action set or not. Usually, environments are de�ned such that there is one unique action set regardless of the current state and time step.
In this case, the action set is simply denoted
A
for
clarity. This space is determined by the environment, that is to say by the nature of the problem and by the choices of the model.
As for the state variables, some
resolution methods require to have a discrete action space, and will thus need to �rst discretize a continuous action space before doing anything else.
1.4. MODELLING SEQUENTIAL DECISION MAKING PROBLEMS
1.4.4
19
Policies
When we are solving a Sequential Decision Making problem, we are looking for an optimal (or almost optimal)
policy
(or
strategy
or
controller)
� directly or not
depending on the resolution algorithm (more on this in chapter 2).
A policy is a
function that maps from states to actions. As Sequential Decision Making problems are stochastic, we cannot rely on a simple list of actions to execute as a solution to the problem; because of the uncertainty, the best action to each possible future state should be considered. An optimal policy tells us which action should be executed, for each possible state, in order to maximize (or minimize) the expected reward (or cost) it has been designed for. Usually, policies are denoted
π:S→A s 7→ π(s) π ∗ . A policy can be stationary if it does not depends on time (i.e. the same policy π is used for every time steps of the problem) or non-stationary if it depends on time (i.e. a distinct policy πt has to be made for each time steps t of the problem).
with
π ∈ Π
1.4.5
and optimal policies are denoted
Random processes
Random processes refer to variables that take random values. These variables exert an in�uence on the transition function outcome (that is to say the next state). According to [25], we consider that this �ow of information arrive continuously to the agent. We note
ωt
the information available at time
t.
These random variables are de�ned by a probability density function denoted
pωt (ω t = ω)
(sometimes written
pωt (ω)
for short). These probability distributions
are usually unknown in practice and estimating the random variables distribution may be a big challenge for many realistic problems. The set of realizations is noted
Ωt .
Like for
X
and
A,
the realization set
Ω
can be �nite, discrete and countable, or
uncountable. Depending on the problem, random processes, the sets of possible realizations, and the related probability distributions may depend on the time, the states and the executed actions. In this case, the density function could be written
pωt (ω t =
ω|x, a), and the set of realizations noted Ωt (x, a). Note that, according to our state 0 de�nition in section 1.4.2, if ω t depends on the history of the process (ω t )1≤t0 ≤t−1 , then this history should be included in the state variable xt .
CHAPTER 1.
20
INTRODUCTION
The way the knowledge about this random process is made available can vary from one application to the other. In data driven applications, one might be given a �xed amount of past realizations, and try to infer the hidden distribution. In model based approaches, one needs to have a generative model of the random process, able to generate new realizations whenever prompted. We will later see that the way the optimizer deals with the random process of the problem is important. Some methods choose to bypass the randomness entirely, optimizing their actions in the case of one �xed series of realizations. Others choose to optimize their action as if the random process would always take values equal to the expectation of this process.
And others are trying to make decisions in order
to minimize a given risk criterion, like the costs incurred in the
5%
worst cases.
Finally, some methods are simply trying to optimize the expected cost, computed with respect to the full distribution of the random process or a compromise between the expected cost and the variance. and drawbacks.
All these approaches have their advantages
Generally speaking, one needs to make a trade-o� between being
theoretically consistent and optimal, and having a fast and scalable method. As many random processes in real applications are not Markovian (e.g. weather, prices, . . . ), people like to consider series of random variables rather than isolated ones. It is then convenient to talk about random scenarios (or time series) to refer to the realizations of these series of random variables.
1.4.6
Transition function
As previously stated, this function describes how the system evolves, from a given state to another, as a result of a given agent's action and the outcome of the random processes. In other words, this
state
transition function de�nes the dynamics of the
environment.
ω t+1 10 , the next state xt+1 is given by the transition function T , so that xt+1 = T (xt , at , ω t+1 ). Sometimes in this document, the transition function is equivalently denoted f . Thus, for a given state
xt ,
action
at ,
and random process variable
When the transition function is stochastic, the probability density function of
xt+1
p(.|xt , at ). Formally x ∈ X , p(x|xt , at ) = p(T (xt , at , ω t+1 ) = x). This
is sometimes used to de�ne it. In such cases we note it
this notation means that for all
probabilistic notation is not systematically used in this manuscript. At this point, we can illustrate the de�nition of state variables introduced earlier. If the transition function in
at
T
requires any observable information that is not contained
or in the possible realization of
10 this
ω t+1 ,
then it must be included in
is the random information that will become available between t ant t + 1
xt .
Moreover
1.4. MODELLING SEQUENTIAL DECISION MAKING PROBLEMS
21
(at0 )0≤t0 ≤t−1 are needed to compute T , then they should be included in xt . Similarly, if the probability distribution of ω t+1 depends on (ω t0 )0≤t0 ≤t , then it should be included in xt . Of course, if for some computational reasons, one does not want to include all that information in xt , it is possible to truncate the state to a if all past actions
more manageable size. But then, one needs to be aware that the sampled realizations of
ω t+1
are very likely to be biased, and that the result of
T
may be far from the
true model's result.
Stationary and non stationary transitions.
So far we have written the transi-
tion function assuming it does not depend on time (it is usually the case in practice). This kind of transition functions is called
stationary transition.
However, sometimes, the parameters or the structure of the function depend on time. These functions are said to be
non stationary;
they should not be mistaken
with stationary transitions functions which depends on data that depends on time. According to our de�nition of state variables, non stationary transition functions can be rewritten to become stationary.
Indeed, in this case, the time can simply
be included in the state variable. Nevertheless, sometimes ones want to make more obvious and explicit the time dependence of the transition function, and still overload the notations using non stationary transitions.
1.4.7
Reward function and cost function
Depending on the problem, either a cost function or a reward function is used to quantify the preferences (or
utility)
of the agent. This function denotes the agent's
goal and in�uences its actions choices. A cost function is used while minimizing and a reward function is used while maximizing; these functions are interchangeable by taking their respective opposite values. In the Reinforcement Learning community, problems are usually de�ned such that rewards are used instead of costs.
By de-
fault, we will use this convention, and the following de�nitions are given considering rewards but can similarly be applied to costs.
c and reward functions are denoted immediate reward is computed at each time step by the environment, and is by rt = r(xt , at , ω t+1 ), rt = r(xt , at , xt+1 ) or simply rt = r(xt ) depending on
In this document, cost functions are denoted
r.
The
given
the problem and the resolution method considered. Using this notation, the objective of the agent is to maximize the long-term reward (also named global or total reward)
RT =
P
0≤t≤T rt . Another frequently used long-term reward function is the discounted sum of immediate rewards P RT = 0≤t≤T γ t rt where γ is the discount factor, which allocates di�erent weights to usually de�ned as the sum of immediate rewards
CHAPTER 1.
22
INTRODUCTION
immediate rewards according to their distance to the present time. For the problem to be properly de�ned, we need to have
RT < ∞.
When
RN
is a random quantity,
the question mentioned before arise: what are we trying to achieve ? We may try to maximize the expected rewards, maximize the "worst case scenario" rewards (when this even makes sense), or maximize the rewards assuming one given scenario will happen.
Non stationary reward functions. might depend on the time
xt
t.
As for transition functions, reward functions
In this case, following our de�nition of state variables,
should include the time.
1.5 Optimization and Model Errors The purpose of this thesis is not to provide detailed models for Unit Commitment problems but to provide e�cient methods to solve Unit Commitment problems de�ned with such detailed model. It is important to understand that simpli�cations on the model usually contribute to the suboptimality of obtained solutions.
1.5.1
Optimization error
Because of limited computation time or because of the use of approximate algorithms, the optimal solution may not be found. Typically:
•
most
value-based
methods will assume that the random processes involved can
be reduced to a small Markovian Random Process (see chapter 2);
• Stochastic Dual Dynamic Programming value function is convex.
(see chapter 3) will assume that the
This is not the case e.g.
with precise models of
hydroelectricity;
• Stochastic Dynamic Programming (see chapter 3) will often discretize the state space;
• Direct Policy Search 1.5.2
(see chapter 2) assumes an arbitrary parametric policy;
Objective function and constraint errors
For various reasons, the objective function and the constraints used for optimisation may not be realistic.
1.6. MAIN CONTRIBUTIONS
23
Simpli�cation error: as mentioned above, often, the model is simpli�ed to comply with algorithms assumption [29, 2, 20]:
terms are removed or replaced by
simple linear terms, time steps are aggregated, a less precise time resolution is used, some constraints are ignored (e.g. geographical distribution), . . . But the obtained optimal solution may be far from the actual optimum.
Anticipativity error: this occurs when the system is optimized as if it were possible to predict the future (the optimisation is performed on chosen scenarios). For example, we might decide the capacity of a connection, using simulations of a power grid in which all operational decisions are made with perfect knowledge of the future.
Statistical error: when some data are obtained through a �nite sample, which might be too small (e.g.
archive of 40 years of climate data) and/or biased
(e.g. climate change).
1.6 Main Contributions 1.6.1
Direct Value Search
Our main contribution, presented in the fourth chapter, is an algorithm designed to solve large scale unit commitment problems.
With this algorithm, named
Di-
rect Value Search (DVS), we propose a new method that couples the main ideas and advantages of the two families of algorithms presented in Chapter 2 and 3, namely
Dynamic Programming (Bellman Methods)
and
Direct Policy Search.
Thanks to this new coupling, Direct Value Search have interesting features to tackle challenges listed in section 1.3.2. Indeed, we will see that Direct Value Search is an anytime algorithm (users immediately get approximate results) which can handle large state spaces and large action spaces with non-convex constraints, and without assumptions on the random process. Moreover, as it can work with non-convex constraints and without assumption on the random process, Direct Value Search is capable to solve problems de�ned with more detailed and realistic models, reducing then the modelling errors presented in section 1.5, and thus improving the quality of proposed solutions.
Concrete examples of Unit Commitment problems we have worked on As discussed in section 1.3.2, there are important and challenging Unit Commitment problems at all scales, from the very local scale (e.g.
the
Citines
project in table
CHAPTER 1.
24
INTRODUCTION
1.1), to transcontinental problems and very long-term planning (e.g. table 1.1 or MedGrid
11
Post
project in
).
Various Unit Commitment problems with di�erent characteristics have been used to test our algorithms. The main features of these problems are summarized in table 1.1.
short
term
unit
com-
mitment
time
state
steps
ables (local) ther-
10 min
Citines
vari-
(
mal
plants
and
stocks
loss
bidding
hydro
and
thermal
stock
choices
state
project)
decisions
constraints
and
costs
operational constraints
hydro
horizon
2 days
con-
straints hydroelectric scheduling
IOMCA
(
hydroelectric days(*)
hydroelectric
power
stock levels
plants
project)
output
and
main-
cost of ther-
tenance
mal
(in
power
plants
such
a
case
ther-
mal
plants
are
5 years
often
simpli�ed) nuclear
hydro
power plants
weeks(*)
mainte-
and
main-
tenance
�nancial
hydro
planning
and
POST
weeks(*)
project)
Table 1.1:
maintenance and
hydro
operation
status
nance
(
level
production
operational
cost
constraints
level �-
nancial status
8 years
operational �nancial de-
production
and
cisions
cost
vestment
in-
40 years
constraints
(*) stands for cases in which time steps are usually not contiguous, which
is beyond the scope of this work.
12
In table 1.1, Citines is a FP7
13
project conducted by Artelys
where a produc-
tion strategy (under uncertainties) has to be found for cities, factories, . . . IOMCA
11 http://www.medgrid-psm.com/en/ 12 European-funded
project
13 http://www.artelys.com,
support
a company specialized in optimization, statistics and decision-
1.6. MAIN CONTRIBUTIONS is an ANR
14
25
project. This is a classical hydrothermal coordination problem (a Unit
Commitment problem involving hydroelectric power stations and thermal plants) with long-term planning (several years), taking into account stochasticity and un-
15
certainties in demand and production. See [30] for further details. POST
is one
of the 8 projects "réseaux électriques intelligents innovent" (intelligent electric network) in
Programme d'Investissements d'Avenir (PIA), �nanced by ADEME16 . This
is a high scale (Europe and North Africa) and long-term (horizon 2030 to 2050) investment problem with huge (non-stochastic) uncertainties about, inter alia, future technologies, laws, and clients demand.
1.6.2
Noisy Optimization
The �fth chapter is dedicated to Noisy optimisation, a key component of the Direct Value Search algorithm. In this chapter, we have studied some theoretical convergence rate and we have proved new convergence bounds for given families of objective functions � under some reasonable assumptions. Besides, in section 5.3 we have studied some variance reduction techniques aimed at improving the convergence rate of graybox noisy optimization problems.
1.6.3
Non quasi-convex functions
As many users of Direct Policy Search variants, we use evolutionary algorithms. All convergence proofs of evolution strategies, with log-linear rates, are based on convex functions. We provide a proof in the non-quasi-convex setting. The proof is given for a simpli�ed evolutionary algorithm with an ad hoc mutation which is more convenient for proofs.
14 Agence
2005
, a French agency which �nance public research in France since
nationale de la Recherche
15 Plateforme
d'Optimisation des Supergrids Transcontinentaux
16 http://www.presse.ademe.fr/2013/06/les-reseaux-electriques-intelligents-innovent.
html
26
CHAPTER 1.
INTRODUCTION
Part II Background Review
27
Chapter 2 Classical Algorithms for Sequential Decision Making In this chapter, we present some classical algorithms for �general purpose� Sequential Decision Making under uncertainty and particularly
Markov Decision Process
(or
MDP) (see section 1.4). Some other Sequential Decision Making algorithms � rather general but more widely used in energy management � are described in chapter 3.
Dynamic Programming and Bellman's Principle of Optimality, Bellman equations, value search and policy search, . . . as these concepts will be required for a better understanding The purpose of this chapter is to introduce some classic concepts like
of our main contribution � Direct Value Search � described in chapter 4. Of course, there exist many other classical methods to solve Sequential Decision Making problems and methods described in this chapter have been chosen to be the most relevant according to our goals (section 1.2) and to out main contribution (chapter 4). Also, we focus on stochastic methods, thus we will not talk here about mathematical programming or Lagrangian relaxation. There exist many algorithms to compute a Markov Decision Process's optimal policy.
In the following sections, we brie�y describe the most popular ones.
The
notation used in this chapter (and in the following ones) has been introduced in section 1.4.
2.1 Backward Induction Backward Induction
is a basic
Dynamic Programming method [31]. Like other DyBellman's Principle of Optimality [31] for
namic Programming algorithms, it uses the
accelerating computation (compared to an exhaustive search) with problems which
29
CHAPTER 2.
30
exhibit a compatible structure (i.e.
lems
and an
optimal substructure
CLASSICAL ALGORITHMS FOR SDM
a problem de�ned with
[31]).
overlapping subprob-
Actually, this acceleration is obtained by
breaking problems down into simpler subproblems in such a manner that redundant computations are avoided.
Backward Induction computes non-stationary policy:
one di�erent policy is com-
puted for each time step. Thus the number of time steps used to solve the problem is set in advance. Like most methods presented in this chapter,
Backward Induction
algorithms solve Sequential Decision Making problems de�ned with discrete actions and state spaces. The
value
(or
utility) V ∗
for each state
s
at the latest time step
VT∗ (s) = r(s) where value
r is the immediate reward function de�ned in section 1.4.7. V ∗ for each state s at the tth time step is " # X ∗ 0 ∗ 0 Vt (s) = r(s) + max T (s, a, s )Vt+1 (s ) a∈A
and the
tth
T
is (2.1)
The best expected
(2.2)
s0 ∈S
d∗t (s) among the set of possible actions A is # " X ∗ d∗t (s) = arg max T (s, a, s0 )Vt+1 (s0 ) (2.3)
optimal action (or decision)
a∈A
where
T
s0 ∈S
is the transition function de�ned in section 1.4.6.
The main idea is to compute the expected value of each state (Eq. 2.2) and then to use it to select the best action for any given state (Eq. 2.3). Eq. 2.2 cannot be solved analytically because the system of equations to compute
V
contains non-linear terms (due to the "max" operator). As an alternative, Eq. 2.2
is usually computed using Dynamic Programming method, as described in algorithm 1.
2.2 Value Iteration Value Iteration policy.
[31] is one of the most famous algorithm to compute MDP's optimal
Like for
Backward Induction
(section 2.1), the main idea implemented by
Value Iteration is to compute the best expected value of each state and then to use these values to select the best action from any given state.
2.2. VALUE ITERATION
31
Algorithm 1 Backward Induction Input:
mdp = hS, A, T, ri, a Markov Decision Process T , the resolution horizon (ie. the number of time
steps)
Local variables:
Vt∗ ∀t ∈ {1, ..., T },
vectors of utilities for states in
S
VT∗ [s] ← r(s) ∀s ∈ S for all t ∈ {T − 1, T − 2, ..., 1} do for all s ∈ S do if s is a �nal state then Vt∗ [s] ← r(s) else " # X ∗ Vt∗ [s] ← r(s) + max T (s, a, s0 )Vt+1 [s0 ] a∈A
end if end for end for return
Vt∗ ∀t ∈ {1, ..., T }
s0 ∈S
CHAPTER 2.
32
CLASSICAL ALGORITHMS FOR SDM
The main di�erence with the Backward Induction algorithm is that Value Iteration computes a stationary policy.
Indeed, the same resulting policy is used for
each time step and thus there is no assumption about the number of time steps to consider for the solution. The expected value policy
π
Vπ
for each state
s when the agent follow a given (stationary)
is
" V π (s) = E
∞ X
# γ t r(st )|π, s0 = s
(2.4)
t=0 ∗
π is de�ned using the best principle of Maximum Expected Utility as follow " # X ∗ π ∗ (s) = arg max T (s, a, s0 )V π (s0 )
The optimal (stationary) policy and using the
a∈A
Eq. 2.6 is commonly named the
expected value
Vπ
∗
(2.5)
s0 ∈S
Bellman equation;
it gives the best value we ∗ can expect for any given state (assuming optimal policy π is followed). There are
|S|
Bellman equations, one for each state. As for the Backward Induction method,
this system of equations cannot be solved analytically because Bellman equations contains non-linear terms (due to the "max" operator). As an alternative, Eq. 2.6 can be computed iteratively using a Dynamic Programming method named Value Iteration and described in Algorithm 2.
V (s) := V
π∗
(s) =
r(s)
if
"
r(s) + γ max a∈A
s
is a �nal state
# X
T (s, a, s0 )V (s0 )
otherwise
s0 ∈S (2.6)
Bellman update � is used update V at each iteration.
Equation 2.7 � called in Algorithm 2, to
Vi+1 (s) ←
r(s) r(s) + γ max a∈A
Convergence
in the iterative method described
if
"
s
is a �nal state
# X
T (s, a, s0 )Vi (s0 )
otherwise
(2.7)
s0 ∈S
The convergence of Value Iteration has been proved, but this con-
vergence is asymptotic [31]. However, each iteration is easy and fast to compute.
2.2. VALUE ITERATION
33
Algorithm 2 Value Iteration Input:
mdp = hS, A, T, ri, a Markov Decision Process γ , the discount factor �, the maximum error allowed in the utility of any
state in an iteration
Local variables:
V, V 0 , vector of utilities for states in S , initially zero δ , the maximum change in the utility of any state in repeat
V ←V0 δ←0 for all s ∈ S do if s is a �nal state V 0 [s] ← r[s]
then
else
"
V 0 [s] ← r[s] + γ max a∈A
if
0
end if end for
δ < �(1 − γ)/γ V
return
s0 ∈S
|V [s] − V [s]| > δ then δ ← |V 0 [s] − V [s]|
end if until
# X
T (s, a, s0 )V [s0 ]
an iteration
CHAPTER 2.
34
CLASSICAL ALGORITHMS FOR SDM
2.3 Policy Iteration Policy Iteration
[32] is another very popular algorithm to compute MDP's optimal
policy. In practice, it is often faster than Value Iteration. The Policy Iteration algorithm alternates the following two steps, beginning from some initial policy
π0 :
1. Policy Evaluation: given a policy value of each state when
πi
πi ,
it calculates
V πi (s) ∀s ∈ S ,
the expected
is followed.
2. Policy Improvement: it calculates a new policy πi+1 , using one-step look-ahead π based on V i and using the principle of Maximum Expected Utility as follow
" πi+1 (s) = arg max a∈A
# X
T (s, a, s0 )V πi (s0 )
(2.8)
s0 ∈S
Algorithm 3 describes the two-step procedure. The algorithm terminates when the
Policy Improvement
step yields no change in the utilities.
Solving the POLICY-EVALUATION routine is much simpler than solving the standard Bellman equations (which is what Value Iteration does). Indeed, the action in each state is �xed by the policy, thus the "max" operator disappears and Bellman π equations become linear. As a result, V i can be computed by solving the linear system of these
simpli�ed Bellman equations
(Eq. 2.9) for each state.
r(s) X V πi (s) = T (s, πi (s), s0 )V πi (s0 ) r(s) + γ
if
s
is a �nal state
otherwise
(2.9)
s0 ∈S
2.3.1
Convergence
As the number of states and policies is �nite, and as the policy is improved at each iteration, Policy Iteration converges in a �nite number of iterations (often small in practice).
However, within each iteration, solving the POLICY-EVALUATION 3 routine may cost a lot (its complexity is O(|S| )).
2.3.2
•
Notable Policy Iteration variants
Modi�ed Policy Iteration [33] and [34], speed-up the POLICY-EVALUATION routine with approximated evaluations of
V
using
V alueIteration.
2.3. POLICY ITERATION
35
Algorithm 3 Policy Iteration Input:
mdp = hS, A, T, ri,
an MDP
Local variables:
V , vector of utilities for states in S , initially zero π , a policy vector indexed by state, initially random repeat
V ← POLICY-EVALUATION(π, V, mdp) unchanged? ← true for all state " s ∈ S do # X X T (s, π[s], s0 )V [s0 ] if max T (s, a, s0 )V [s0 ] > a∈A s0 ∈S s0 ∈S " # X 0 0 π[s] ← arg max T (s, a, s )V [s ] a∈A
s0 ∈S
unchanged? ← f alse end if end for until
unchanged? π
return
then
CHAPTER 2.
36
•
CLASSICAL ALGORITHMS FOR SDM
Asynchronous Policy Iteration [35], speed-up the Policy Iteration by considering only a (well-chosen) subset of
S
when updating
V
and
π.
2.4 Direct Policy Search Direct Policy Search
(DPS) methods (or simply
Policy Search)
are widely used in
reinforcement learning. As the name indicates, these methods search in the space of ∗ policy Π for an optimal policy π . Actually, they optimize � on simulations � the parameter network,
θ
θ
of a given parametric policy
πθ ∈ Π.
For instance,
πθ
can be a neural
being the weights of neurons.
πθ can be di�erentiable with respect to θ or not; in the �rst case, a Gradient-Based Policy Search method is generally used whereas in the second one a Gradient-Free Policy Search is used. In this thesis, when we evoke Direct Policy Search, we implicitly refer to the Gradient Free case. This method considers the problem of �nding a good parameter θ as a noisy (gradient-free) optimization Policy
problem. Existing techniques, such as evolutionary optimization (see section 4.1.2) or cross-entropy methods can be used to optimize
θ.
The optimisation procedure is
de�ned in Algorithm 4 and the objective function considered for the maximization of
θ
is given in Algorithm 5. Using human expertise for de�ning the
π
function can
make this approach quite e�cient and anytime [36]. However, it is di�cult to ensure that
πθ (xt )
veri�es decision constraints.
The key advantages of DPS include:
•
Direct Policy Search does not need a particular linear, quadratic or analytical model of the system. The only requirement is a generative model (a black-box simulator).
•
There is no need for a decomposable criterion neither (e.g. medians or quantiles of delayed costs can be optimized).
•
The simulations naturally focus on likely parts of the state space, without the tedious backward induction on all the state space as in backwards Bellmanbased tools.
•
There is no need for a particular Markovian Random Process; any Random Process (Markovian or not) can be used within the black-box simulator.
There are also some drawbacks of using DPS:
•
A huge size of the action space implies, for many parametric policies, a huge size of the parameter space, leading to prohibitory resolution times.
•
Constraints on the action space are di�cult to handle in Direct Policy Search.
2.4. DIRECT POLICY SEARCH
Algorithm
4
The
Direct
Search(πθ , M N M DP, x).
37
Policy
Search
procedure:
ˆ θ
←Direct
Policy
The non linear optimization tool used for �nding
ˆ θ
is
not speci�ed this general de�nition.
Input: a parametric policy
πθ
where
πθ (.),
is a mapping from the state space
to the decision space, a
Markovian or Non-Markovian Decision Process x
MNMDP,
an initial state
Output: a parameter Find
ˆ θ
ˆ θ
leading to a policy
πθˆ (.)
maximizing the expectation of
θ 7→ Simulate(πθ , MNMDP, x) with a given non-linear noisy optimization algorithm like the one discussed in section 4.1.2
ˆ θ
return
Algorithm 5 The
Simulate
function:
r ←Simulate(π, M N M DP, x)
Input: a policy
π,
a Markovian or Non-Markovian Decision Process MNMDP, an initial state
x
Output: a reward
r
Simulate MNMDP from state the obtained reward
return
r
r
x
with policy
π
until a terminal state and return
38
CHAPTER 2.
CLASSICAL ALGORITHMS FOR SDM
Chapter 3 The Most Classical Solutions for Energy Stock Management As explained in chapter 1, Unit Commitment are complex multistage optimization problems with both integer and continuous variables.
The exact solution to the
problem can not be obtained with realistic power system models, because of its excessive computation time requirement. Due to the interpretability of Bellman value functions (Chap. 2), and due to the elegance of the Bellman optimality principle, many practitioners prefer value-based methods, which provide simple rules for the pricing of resources.
For example, a
value function for water provides � thanks to the derivative with respect to stock � the marginal price of water in dams.
This is very helpful for optimizing locally
the dispatch of units. Dual versions provide a signi�cant improvement in terms of speed, admittedly with a cost in terms of modelling � not all power systems can be rewritten with dual dynamic programming. Classical backwards Dynamic Programming is expensive and tricky. Therefore,
Model Predictive Control
(section 3.1) is sometimes preferred. The only but strong
assumption of Model Predictive Control is the perfect forecast over some
horizon
tactical
(section 3.1).
This chapter reviews the most classical methodologies for power systems optimization:
• Stochastic Dynamic Programming [31] (including dual versions), using scenario tree generation [37]. It is brie�y presented in Section 3.5. The limits in the performance of such methods are the discretization and, in many cases, simplifying assumptions made on the modeling, for accelerating the solving (see section 1.5), e.g.:
39
CHAPTER 3.
40
CLASSICAL ALGORITHMS FOR POWER SYSTEMS
� the convexity of Bellman values, which, for instance, is not veri�ed in some unit commitment problems where the water turbines e�ciency increases as a function of stocked water quantity (see section 1.3.2);
� the nice properties of the random process as explained above; � sometimes the separability of the Bellman values over state variables (i.e.
V (x1 , . . . , xk ) =
P
i∈{1,...,k}
Vi (xi )).
These assumptions are justi�ed by the huge computational cost when trying to solve a more realistic model.
For example, with unit commitment prob-
lems, optimizing over a group of 250 hydroelectric stocks by SDP is impossible without such approximations and is still quite hard.
• Approximate Dynamic Programming
[38], using other assumptions such as the
good learnability of Bellman values by an approximate model (e.g.
Vector Machines
Neural Networks). Decision Making Runtime1
[39] or
of the polynomial
Support
A crucial drawback is the loss or DMR when the approximate
Bellman values can not be encoded in a linear problem (more on this below).
• Model Predictive Control,
replacing the uncertain random variables by a de-
terministic forecast. This deterministic approximation of uncertainties may be the expected value of the random variables or more commonly a pessimistic forecast [40]. This methodology does not aim at tackling highly stochastic random processes [20]; it is nonetheless quite practical, with moderate
Making Runtime
and nearly null
2
Solving Runtime
Decision
(or SR).
3.1 Model Predictive Control Model Predictive Control (MPC) is a very simple algorithm.
For making a decision, it
replaces all stochastic parts by a deterministic approximation, and then, it optimizes the decisions as if reality was this deterministic approximation. In other words, it simplify a stochastic problem into a deterministic one, much easier to solve. This approach is also known as anticipativity. Thus, Model Predictive Control applies an open loop control (also termed conformant planning): the decisions for all time steps are made once and for all, independently of the state variables. This simple principle can be improved in several ways:
1 The
computation time for making one decision with a given policy, i.e. the online computational cost. 2 The computation time for building the policy, i.e. the o�ine computational cost.
3.2. STOCHASTIC DYNAMIC PROGRAMMING
• Receding horizon
(also termed
41
shrinking horizon
having made decisions, we wait a given number we re-optimize the decisions;
h
rolling planning):
or
h of time steps, and operational horizon.
is then termed the
after then This
means that we perform many optimizations instead of just one; if we work on time steps, then we have
dT /he
T
optimization problems. The advantage of this
trick is that observations of the state are then used to adjust the deterministic approximation of all stochastic parts (in other words MPC applies mixture of open-loop control and closed-loop control). The principle of receding horizon is illustrated in Fig. 3.1.
• Tactical horizon
(Fig. 3.2): optimizing over the next
T
time steps might be
a challenge in terms of computational power, in particular in case of huge power systems with many constraints. Therefore, it is a common practice to optimize only the costs corresponding to the
k
is termed the
k
next time steps. In such a case,
tactical horizon, to be distinguished from the total number T strategic horizon. This has the obvious drawback that
of time steps, termed
long-term e�ects are not taken into account. On the other hand, it has two advantages:
� due to limited tactical horizon, the results are less biased by an assumption of perfect forecast;
� the computational cost is much lower as the number of decision variables becomes usually linear in the tactical horizon horizon
k
instead of the strategic
T.
Fig. 3.3 illustrates the case where both
Receding horizon
and
Tactical horizon
are
used.
3.2 Stochastic Dynamic Programming Richard Bellman [31] has shown that, in the Markov Decision Process case and for an optimization of the average reward, an optimal policy
(rt , st+1 ) = f (st , at , ω t ) X R = rt
π
for solving Eqs. 3.1-3.3 (3.1) (3.2)
t∈{0,...,T −1}
ω t = Random at = π(st )
(3.3) (3.4)
42
CHAPTER 3.
CLASSICAL ALGORITHMS FOR POWER SYSTEMS
time step
strategic horizon
global problem problem 1 solution 1 kept solution 1 operational horizon problem 2 solution 2 kept solution 2 problem 3 solution 3 kept solution 3 problem 4 solution 4 kept solution 4 +
+ global solution
Figure 3.1:
time step
+
Receding horizon.
strategic horizon
global problem tactical horizon problem 1 solution 1 kept solution 1
problem 2 solution 2 kept solution 2 problem 3 solution 3 k. sol. 3 + global solution
Figure 3.2:
Tactical horizon.
+
3.2. STOCHASTIC DYNAMIC PROGRAMMING time step
43
strategic horizon
global problem tactical horizon problem 1 solution 1 kept solution 1 operational horizon problem 2 solution 2 kept solution 2 problem 3 solution 3 kept solution 3 problem 4 solution 4 kept solution 4 +
Figure 3.3:
+ global solution
+
Tactical horizon with Receding.
is de�ned as follows:
π(st ) = arg max [r(st , at , ω t )] + V (st+1 , t + 1),
(3.5)
at ∈A
where
rt := r(st , at , ω t )
is the instantaneous reward associated to decision
at
V (s, t) = sup E [rt + rt+1 + · · · + rT ] ,
and (3.6)
a
with
s := st
and where
π
ranges over legal policies for each time steps
t0 ≥ t.
Note that the notation has slightly changed since Chapter 2; we switched form a simple notation for general algorithms to a more common notation in Power Systems
3
community . We will keep this new notation in chapter 4. A variant of Eq.
ω t , . . . , ω t+k
3.6 with tactical horizon
(assuming that we can predict
with good precision) is possible:
V (s, t) =
sup at ,...,at+k−1
3
k
E [rt + · · · + rt+k−1 ] + V (st+k , t + k)
(3.7)
Here the time is explicitly put as an argument of V , but t could equivalently be hidden in the state vector (as explained in chapter 1). Also we consider here that the reward r depends on the action a; in order to simplify equations, it was not the case in chapter 2. Finally the transition function f now receives the exogenous random part as an argument.
CHAPTER 3.
44
with
CLASSICAL ALGORITHMS FOR POWER SYSTEMS
(rt , st+1 ) = f (st , at , ω t ).
The problem for applying Eq. 3.5 is that 3.5 implies that we know an optimal
π,
V (s, t)
is hard to compute. Using Eq.
which means that the problem is already
solved. However, it can be computed backward in time as explained in Section 2.1; if, for some
t,
you know
V (s, t + 1)
for all
s,
then
V (s, t) = sup Ert + V (st+1 , t + k + 1)
(3.8)
at
with
(rt , st+1 ) = f (st , at , ω t ).
This is correct only when random variables
ωt
ωt
are independent. The extension to
Markovian is classical, but the general case is hard (because Eq. 3.5 is not mean-
ingful anymore; see Eq. 3.9 for the general case and Eq. 3.10 for the intermediate Markovian case).
at = π(st , ω 0 , . . . , ω t−1 ). at = π(st , ω t−1 ).
(3.9)
(3.10)
Whereas Direct Policy Search has no such problem, Stochastic Dynamic Programming methods require the reward function to be additive (i.e. the global reward is a sum of rewards at each time step and rewards for a given state/action pair do not depend on previous or later states). This is a key problem when working e.g. in the classical cases of minimum water �ow constraints in power systems (Unit Commitment usually involves hydroelectricity which is penalized by long-term drought e�ects, which are di�cult �joint� terms in the objective function involving several time steps).
3.3 Stochastic Dual Dynamic Programming The
Stochastic Dual Dynamic Programming
(SDDP) algorithm was originally pro-
posed in [41]. The principle is to use some gradient or subgradient information in order to quickly approximate the value function by a piecewise linear approximation. It is however di�cult to take into account a signi�cant random process, unless we assume that the random process is Markovian with a moderate state space. SDDP also assumes that the value function is convex, so that it can be approximated by piecewise linear functions. On the other hand, SDDP is quite fast for solving stochastic dynamic optimization problems and it is one of the most usual variants in the literature. The SDDP procedure is described in Algorithm 6.
3.4. APPROXIMATE STOCHASTIC DYNAMIC PROGRAMMING (ADP)
45
Benders methods for extracting linear function V . The representation of convex
SDDP is successful thanks to the use of functions as lower bounds on the value
value functions by piecewise linear functions is elegant and e�cient.
[42] shows
that a �nite (though quickly increasing) number of cuts is enough when each time step involves piecewise linear functions. An important point is that high-dimensional action spaces are not a problem when Eq. 3.8 can be encoded in linear programming; the di�culties are caused by the size of the state space. Thanks to forward/backwards successive approximations, SDDP is also more "anytime" than standard backwards SDP. Also it provides an exact solution:
•
if the problem is stagewise independent (the convex as a function of
•
x
ωi
are independent) and
V
or, seemingly (though we did not �nd a formal proof in the literature) if is convex as a function of
ω 1 , . . . , ω t−1
is
[43];
x
and
x
V
contains all the information included in
(consistently with [44]).
3.4 Approximate Stochastic Dynamic Programming (ADP) Eq. 3.8 from Stochastic Dynamic Programming is usually impossible to apply directly on problems de�ned with continuous state space, as in�nitely many states have to be considered. A popular solution consists in evaluating the Bellman value
V
at each time steps for �nitely many states
xi ,
and then to apply some learning
algorithm (such as Neural Networks, sums of Gaussians or Support Vector Machines)
(xi , V (xi , t)) in order to get an approximation Vˆ (., t). This approximation is used in lieu of V (., t) for computing V (x, t − 1) as in Eq. 3.5. This methodology is termed Approximate Stochastic Dynamic Programming or simply Approximate Dynamic Programming (ADP). Except through tricks like repeating the process with
to the
an exponentially increasing discretization size, ADP is not an "anytime" process. Stochastic Dual Dynamic Programming, presented above, can be considered as a particular case of ADP; it uses piecewise linear functions as approximations of the Bellman equation
V (.).
We refer to [45] for more on ADP and its variants.
CHAPTER 3.
46
CLASSICAL ALGORITHMS FOR POWER SYSTEMS
Algorithm 6 Stochastic Dual Dynamic Programming. In most implementations, the random process state is discarded, as it is complicated and expensive to deal with it (this is the heart of stagewise independence)
Input:
mdp = hX , A, T, ri,
a Markov Decision Process
Local variables:
Vt ∀t ∈ {1, ..., T },
vectors of utilities for states in
Initialize the current value function
X
(the value function)
V
while true do // Step 1 Perform one simulation from
t=0
to
t = T,
using the current value function
V
The output of this simulation is: a sequence of random processes states a sequence of states
xt
a sequence of subgradients of at each
(ω t−1 , xt )
ωt,
V w.r.t x (not necessarily all variables xt , if ω t−1 is included in xt )
in
x)
(i.e. at each
// Rem: the subgradient provides a lower bound on
V (xt ) assuming that V (x0 )
// Step 2
for all
xt
do
V adding a Benders cut: V = max(V, the linear approximation Update
end for end while return
V
which has been backed up forxt at step 1)
3.5. ANTICIPATIVITY AND CROSS-VALIDATION
47
3.5 Anticipativity and Cross-validation Random processes (RP), in the framework of Sequential Decision Making, are usually modelled by
scenario trees.
A scenario tree is a discrete
Markov chain
(without
recombinations in most cases). Strategies then depend on:
•
a �state� (variable which depend on the decisions and which are not modeled by the scenario tree);
•
the �node� in the scenario tree.
For example, in a SDP setting, there might be Bellman values depending on both. This ensures that decisions made at a node depend only on the past observations, not on future decisions. This assumption is intended to avoid
anticipativity.
Mathematically speaking, under the assumptions of the Stochastic Dynamic Programming, the solution is supposed to be optimal on the random process which is exactly equal to the scenario tree. A classical approach for building scenario trees is [37] where the scenario tree is built from an archive of data. Programming from
over�tting,
However, nothing prevents Stochastic Dynamic
i.e. a poor generalization of performance, from the
events modeled in the scenario tree to the original random process. For these reasons,
cross-validation
makes sense: build a scenario tree on a randomly selected subset of
the data (e.g. 9/10th of the data) and test the policy on the remaining 1/10th. This can be reproduced multiple times; this is so-called random 10-fold cross-validation.
3.6 Other Methods Many other resolution methods exist for Unit Commitment problems.
Among
Priority list, Linear Programming and Mixed Integer Linear Programming, Lagrangian Relaxation methods, Network Flow Programming, Genetic algorithms them:
and other meta-heuristics. Some of these methods are very classic in the Unit Commitment community. See [13, 14] for a more comprehensive list of resolution methods (and their bibliography) for Unit Commitment problems.
48
CHAPTER 3.
CLASSICAL ALGORITHMS FOR POWER SYSTEMS
Part III Contributions
49
Chapter 4 Direct Value Search: a new algorithm combining critic and actor methods
4.1 Introduction Direct Policy Search (DPS) (section 2.3) is a widely used tool for reinforcement learning; however, it is usually not suitable for handling high-dimensional constrained action spaces such as those arising in power system control (Unit Commitment problems). with
In this chapter, we propose Direct Value Search, an hybridization of DPS
Bellman decomposition techniques
(sections 2.1, 3.2, 3.3 and 3.4).
We prove
runtime properties, and apply the results to an energy management problem.
4.1.1
Motivation
This chapter presents a new methodology for solving Sequential Decision Making problems (as
Markov Decision Processes
and
Non-Markovian Decision Processes),
combining the advantages of Direct Policy Search and the advantages of Bellmanstyle optimization. The proposed algorithm is aimed at solving problems with a large constrained action space. In this chapter, a
Decision Processes
Stochastic Decision Processes corresponding to either Markov Non-Markovian Decision Processes as our new method pre-
or
sented in this chapter is able to solve both indi�erently.
51
CHAPTER 4.
52
DIRECT VALUE SEARCH
The complexity of solving Stochastic Decision Process When solving Stochastic Decision Process, at least two di�erent runtime measures are relevant:
•
Solving runtime (SR): this is the computation time (or complexity) for building the policy, given a Stochastic Decision Process. In other words, this is the
o�ine
computational cost.
In Bellman decomposition techniques, it
corresponds to the computation cost of computing the Bellman values
V
(e.g.
Eq. 2.2).
•
Decision making runtime (DMR): this is the computation time (or complexity) for making one decision with a given policy. In other words, this is the
online
computational cost.
It typically depends on the family of policies we
consider. In Bellman decomposition techniques, it corresponds to the computation cost of applying the principle of actions knowing Bellman values
V
Maximum Expected Utility
to compute
(e.g. Eq. 2.3).
The complexity of Stochastic Decision Process solving often refers to SR. A moderate computation cost for DMR can help reducing the complexity of SR: there are many cases in which solving the Stochastic Decision Process is based on solving many times the decision making problem; for instance, applying Bellman's operator in a
Value Iteration framework involves many decision makings (see section 2.2). Also, Policy Iterations needs a lot of simulations, which in turn involve decision makings. Problems with huge constrained action spaces Our focus is on problems for which the DMR is huge, unless special tricks are used. Typically,
•
we have to consider tenths of state variables;
•
we have to make decisions for tenths of time steps.
The number of decision
variables and the number of constraints is then multiplied by the number of time steps considered for the optimization. This increases a lot the size of the problem. Many important unit commitments problems have these features. For instance Unit Commitment problems with 80 hydroelectric stocks, 60 nuclear power plants, making decisions ensuring constraint satisfaction over 2 days (assuming that forecasts are reliable over 2 days) give rise to hundreds of thousands of decision variables for each decision making.
4.1. INTRODUCTION
53
The power systems community has found a solution with a moderate DMR, thanks to a careful use of linear programming for approximating convex Bellman value functions by convex piecewise linear functions.
This is classically done in
Stochastic Dynamic Programming (SDP) [31] or Stochastic Dual Dynamic Programming [41]. However, it is well known that the SR as a function of the state space dimension is still exponential (so-called curse of dimensionality).
Advantages of Direct Policy Search In our work, we will use DPS in a new manner so that we have a controlled SR, in spite of constrained action spaces. In addition, our method will have a polynomial DMR, similarly to SDP variants using linear approximations � as discussed in chapter 3. DPS does not have such features. The principle of this algorithm is to optimize a parametric policy. Thanks to the use of a parametric policy, DPS has a moderate SR in spite of huge state spaces (i.e. it can be de�ned on continuous state spaces). With a bit of human expertise in the structure of this parametric policy, we can have highly e�cient methodologies [36].
Strategies
Robust numerical optimization (like
Evolution
for noisy optimization [46]) makes DPS e�cient in cases where nothing
else works. As already stated, the key advantages of DPS include:
•
No need for a linear, quadratic, or analytical model; any problem which can be simulated can be tackled by DPS.
•
No need for a decomposable criterion; we can optimize medians, quantiles, of delayed rewards.
•
The simulations naturally focus on likely parts of the state space, without the tedious backward induction on all the state space as in backward Bellman-based tools.
•
It can work with Non-Markovian Random Process.
The last point is a very strong advantage for power system applications but this advantage is often overlooked. Bellman decomposition requires a Markovian Random Process.
However � for instance � water in�ows to dam reservoirs in hydropower
Unit Commitment problems are certainly neither independent nor Markovian. The only method to rigorously making in�ows Markovian consists in extending the state representation with a memory of the previous states of the Random Process. This multiplies the size of the state space, making optimization intractable.
DPS, on
CHAPTER 4.
54
DIRECT VALUE SEARCH
the other hand, naturally tackles non Markovian random processes, in the sense that parametric policies are optimized on simulations which do not have to be Markovian.
Drawbacks of DPS, and strength of Bellman-style decomposition There are also severe drawbacks of using DPS:
•
A huge size of the action space implies, for many parametric policies, a huge size of the parameter space, leading to redhibitory SR.
•
Constraints on the action space are di�cult to handle in Direct Policy Search. In Unit Commitment problems, some actions are unfeasible from some given states; this is often di�cult to handle with general purpose parametric policies like Neural Networks.
•
There are many problems for which optimizing the short-term reward (incurred over the time steps for which we ensure constraint satisfaction) is a large part of the overall computational cost - precisely due to constraints. For such problems, independently of the state, using value-based methods such as Bellman decompositions is much easier than using DPS, because the optimization problem used in Bellman's operator can take all the constraints into account.
The third point is a key for understanding why DPS, as well as other policy-based reinforcement learning methods, are not widely tested in the power systems industry. In most Unit Commitment problems, the reward associated to an action contains, as main component, a complex instantaneous reward to be optimized under di�cult constraints; such a situation is di�cult to tackle with traditional DPS.
4.1.2
Direct Value Search Principle
The principle of DVS is to combine the representation of SDP and the optimization of DPS.
Our proposal: Direct Value Search We propose Direct Value Search (DVS), a form of DPS based on the representation classically used in SDP or Stochastic Dual Dynamic Programming (SDDP). We will show that we get a polynomial bound on the DMR (as a function of the number of action variables and constraints), and an anytime algorithm for SR (i.e. an algorithm that smoothly and iteratively converges towards the optimum).
4.1. INTRODUCTION
55
Stochastic Decision Processes. We consider sequential decision making problems, in the Stochastic Decision Process framework (i.e.
as stated before we consider Markov Decision Processes and
Non-Markovian Decision Processes). This means that there is a transition function
(rt , xt+1 ) = f (xt , ω t , ut ) where t indices are discrete time step indices (t ∈ {0, ..., T }), rt ∈ R is a reward and xt is a state (x0 is given). The controller decides its control ut using some policy u : ut = u(xt ). The exogenous ω t is a random process - the ω t are not necessarily independent. This is why ut only depends on u and xt (more on 1
this in Eq. 4.5). So we get the following equations :
(rt , xt+1 ) = f (xt , ω t , ut ) X R = rt
(4.1) (4.2)
t∈{0,...,T −1}
ω t = Random ut = u(xt )
(4.3) (4.4)
Eq. 4.1 is the system equation, Eq. 4.2 gives the total reward, Eq. 4.3 is a random process and
u (in Eq.
4.4) is the unknown strategy to be decided (T is the �nal time
step).
Random processes (RP). Several di�culties arise when di�cult Random Processes are involved (some points have been discussed in chapter 1):
•
A common crucial assumption is the independence or stagewise independence of the
(ω t )t∈{0,...,T −1} .
This is thoroughly analyzed in [43], in particular from
the point of view of the (helpful) impact of this assumption on computational complexity.
•
ω t are a general Random Process and not an ω t (or the part of it which is known) should Assuming that ω 0 , . . . , ω t−1 (and only them) can be
A more di�cult case is when the
independent noise. Then, the past be encoded in the policy. observed for deciding
ut ,
Eq. 4.4 becomes:
ut = u(xt , ω 0 , . . . , ω t−1 ). 1
(4.5)
Note that, actions are now noted u and the policy at DMR is noted u in order to avoid mistakes with the SR policy noted π (Algorithm 8).
CHAPTER 4.
56
DIRECT VALUE SEARCH
In a Bellman approach, the state space now includes increasing sequence with
•
ω 0 ,. . . ,ω t−1 ,
which is an
t.
An intermediate case consists in assuming that the Then, all the information is stored in the last
ωt
are a Markov chain.
ωt:
ut = u(xt , ω t−1 ). Unfortunately, such a case is rare.
(4.6)
DPS has advantages for handling non-
Markovian Random Process: the DPS algorithm is based on simulations, and it makes sense with any Random Process, Markovian or not. Non Markovian cases lead to more inputs (Eq.
4.5) but DPS does not have to sample an
exponentially increasing state space.
•
For representing non-Markovian Random Processes, common solutions [43] consist in either adding Random Process's past realisations in state (which leads to huge state spaces) or in considering �nite scenario trees [37]. In the latter case, the non-Markovian nature of the Random Process is handled by adding an implicit state variable which is the node index.
•
Tackling continuous Random Processes is required in many real-world applications. Yet, SDDP works with discrete Random Processes, hence the �nite sample average approximation is usual [47, 48, 49, 50].
Our algorithm, Direct Value Search, uses Eqs. 4.1-4.3 and, as a special case of DPS. Eq.
4.4 and Eq.
4.5 can be applied without any adaptation (as usual with DPS
variants). The function
u is optimized so that the random variable R is approximately
maximum.
Direct Value Search: Direct Policy Search for Optimizing the Valorization Here we present the representation used in our algorithm, DVS. This representation is parametric; we optimize the parameters by non-linear noisy optimization.
The
Self-Adaptive Evolution Strategy
(SA-
non-linear noisy optimization tool we use is a ES), presented in Section 4.1.2.
De�nition of DVS. Direct Policy Search consists in keeping Eq. 3.5 (as in SDP methods), but not to compute optimize
V (x, t) by θ by DPS.
Eq.
3.8.
Instead, we de�ne
V
by
V (x, t) = Πθ (x, t)
and we
4.1. INTRODUCTION
57
tactical horizon k (chosen so that we can Random Process ω t can be deterministically
To get lower computation time, we use a assume that the
k
next values of the
approximated) as described in Section 3.1 and in Eq. 3.7. Thus we apply
u(x, t) = arg max ut
max
ut+1 ,...,ut+k−1
E (rt + · · · + rt+k ) + Πθ (xt , xt+k−1 , t)
(4.7)
where
• Πθ (x, xt+k−1 , t)
is a non-linear function of
t
and
x
(so that complex controls
can be encoded);
• Πθ (x, xt+k−1 , t)
is convex piecewise linear as a function of
rt0
4.7 is a linear programming problem if all the program where the decision variables are the
xt+k−1
so that Eq.
can be encoded in a linear
ut 's.
A convenient case is as follows:
u(x, t) = arg max ut
max
ut+1 ,...,ut+k−1
E (rt + · · · + rt+k ) + Πθ (xt , t)> · xt+k−1
(4.8)
In such a setting we bene�t from
•
the large-scale possibilities of linear programming in terms of size of the action space (provided that
ut 7→ (rt , xt+1 ),
for a given
xt ,
can be encoded in a linear
problem)
•
and the genericity of Direct Policy Search.
From
now
on,
we
de�ne
a
trajectory
as
a
randomized
sequence
(target0 , targetk , target2k , . . . , targetT ) of states, possibly correlated with the (ω 0 , . . . , ω T −1 ). A trajectory (target0 , . . . , targetT ) is reachable if it is possible, for some control functions, to ensure with probability 1 that, for all t, xt = targett . random processes
Properties of DVS. More formally, the proposed approach satis�es the following properties:
•
DMR-tractability: If the reward and new state can be expressed with linear programming and if
(rt , xt+1 ) = f (xt , ω t , ut ) x 7→ Πθ (x, xt+k ) is convex
piecewise linear, then decision making (Eq. 4.7) can be achieved in polynomial time.
CHAPTER 4.
58
•
DIRECT VALUE SEARCH
l < ∞) as a function of the decisions, then any reachable trajectory (target0 , . . . , targetT ) can be forced by some function Πθ such that ∀x, t, the function x 7→ Πθ (x, xt+k−1 , t) is convex piecewise linear with at most d + 1 linear cuts, where d is the dimension of the state space. Genericity: If the reward rt is Lipschitz (with Lipschitz constant
Proof.
Πθ (x, xt+k−1 , t) = 2l × ||xt+k−1 − targett+k−1 || (with l the Lipschitz constant for rt ) for showing the result with 2d cuts. Optimizing the placement of linear cuts so that (i) there is only one maximum targett+k and (ii) the gradient is lower bounded by a big enough constant almost everywhere leads to the same result with d + 1 cuts.
Just set
We term our algorithm mizing the valorization
V
Direct Value Search
(DVS) because it uses DPS for opti-
by Direct Policy Search.
Evaluate the complexity for SR is more complicated.
Thanks to the property
above, the SR problem boils down to
•
the noisy optimization (noisy because there are Random Processes involved)
•
of a polynomial time simulator (in the number of time steps, actions, state variables, and data for de�ning the problem).
2 Noisy optimization has complexity roughly squared (O(1/� )) as a function of the requested precision
� over the expected reward, when the objective function is approx-
imately convex (see [51] for related formal de�nitions, which indeed do not require strict convexity). This leads to a bound on the expected time for
O(T × polynomial(k, MDP
SR
2 size)/� ).
However, this is the complexity for �nding a solution for the chosen family of functions; if the parametric function
θ 7→ Πθ
can not do better than a precision
δ > 0,
no convergence to the optimal expected reward can be reached.
Self-Adaptive Evolution Strategy Algorithm 7 presents the Self-Adaptive Evolution Strategy (SA-ES) we use to optimize the parameter
θ
of the parametric policy
Πθ .
This Self-Adaptive Evolu-
tion Strategy is inspired by [52] and uses [53]'s resampling principles for ensuring convergence in spite of noise.
4.1. INTRODUCTION
59
Algorithm 7 Self-Adaptive Evolution Strategy with reevaluations. independent standard Gaussian random variable, with dimension
N denotes some d as required in
equations above.
1: 2:
K > 0, ζ ≥ 0, λ ≥ µ > 0, a dimension d ∈ N∗ d an initial parent population x1,i ∈ R and an initial σ1,i = 1, i ∈ {1, . . . , µ}
Parameters: Input:
3: n ← 1 4: while (stop condition) do 5: Generate λ individuals ij , j ∈ {1, . . . , λ},
independently using
� σj = σn,mod(j−1,µ)+1 × exp
1 N 2d
�
and
ij = xn,mod(j−1,µ)+1 + σj N 6: 7:
Evaluate each of them De�ne
j1 , . . . , jλ
dKnζ e
times and average their �tness values
so that
EdKnζ e [f (ij1 )] ≤ EdKnζ e [f (ij2 )] · · · ≤ EdKnζ e [f (ijλ )] where
8:
Em
denotes a sample average over
Update: compute
xn+1,k
and
σn+1,k = σjk 9: n←n+1 10: end while
σn+1,k and
m
resamplings.
using
xn+1,k = ijk , k ∈ {1, . . . , µ}
CHAPTER 4.
60
DIRECT VALUE SEARCH
Actually, many other non-linear noisy optimization algorithms could be used for
Πθ 's
optimization (e.g. stochastic Newton's method, other ES like CMA-ES [54] or
Fabian's method [51]). For a �rst attempt, we have chosen SA-ES as it as shown good results for similar tasks and it is easy to parallelize, implement and setup. In further work, we will consider other non-linear noisy optimization algorithms and compare their performance in our DVS test cases.
4.1.3
Detailed algorithm
Step 1 (o�ine): compute Given a parametric policy
πθ∗ (.),
πθ ,
get
i.e. optimize the parameter
θ∗
θ
maximising some reward function on simula-
tions. See Alg. 8. Simulations are described in Alg. 9.
Algorithm 8 Optimization of DVS parameters (o�ine SR) with a DPS approach. Input: a parametric policy
πθ (.)
where
πθ
is a mapping from
X
to
U,
a Markovian or Non-Markovian Decision Process MNMDP, an initial state
x
Output: a parameter
θ∗
leading to a policy
Find a parameter
θ∗
πθ∗ (.)
maximising the expectation of the following �tness function:
θ 7→ Simulate(x, MNMDP, πθ )
with a given non-linear noisy optimization algorithm (e.g. SA-ES, CMA-ES, ...)
return
θ∗
Step 2 (online): use The
o�ine
πθ∗ (.)
to solve the actual problem
optimization
(�nding
θ∗
approximately
maximizing
Simulate(x, MNMDP, πθ )) can be stopped at any time. Then:
•
using
t + k;
πθ ∗ ,
we get
πθ∗ (x)
an approximation of the stock marginal value at time
4.1. INTRODUCTION
Algorithm 9
61
Performing a simulation with DVS (online DMR).
Notations:
nf is the normalisation factor of α (ie. maximum valorization values), x+ is the state vector with additional information (time factors described below, . . . ), ut...k := (ut , . . . , ut+k−1 )> is the tuple of decisions from current stage to tactical, ω t...k := (ω t , . . . , ω t+k−1 )> is the tuple of random realizations from current stage to tactical, ut...h := (ut , . . . , ut+h−1 )> is the tuple of decisions from current stage to operational ω t...h := (ω t , . . . , ω t+h−1 )> is the tuple of random realizations from current stage to operational. Simulate(x0 , MNMDP,
πθ )
Input: an initial state
x0 ,
a Markovian or Non-Markovian Decision Process MNMDP, a parametric policy
πθ (x) 7→ α
with
α ∈ [0, 1]
Output: a reward
R
associated to the policy
x0 ← initial_state R←0 for t ← t0 , t0 + h, t0 + 2h, ..., T ω t...k ← get_forecast(.) if
πθ
do
t + k − 1 < T then α ← πθ (x+ t ) αs ← rescale(α, nf ) ut...k ← arg maxu reward (ut...k , ω t...k , xt ) + α> s · xt+k−1
else
ut...k ← arg maxu
reward (ut...k ,
ω t...k , xt )
end if
R ← R + MNMDP_reward(xt , ut...h , ω t...h ) xt+h ← MNMDP_transition(xt , ut...h , ω t...h ) end for return
R
CHAPTER 4.
62
•
DIRECT VALUE SEARCH
we can use it to solve the actual problem, the same manner as in the
Simulate
procedure (Algorithm 9). In Algorithm 9 arg maxu is solved with linear programming solvers and we write + πθ (x+ t ) instead of πθ (xt , t) as we consider time factors are included in xt .
4.2 Experiments We experiment DVS as described in Eq. 4.7 in the following case:
• Πθ (xt , xt+k−1 , t) = πθ (xt , t)> · xt+k−1 , • πθ (., .)
i.e.
Πθ (xt , ., t)
is linear;
is a neural network, with two layers of weights, a sigmoid activation
function, and
N
neurons on the hidden layer.
θ by maximizing θ 7→ Simulate(θ) with a (µ, λ) Self-Adaptive Evolution Strategy (Algorithm 7). We use parameters K = 10, ζ = 2, λ = 4d+4 and µ = dλ/4e where d is the dimension of θ .
We optimize
4.2.1
Settings
We work on a problem de�ned as follows:
•
We have a 10-dimensional energy stock (made of 10 batteries).
•
We have a random market price (which is a random generator, non-Markovian, non-discretized; it can generate arbitrarily many scenarios).
•
168 time-steps are considered (i.e. 7 days with one hour per time step).
•
Operational horizon
h=5
time steps of 1 hour (each decision making covers 5
hours � see Fig. 3.3 in chapter 3).
•
Tactical horizon
k=5
time steps of 1 hour (we use Eq. 4.7 with
k = 5,
i.e. 5
hours � see Fig. 3.3 in chapter 3).
•
Πθ (x, xt+k−1 , t) = πθ (x, t)> · xt+k−1 where πθ (., .) is a neural network with N neurons in a single hidden layer, and weights vector θ . The number of parameters (i.e. the size of θ ) to be optimized by the numerical optimization (presented in section 4.1.2) is N (|x| + 1) + |u|(N + 1). Thus there are 35 parameters to optimize for N = 1 and 60 for N = 2.
As we already said,
4.2. EXPERIMENTS
•
Inputs (i.e.
x+
63
above) of the neural network are the ten battery levels plus
four handcrafted time-dependent auxiliary inputs:
= cos (2π (t + k − 1)/24) = sin (2π (t + k − 1)/24) � � b(t + k − 1)/24c = cos 2π 7 � � b(t + k − 1)/24c = sin 2π 7
hour_of_day_cos_factor hour_of_day_sin_factor hour_of_week_cos_factor
hour_of_week_sin_factor
These extra information are more relevant than the raw time index as the market price oscillate in a daily basis and in a weekly basis (therefore decisions might be correlated with these two informations). This problem is depicted in Fig.
4.1.
The 10 batteries are managed to stock
energy bought and sold on the electricity market and 10 decision variables have to be made at each time step (i.e. the quantity of energy to buy or sell for each battery) in order to maximize pro�ts (equivalently minimize costs).
For each battery, the
maximum input and output capacity is 1000 kW and the maximum storage capacity is 96000 kWh. Batteries have di�erent e�ciencies (the percentage of energy actually sold for a given output command) and a smart control has to take it into account: bi/2c , 0.4). the "output e�ciency" of battery i is 0.8 − max( 10
4.2.2
Baselines
The baselines used for comparison are:
u(x, t) = arg max ut
max
ut+1 ,...,ut+k−1
Ert + · · · + rt+k−1
(4.9)
and
u(x, t) = arg max ut
where function
u
max
ut+1 ,...,ut+k−1
Ert + · · · + rt+k−1 + α> · xt+k−1
(4.10)
is de�ned with a null valorization at tactical horizon in the �rst
case (Eq. 4.9) and with a constant marginal reward in the second case (Eq. 4.10). In Eq. 4.10,
α is a constant vector (a, a, a, . . . , a),
with
a a constant value optimized
numerically. We then reproduce the results (we reproduce both learning and test), after a rescaling of the outputs of the neural network to reasonable values (so that the valorization of each battery ranges from 0 to 40 euros per kilo watts). These additional results are presented in Table 1 and in Fig. 4.3.
CHAPTER 4.
64
4.2.3
DIRECT VALUE SEARCH
Results
Results are presented in Fig.
4.2.
With DVS, we get better results than the two
baseline methods and after rescaling, we obtain a faster convergence. Then, for an equivalent DMR, the improvement compared with null valorization and constant marginal valorization is respectively +80% and +18% for DVS using 1 neuron on the hidden layer of the hidden layer of
πθ .
πθ
and +96% and +34% for DVS using 2 neuron on
These small neural networks are su�cient for the required
policy. Table 1 and Fig. 4.3 show that DVS's valorizations are relevant and give good results. We can see that DVS wisely uses the state information for valorization (i.e. for computing the stock valorization
Πθ (xt , xt+k−1 , t)
in Eq. 4.8); results are clearly
better than our baseline stateless valorization methods.
This validates the DVS's
proof of concept. We will check in further work if DVS can take advantage of its nice properties to e�ciently solve very large scale problems (some being unreachable so far). Quantitatively comparing DVS and SD(D)P or DPS is tricky as assumptions are not the same: S(D)DP requires Markovian Random Process but here we use a general Random Process in our test case and DPS would not comply with the decision constraints unless we make a handcrafted test case speci�c parametric policy. Comparing DVS to each of them according to their own assumptions could be considered for further work but DVS's advantages (no simpli�ed model, no assumption on Random Process, no convexity constraints, many stages, big spaces) would be lost.
4.3 Conclusion We have proposed a variant of Direct Policy Search, as a merge of SDP and DPS. The resulting algorithm, termed DVS, has the following properties:
•
DVS can handle large and/or constrained action spaces; there are 240 decisions, with constraints, in our problem and we can expect much more in further experiments.
•
DVS is completely anytime (i.e. the approach can provide results after a few seconds even if convergence is incomplete - an important property when the problem is part of an investment optimization where many scenarios must be compared).
4.3. CONCLUSION
•
65
It is highly parallel, because it boils down to a highly parallel noisy optimization problem.
•
It can encode non-linear policies, indirectly, without losing the polynomial time DMR, as long as the decision making can be encoded as a linear problem. The model can be arbitrarily complex and can include small time scale e�ects without increasing the state space, whereas SDP-based methods have a precision loss when the number of time-steps increases.
•
DPS does not need convex Bellman values (whereas SDDP does).
Stock-
dependent e�ciencies in pumped-storage systems is not a problem.
•
ADP, SDP and SDDP work with Markovian Random Processes, which is not a requirement for DVS. DVS can be applied on a problem where Random Processes are continuous and not Markovian. This is relevant for climate data.
•
Stopping criteria can be de�ned for SDDP [48, 41] or more generally SDP methods.
These stopping criteria are, by nature, asymptotic, as well as stopping
criteria of noisy optimization algorithms involved in our DVS method.
Further work. We tested Direct Value Search on a simple problem, for which it has given satisfactory results. Our test case is not that much a toy problem: we use a random generator without discretization, which is a challenge for many algorithms. Our approach is, by design, less sensitive to dimension than classical methodologies and does not require any convexity assumption. Therefore Direct Value Search should be tested on very high scale problems (hundreds of stocks and thousands of time steps), showing its ability to handle non-Markovian Random Processes, non-convex Bellman values, high-scale state space.
CHAPTER 4.
66
DIRECT VALUE SEARCH
max_capacityi (kw)
max_capacity1 (kw)
Batteryi
Battery1
kw
(kw ) ut
ll
≤
Se
ma x_ o
w)
(k
kw
ll
ut i
≤
1
_in
i
_o
ax
Se
ma x
y
_in
m
Bu y
Bu
≤
ax
m
output_efficiency1 %
1
...
≤
output_efficiencyi %
Energy market price
Figure 4.1:
Illustration of the considered problem (with a realisation example of the
random market price).
Here, max_ini is the maximum quantity of energy (in kilowatt)
that can be input at any time in the
ith
battery; max_outi is the maximum quantity of
ith battery; max_capacityi th is the maximum capacity (in kilowatt hour) of the i battery; output_e�ciencyi is the th battery for a given output command. percentage of energy actually output of the i energy (in kilowatt) that can be output at any time in the
4.3. CONCLUSION
67
Constant valorization Parameters
Mean reward (Me)
a=0 a=5 a = 10 a = 15 a = 20 a = 25 a = 30 a = 35 a = 40 a = 45 a = 50 a = 55 a = 60 a = 65
1.082 ± 0.018 1.104 ± 0.020 1.292 ± 0.025 1.755 ± 0.032 2.205 ± 0.049 1.959 ± 0.085 0.390 ± 0.143 −2.315 ± 0.216 −6.095 ± 0.264 −10.44 ± 0.291 −15.90 ± 0.299 −20.81 ± 0.282 −25.83 ± 0.257 −30.37 ± 0.228 Direct Value Search
Optimizer SAES 1 neuron SAES 2 neurons Table 4.1:
Mean reward (Me)
2.524 ± 0.004 2.815 ± 0.004
Comparison of mean results obtained with DVS and with constant marginal
valorization (with valorization
α = (a, . . . , a)).
valorization at tactical horizon.
The case
a = 0
corresponds to the null
These results are the mean value of 2000 evaluations
(standard deviation is also given). The mean execution time per evaluation is 1.5 seconds. Computations have been done on an Intel Xeon X5660 CPU (at 2.80GHz) with 49GB RAM. DVS results are given for policies trained with 250000 evaluations (i.e. 250000 calls to the Simulate function).
CHAPTER 4.
68
Evolution of the performance during the DPS policy build
4
Mean reward (M€)
DIRECT VALUE SEARCH
2
0
2
4
Best constant marginal cost
6
Null valorization at tactical horizon DVS (1 neuron)
8 0
Figure 4.2: 4.7 with
20000
40000
60000
80000
100000
Evaluation
120000
140000
160000
180000
DVS's results with 1 neuron, using �5 time-steps aheard� optimization (Eq.
k = 5),
compared to the simple �5 time-steps ahead� optimization without val-
orization (Eq. 4.9) and to a constant marginal valorization of the battery at an optimal price (euros/MWh) with the same �5 time-steps ahead� context (Eq. 4.10, where constant). Error bars show
±
α
is a
standard deviation. Here, printed results are rewards (i.e.
the higher the better).
3.0
Evolution of the performance during the DPS policy build
Mean reward (M )
2.5
2.0
1.5
1.00
Figure 4.3:
50000
100000
Best constant marginal cost Null valorization at tactical horizon DVS (1 neuron) DVS (2 neurons) 150000 200000 250000 300000
Evaluation
Experimental setup as in Fig. 4.2 with rescaled outputs. We also compare 1
neuron and 2 neurons neural networks. The baselines in the comparison are the same as in Fig. 4.2. Comparing this to Fig. 4.2, we see that rescaling the output values to reasonable values makes the convergence faster.
Chapter 5 Noisy Optimization
5.1 Motivation Noisy optimisation is a key component of our Direct Value Search algorithm. It is, more generally, a crucial component of Direct Policy Search. In such frameworks, evolution strategies are widely used. The mathematical theory of evolution strategies has the following limitations:
•
there exist few results in the noisy optimization setup;
•
all existing results are based on very simple functions, typically sphere-like functions.
In Section 5.2, we extend the theory of evolution strategies in the direction of noisy optimization. In particular, we show lower bounds on runtimes. We also perform experiments on some classical variance reduction methodologies (Section 5.3); we design some deceptive functions (showing cases in which the pairing methodology does not work), but get empirically positive results.
Then, the next chapter will
study di�cult functions, with no quasi-convexity assumptions. Some terms used in this chapter and the following one are brie�y explained in Appendix A.
69
CHAPTER 5.
70
NOISY OPTIMIZATION
5.2 Lower bounds on runtimes 5.2.1
Introduction
Considered framework There are many convergence rates known in numerical optimization, depending on assumptions (derivative-free [55] or not, comparison-based [56] or not, global [57] or not). Robustness to noise, even early in the origins of evolutionary computation [58], is cited as a strength of these algorithms. In spite of this strong interest for noise in evolutionary computation, complexity in the noisy case is less clear, because details on the assumption have a big impact on the performance [59, 60, 61, 62, 63, 64]; a main distinction being adaptive noise [65] (with small noise variance around the optimum) and additive noise [66] (with lower-bounded variance around the optimum). Also, de�ning convergence rates is more di�cult when either the algorithm or the ob∗ jective function has a random part, because the distance of xn to the optimum x is not a constant (n being the
nth
objective function evaluation). Various convergence
rates can be de�ned depending on the precise considered de�nition of convergence (we will not give too many details on this in this introduction, but our results will state precisely the de�nitions involved). For example, the algorithm CLOP [67, 68] reaches a convergence
˜ √n) O(1/
kxn − x∗ k =
on a wide range of symmetric objective functions, using regression; in a
very structured case (when the family of functions is very well approximated by a known model), statistical tools (supervised machine learning) provide such fast rates, even on very �at functions. Another example of algorithm for noisy optimization is R-EDA (Racing-based Estimation of Distribution Algorithm, [69, 70]).
It considers a di�erent de�nition
of convergence (more on this later). R-EDA was proposed as a typical noisy optimization algorithm, easy to analyze and making a good approximation of real-world approaches [71].
The noisy optimization framework is described in Algorithm 10
and R-EDA is de�ned in Algorithm 11. For β > 0, the convergence rate is typically 1/β ˜ kxn − x∗ k = O(1/n ) on the family of objective functions
Fβ,γ = {fx∗ ,β,γ (x); x∗ ∈ D} , where
D = [0, 1]d
(5.1)
and
� fx∗ ,β,γ (x) = B γ
kx − x∗ k √ d
�β
! + (1 − γ) .
(5.2)
5.2. LOWER BOUNDS ON RUNTIMES Here
B(p)
71
refers to a Bernoulli random variable with parameter
p and 0 otherwise). Fig. 5.1 x for some set of parameters.
with probability with respect to
p
(i.e. equal to
show the expected values of
1
fx∗ ,β,γ
We will show in this section that R-EDA is optimal within logarithmic factors for
Fβ,γ
under locality assumptions discussed below and for some values of
γ
(case
with variance linearly decreasing as a function of expected �tness values).
Algorithm 10 Noisy optimization framework.
This is not an optimization al-
gorithm; this just explains the framework of noisy optimization with Bernoulli random variables (the �tness function outputs 1 if random (=
Efx∗ ,β,γ (xx∗ ,n,ω,ω0 )). Optimize
ωn )
is less than
is an optimization algorithm taking as input a se-
quence of visited points, their binary noisy �tness values and an internal noise. It outputs a new point to be visited, looking for points
f
x∗ ,β,γ
(x)
x
of the domain such that
is as small as possible.
Input:
ω the uniform noise of f , ω 0 a random seed of the algorithm, x∗ the optimal point, β and γ two �xed parameters of f . Output:
xx∗ ,n,ω,ω0
the estimation of the optimum.
for all
n = 1, 2, 3, . . . do xx∗ ,n,ω,ω0 = Optimize(xx∗ ,1,ω,ω0 , . . . , xx∗ ,n−1,ω,ω0 , y1 , . . . , yn−1 , ω 0 ) if ωn ≤ Efx∗ ,β,γ (xx∗ ,n,ω,ω 0 ) then yn = 1 else
yn = 0 end if end for return
xx∗ ,n,ω,ω0
Symmetry assumptions and information theory We pointed out above that a algorithms (e.g.
˜ √n) O(1/
rate of convergence is possible for some
CLOP) using models which are very close to the real objective
function (for example if we know that the �tness function is a Bernoulli as in Eq.
72
CHAPTER 5.
NOISY OPTIMIZATION
=1
=2 =3
Figure 5.1: Expected values of fx∗ ,β,γ with respect to x, for d = 1 and with the ∗ optimal point x = 0.5, the noise level γ = 0.8 and β (the "�atness" of Ef around x∗ ) equals to 1, 2 and 3.
5.2. LOWER BOUNDS ON RUNTIMES
73
Algorithm 11 R-EDA: algorithm for optimizing noisy �tness functions.
Bernstein − + The initial domain is [x0 , x0 ] ∈
denotes a Bernstein race, as de�ned in Algorithm 12. RD , δ is the con�dence parameter. This algorithm goes back to [69, 70]. Please note − + that xi and xi are indexed by i, the iteration number, and not by the number of evaluations as in our convergence criteria.
n←0 while True do
// Pick the coordinate with highest uncertainty − cn = arg maxi (x+ n )i − (xn )i − + max δn = (xn )cn − (xn )cn for i ∈ [[1, 3]] do // Consider the middle point + x0 in ← 21 (x− n + xn ) // The cth n coordinate may take 3 6= values i−1 + − 0i (x n )cn ← (x− n )cn + 2 (xn − xn )cn
end for
6δ (goodn , badn ) = Bernstein(x0 1n , x0 2n , x0 3n , π2 (n+1) 2 ). // A good and a bad point Let Hn be the halfspace {x ∈ RD ; ||x − goodn || ≤ ||x − badn ||} − + − + Split the domain: [xn+1 , xn+1 ] = Hn ∩ [xn , xn ] n←n+1
end while
5.2). In these algorithms, the sampled point is not necessarily close to the optimum or to the current approximation of the optimum that the algorithm has.
This is
related to information theory: there are areas in which one gets more information than others, and points minimizing
x 7→ Eω f (x, w)
are not necessarily the most
informative. Typically, when you have a relevant model of the objective function, you will learn more about the optimum by sampling maximum uncertainty points (i.e. points
x
such that
close to the optimum.
f (x, ω)
has high variance), rather than by sampling points
CHAPTER 5.
74
NOISY OPTIMIZATION
Algorithm 12 Bernstein race between 3 points. Eq. 5.3 is Bernstein's inequality to compute the precision for empirical estimates (see e.g. [72, p124]); estimate of the standard deviation of point (it is
0
xi 's
in the �rst iteration, which does not alter the algorithm's
is the average of the �tness measurements at Bernstein(x1 , x2 , x3 , δ 0 )
σ ˆi
is the empirical
Ft (xi ) correctness); fˆ(x)
associated random variable
x.
T =0 repeat
T ←T +1 Evaluate the �tness of points
x1 , x2 , x3
once,
i.e.
evaluate the noisy �tness at
each of these points. Evaluate the precision:
� �(T ) = 3 log
3π 2 T 2 6δ 0
s
�
until Two points (good ,bad) satisfy
/T + max σ ˆi i
2 log
�
3π 2 T 2 6δ 0
fˆ(bad) − fˆ(good) ≥ 2�
�
� /T .
return
(5.3)
(good, bad)
1
There are therefore two distinct strategies :
•
sampling close to the current estimation of the optimum;
•
sampling maximum uncertainty areas.
As we have already said, getting knowledge on the objective function far from ∗ the current approximation of the optimum does not help for �nding x if you have no model of the objective function (at least in a setting without tricky local optima). But, if you have a strong prior on the objective function, you can indeed sample only very far from the current estimation of the optimum, at locations where the objective ∗ function is less �at and from this sampling, you get knowledge on x . Again, this leads to algorithms which sample much more far from the current approximation of the optimum than close to it.
1 Interestingly
there were debates on the mailing list dedicated to the BBOB noisy optimization testbeds because its designers assess the quality of optimization algorithms not from their estimation on the location of the optimum, but from the points they sample, which is clearly not fair for algorithms which are precisely based on estimating the optimum from points far from the optimum.
5.2. LOWER BOUNDS ON RUNTIMES
75
These algorithms have two distinct steps:
• Exploration:
choosing a point
• Recommendation:
xn
for which they want to sample
providing an estimate
˜ ∗n x
f (xn ).
arg min Ef .
of
Nevertheless, various compromises are possible (for not relying too much on the model) between strategies relying only on maximum uncertainty (strongly trusting a model) and strategies relying only on sampling close to the estimation of the optimum; [73] is based on methods for choosing to which extent the model should be trusted. So far, we have discussed the distinction between algorithms which sample close to the estimation of the optimum and those which sample at maximum uncertainty areas.
But in this work we will only consider the fastest theoretical convergence
rates for algorithms which sample close to the estimation of the optimum. Formally
locality assumption for some 0 < δ < 1/2 and some d only,
speaking, we assume the following constant
C(d) > 0
depending on
∀f ∈ F, ∀i ≤ n, kxi − x∗ k ≤
C(d) , iα
(5.4)
1 − δ/2; α > 0 large implies that there is a fast convergence. This equation depends on n; in fact, the whole work would make sense with n replaced by ∞, but we can show our results for any n su�ciently large, so we keep this assumption under this form (the main theorem will assume this for all n, but results in it are derived for n su�ciently large).
with probability at least
Actually, convergence rates could be formalized di�erently. might consider that the rate is
α
if
∀f ∈ F, ∀n, kxkn − x∗ k ≤ for some increasing sequence that
∃n; i = kn
kn .
algorithm satis�es Eq. 5.5 but de�ne
•
if
i
C(d) . kn α
(5.5)
This is a weaker assumption, because only
xi
such
have a fast rate; other points can be sampled anywhere in the domain
without modifying the measure
•
For example, we
α of the convergence rate. For instance, the following not Eq. 5.4, for 0 < α < 1/2:
kn = n2 ;
is di�erent from
the domain);
kn
for all
n,
then do
exploration (xi
is uniformly drawn on
CHAPTER 5.
76
•
otherwise, do the
xi
exploitation (xi
NOISY OPTIMIZATION
is the maximum likelihood estimate of
x∗
given
and their �tness evaluations).
Indeed, this algorithm is quite good for the objective function model that we have chosen (see Eq. 5.2); but it does not satisfy Eq.5.4 as some points are sampled far from the optimum. In fact the algorithm above can even be optimized by choosing
xi ,
for exploration, at locations where it is most likely to help �nding the optimum
(this is active learning); see e.g. [74, 75]. Also, sometimes, the
xi
for exploitation
are computed, but not evaluated. When designing a testbed for noisy optimization, this issue makes sense. Many optimization algorithms for noisy settings distinguish be good approximations of the optimum and information about the optimum.
xi 's
xi 's
which are supposed to
which are sampled for gathering
If the testbed makes no di�erence between the
two kinds of points, it implicitly assumes that sampling far from the optimum for gathering information is unlikely to be a good method.
The rates reachable with
no constraints are a well established part of the state of the art [51]; we here focus on rates which can be attained when focusing on Eq. 5.4 as a criterion for convergence. Importantly, this criterion is also relevant when all �tness values sampled are important; e.g. when improving, online, a production unit. To sum up, the locality assumption (Eq.5.4) used to obtain our main result means that the algorithm has a given rate if and only if all its search points follow this rate; it is not allowed, for instance, to have one point out of two which is close to the optimum, and another far away in order to get some information which, for some reason, would help for the convergence. In other words, this assumption means that we consider rates that can be reached without relying on long distance correlations between �tness values. This is by no mean a negligible technical detail; as we have already said, there are fast algorithms which rely on sampling far from the optimum; these fast algorithms, however, can only be fast when there is a strong structure on the objective functions so that sampling far away can provide signi�cant improvements on the convergence rate. This section is devoted to showing bounds on rates for algorithms which do not use such sampling �far� from the current estimate of the optimum. The results can therefore be viewed with two di�erent complementary conclusions:
•
either as the proof that fast rates (faster than the limits obtained in our work) can only be obtained by sampling also far from the optimum;
•
or as the proof that fast rates (faster than the limits obtained in our work) are only possible for algorithm which assume some strong "�atness" of the
5.2. LOWER BOUNDS ON RUNTIMES
77
objective function around the optimum, and these algorithms will not be so fast if we test them on other objective functions. 5.4), we show that for the family Fβ,γ of > 0), α is necessarily less than or equal to 1/β - if the function is very �at around the optimum (β large), the convergence of algorithms sampling close to the optimum (Eq. 5.4) is necessarily slow (α ≤ 1/β in Eq. 5.4). On the other hand, for β = 2, local algorithms (like R-EDA) have the same order as the rate reached by machine learning methods, and can even be better for β = 1, reaching ˜ ˜ √n) by max-uncertainty sampling. O(1/n) when β = 1 instead of O(1/ Under the locality assumption (Eq.
objective functions (γ
Models and Lemmas Algorithm 10 describes our framework. As introduced in section 5.2.1 (Eq. 5.4), we assume, for some
0 < δ < 1/2,
the locality assumption
∀f ∈ F, ∀i ≤ n, kxi − x∗ k ≤ with probability at least
1 − δ/2.
α ˜ O(1/n )
C(d) iα
This contains two important elements:
•
there is an
•
there is no sampling far from the current estimate of the optimum.
convergence to the optimum;
This implies that the algorithm converges and does not sample far from its limit. As already stated in Eq. 5.1 and 5.2, we also consider the family of functions
F = Fβ,γ = {fx∗ ,β,γ (x) ; x∗ ∈ D}, where
� fx∗ ,β,γ (x) = B γ
kxn − x∗ k √ d
!
�β
+ (1 − γ) ,
that is to say the random variable ω is uniform in [0, 1] and � �β kxn −x∗ k √ + (1 − γ) (f (x, ω) = 0 otherwise). if ω ≤ γ d
f (x, ω) = 1
Equation 5.2 and the locality assumption (Eq. 5.4) imply
γ C(d)β Ef (x∗ ) ≤ Ef (xn ) ≤ Ef (x∗ ) + β/2 αβ , | {z } | {z } d n 1−γ
1−γ
if and only
CHAPTER 5.
78
with probability at least The
x∗
n
th
1 − δ/2
function evaluation
and where
yn
Ef (x)
variables
ω
is a short notation for
is, by de�nition, at
(which speci�es the objective function),
NOISY OPTIMIZATION
xx∗ ,n,ω,ω0
Eω f (x, ω).
which depends on
ω
(which is the sequence of random 0 of the stochasticity of the objective function), ω (which is the sequence
of random choices within the optimization algorithm, which might be stochastic). It also depends on
β
and
γ,
but these will be considered as �xed. 0 For short, we will note Xn,Ω , with Ω = (ω, ω ) the set of all the
xx∗ ,n,ω,ω0
for all
x∗ ,
Xn,Ω is the set of all points which can be chosen by the optimization Optimize for the nth point to sample if we consider a given noise and
that is to say algorithm
internal randomness. To obtain our main result, we �rst need the following combinatorial lemma :
Lemma 1
The cardinality of Xn,Ω is at most 2N , where N is the cardinality of β γ C(d) . 1 ≤ i ≤ n ; Ef (x∗ ) ≤ ωi ≤ Ef (x∗ ) + β/2 αβ | {z } d | {z } i 1−γ
Proof values
1−γ
xn is deterministic as a function of Ω and of the �tness values; so the possible N of xx∗ ,n,ω,ω 0 only depend on the 2 possible values of the yi for i in the set
above. We also need the following
Lemma 2
Let N be the cardinality of � � γ C(d)β ∗ ∗ 1 ≤ i ≤ n ; Ef (x ) ≤ ωi ≤ Ef (x ) + β/2 αβ . d i
Then, N has expectation at most
z=
n X β C(d) i−αβ dβ/2 i=1
γ
(5.6)
and variance also at most z . which is a direct consequence of the de�nition of
N.
Lemma 2 and Chebyshev's inequality [76, 77, 78] ensure the following lemma:
Lemma 3
√ Consider δ ∈ [0, 1]. N ≤ z + z (δ/2)−1/2 with probability at least 1−δ/2.
Lemmas 1 and 3 together imply that the cardinality of √ z+ √ z δ/2
2 with probability at least
1 − δ/2.
Xn,Ω
is at most (5.7)
5.2. LOWER BOUNDS ON RUNTIMES
5.2.2
79
Main results
Assume that F is as proposed in Eq. 5.2 for some 1 > γ > 0 and β > 0. Assume that Eq. 5.4 (locality assumption) holds for all n ≥ 1, d ≥ 1, and for some C(d), δ < 1, α > 0, that is to say Theorem 1
∀f ∈ F, ∀i ≤ n, kxi − x∗ k ≤
C(d) , iα
with probability at least 1 − δ/2. Then α ≤ 1/β .
αβ ≤ 1. In order to do so, let us assume, in order to get a αβ > 1; then, knowing convergence of Riemann series for αβ > 1
Proof Let us show that contradiction, that
n X 1 αβ i i=1
1
Consider any optimization algorithm (stochastic or not). �niteness of constant
C
z,
(5.8)
Eq.
5.8 implies the
Xn,Ω , bounded 1 − δ/2.
and therefore by Eq. 5.7 the �niteness of
independent of
n,
with probability at least
above by a
We will here use sets of points with lower bounded distance to each other; such sets are classical in statistics [79], and are now also used for building lower bounds based on information theory [80, 81]. 0 Consider R a set of cardinality C such that
1 − 2δ C0 > C 1−δ
(5.9)
and such that two distinct elements of R are at distance greater than 2�, with � = C(d)/nα , from each other; such a set certainly exists if n is large enough. A nice ∗ property of this set is that if the optimum x is uniformly drawn in R, then it can α only be found with probability 1 − δ/2 and with precision C(d)/n if Xn,Ω contains one point close to
r
for a proportion at least
1 − δ/2
of points
r ∈ R.
CHAPTER 5.
80
Consider
fx∗ = fx∗ ,β,γ ≤ ≤ ≤
C) δ C δ (1 − ) 0 + 2 C 2 δ 1− 2
where Enl(U, �) is the
�-enlargement Enl(U, �)
of
U
de�ned as:
= {x; ∃x0 ∈ U, kx − x0 k ≤ �} .
This contradicts Eq. 5.4. This concludes the proof of
5.2.3
αβ ≤ 1.
Conclusion
Our results are based on the in some cases.
locality assumption
(Eq. 5.4). They show tight results
The locality assumption is somewhat natural, as most evolution
strategies (not all, but almost all) verify this assumption; for example, [82], one of the main evolutionary optimization convergence results, shows a linear convergence, with no sampling far away; [83], showing faster rates with surrogate models, also veri�es this assumption; and polynomial rates in noisy optimization as in [68, 84] have the same property as well as many experimentally known rates [85]. Nonetheless, other assumptions leading to similar results (e.g.
assumptions ensuring that points far
from the optimum cannot help too much) are worth being investigated for clarifying the overall picture. Basically, our results are about optimization tricks as follows: an optimization algorithm uses the
far sampling trick
if there is a clear distinction between the ap-
proximation of the optimum that they propose and the search points that they use for exploring the �tness function. Our results can be seen either:
•
As proofs that fast rates (faster than those in the tables below) are possible only if you assume that points far away from the optimum do bring information, by statistical model estimation, which are relevant for improving the rate (so that the �far sampling trick� can work).
5.2. LOWER BOUNDS ON RUNTIMES
•
81
As proofs that algorithms which, like most evolutionary algorithms (but not all), do not sample far away from the optimum, can not be optimal when the function is "�at" enough around the optimum (there are algorithms and families of functions for which better rates are possible - which does not mean that algorithms which do not want to use the far sampling trick are necessarily bad algorithms).
The hot discussions on the BBOB mailing list, around the fact that the testbeds should distinguish the search points used for approximating the optimum and the search points used for gathering information by sampling far away, suggest that our work comes at the right moment for noisy optimization formal analysis. Table 5.1 summarizes the state of the art; new result from our work are in bold, and we emphasize cases in which a gap is known. the tightness in the case
γ =1
We see that our results show
(small noise; the variance goes to zero around the
optimum), and reduce the gap in the case
γ < 1
(large noise).
Our results also
show that for fast rates, sampling far from the optimum is necessary; e.g. if
α = 1/2
β = 4,
is possible only with sampling far from the optimum. Though, this is only
possible if there are long-range dependencies on the �tness function, so that such points far from the optimum can be used.
Further work The locality assumption might be realistic or not, depending on the application. From many discussions around that, we believe that there is room for works like this one, in which a locality assumption prevents the use of information far from the optimum, reliable only when strong assumptions on the model are available. It is also a model which shows that some rates imply sampling far from the optimum. Fast optimization algorithms might, as CLOP, be a compromise between sampling close to the optimum and sampling on areas of maximum uncertainty. Further investigations on intermediate models might be a good idea. There is still a gap between the upper and the lower bound, for algorithms having the locality assumption, in the case
γ < 1 (large noise), which is an immediate further
work. We consider noisy optimization in the case of local convergence; clearly, the global convergence case can also be interesting [88]. We did not compute exactly constants
C
and
C 0.
Maybe it is possible to obtain
more information on the constant in the convergence using detailed computations of C and C 0 .
CHAPTER 5.
82
NOISY OPTIMIZATION
Proved rate for R-EDA
in
("�atness" an "Flatness"
β
[70]
envelope
of
the
�tness
function; �tness
R-EDA
on
the
function
experimenLower
tal rate in
bound
[68]
in [70]
functions
does not have to be ∗
x
�at
around
with
(on in-
variances)
Our
work
(lower bound under locality assump-
Rate
for
learnable cases
tion)
)
γ = 1 (small noise) α≤1 α=1 α≤1 α = 1/2 α≤1 α = 1/4 Framework γ < 1 (large noise) α≤1 α = 1/2 α≤1 α = 1/4 α≤1 α = 1/8
Framework
α≥1 α ≥ 1/2 α ≥ 1/4
1 2 4
α ≥ 1/2 α ≥ 1/4 α ≥ 1/8
1 2 4
Table 5.1: ||˜ xn − x∗ ||
α≤1 α ≤ 1/2 α ≤ 1/4
α = 1/2 α = 1/2 α = 1/2
α≤1 α ≤ 1/2 α ≤ 1/4
α = 1/2 α = 1/2 α = 1/2
This table summarizes the state of the art in terms of
α
for which
α ˜ = O(1/n )
is possible. Rates for E-EDA include functions which are not ∗ di�erentiable, and are just upper bounded by �at functions around x with β coe�cient; see [68] for more details. Experimental rates for R-EDA are for functions with strong invariances/symmetries; see [68] for details. The last column presents results with
α = 1/2,
corresponding to cases in which using statistical model estimation
is possible: the limit case of in�nite di�erentiability in [86, 87, 51], is also reached by quadratic logistic regression under parametric assumptions on the objective function [68]; assumptions are not directly comparable to those of the other columns. Lower bounds on the complexity (upper bounds on additional assumption of local sampling.
α)
from our work are under the
5.3. VARIANCE REDUCTION
83
5.3 Variance reduction In this section, we consider noisy optimization and some traditional variance reduction techniques aimed at improving the convergence rate, namely (i) common random numbers, which is relevant for population-based noisy optimization, and (ii) strati�ed sampling, which is relevant for most noisy optimization problems. We present arti�cial models of noise for which common random numbers are very e�cient, and arti�cial models of noise for which common random numbers are detrimental. We then experiment on a desperately expensive unit commitment problem. sampling is never detrimental.
Strati�ed
In practice, common random numbers nonetheless
provided most of the improvement.
5.3.1
Introduction
f (x, ω), with x in a d-dimensional domain and ω a random variable with values in D ⊂ R. We assume that the optimization algorithm has only access to random realizations of f (x, ω). The goal of the optimization algorithm is ∗ to approximate x = arg min Eω f (x, ω).
We consider a function
x∈X
Noisy optimization with variance reduction In standard noisy optimization frameworks, the black-box noisy optimization algorithm, for its
nth
request to the black-box objective function, can only provide
receive a realization of
ω.
x and
ωn , n ∈ {1, 2, . . .}, are independent copies of ωn . Contrarily to this standard setting, we here request f (x, ωn ) where ωn is: (i) either an indepen-
f (x, ωn ).
The
The algorithm can not in�uence
assume that the algorithm can dent copy of realization
ω
ωm
(independent of all previously used values); (ii) or a previously used
m < n (m is chosen by the common random numbers can be
for some
optimization algorithm). Due
ωn can strata. A stratum is a subset of D . Strata have empty intersections and their union is D (they realize a partition of D ). When an independent copy of ω is requested, the algorithm to this possibility,
applied, i.e. the same
be used several times, as explained later. We also assume that we have
can decide to provide it conditionally to a chosen stratum. Thanks to strata, we can apply
strati�ed sampling.
Statistics of variance reduction Monte Carlo methods aim at the estimation of the expected value of a random variable owing to a randomly drawn sample. Typically, in our context,
f (x, ω) can be
CHAPTER 5.
84
NOISY OPTIMIZATION
f (x, ω1 ), f (x, ω2 ), . . . , f (x, ωn ), where the ωi are independent copies of ω , i ∈ {1, . . . , n}. Laws of large numbers prove, under various assumptions,
estimated as a result of
the convergence of Monte Carlo estimates such as
n
X ˆ (x, ω) = 1 f (x, ωi ) → Eω f (x, ω). Ef n i=1
(5.10)
There are classical techniques for improving the convergence:
Antithetic variates (symmetries): using symmetries.
0,
E.g.
then, instead of Eq.
ensure some regularity of the sampling by
if the random variable 5.10, we use Eq.
ω
is invariant by symmetry w.r.t
5.11, which reduces the variance.
More
sophisticated antithetic variables are possible (combining several symmetries).
n/2
X ˆ (x, ω) = 1 Ef (f (x, ωi ) + f (x, −ωi )) . n i=1 Importance sampling: density
dP 0 .
We choose
ω0
(5.11)
ω with density dP , we sample ω 0 with 0 0 density dP of ω is higher in parts of the
instead of sampling such that the
domain which are critical for the estimation. However, this change of distribution will introduce a bias. Therefore, when computing the average, we change the weights of individuals by the ratio of probability densities as shown in Eq. 5.12.
n
X dP (ωi ) ˆ (x, ω) = 1 (f (x, ωi )) . Ef n i=1 dP 0 (ωi ) Quasi Monte Carlo methods:
(5.12)
use samples aimed at being as uniform as possible
over the domain. Quasi Monte Carlo methods are widely used in integration; thanks to modern randomized Quasi Monte Carlo methods, they are usually at least as e�cient as Monte Carlo in bad cases and much better in good situations [89, 90, 91]. There are interesting (but di�cult and rather �white box�) tricks for making them applicable for time-dependent random processes with many time steps [92].
Finite sample which approximate a random process:
[93] proposes to gen-
erate a �nite sample which approximate a random process for some metric.
This
method has advantages when applied in the framework of Bellman algorithms, but it is hardly applicable when aiming at the convergence to the solution for the underlying random process.
5.3. VARIANCE REDUCTION
Control
variates:
E (f (x, ω) − g(x, ω)),
instead
85
of
Ef (x, ω),
estimating
we
estimate
B
has a small
using
Ef (x, ω) = Eg(x, ω) +E (f (x, ω) − g(x, ω)) . | {z } | {z } A
B
g is a reasonable approximation of f A can be computed quickly (e.g. if f or A can be computed analytically).
This makes sense if
(so that term
variance) and term
computing
than computing
Strati�ed sampling:
is the case in which each
ωi
g
is much faster
is randomly drawn conditionally
ω is partitioned into disjoint strata S1 , . . . , SN . N is the number of strata. The strati�cation function i 7→ s(i) is chosen by the algorithm. ωi is randomly drawn conditionally to ωi ∈ Ss(i) . to a stratum (Eq. 5.13). We consider that the domain of
ˆ (x, ω) = Ef
X i∈{1,...,n}
Card
P (ω ∈ s(i))f (x, ωi ) . {j ∈ {1, . . . , n}; ωj ∈ s(i)}
(5.13)
correlated sampling, paired comparison or paired sampling, refers to the case where we want to know Ef (x, ω) for several x, and use the same samples ω1 , . . . , ωn for the di�erent possible values of x. Common random numbers (CRN):
In this work, we focus on
also named
strati�ed sampling
and
common random numbers,
in the
context of optimization with arbitrary random processes. They are easy to adapt to such a context, which is not true for other methods cited above.
Strati�ed sampling Strati�ed sampling involves (i) building strata and (ii) sampling in these strata.
Simultaneously building strata and sampling:
There are some works doing
both simultaneously, i.e. build strata adaptively depending on current samples. For example, [94, 95] present an iterative algorithm which strati�es a highly skewed population into a take-all stratum and a number of take-some strata. [96] improves their algorithm by taking into account the gap between the variable used for stratifying and the random value to be integrated.
CHAPTER 5.
86
A priori strati�cation:
NOISY OPTIMIZATION
However, frequently, strata are built in an ad hoc manner
depending on the application at hand. For example, an auxiliary variable g(ω) might ∗ approximate ω 7→ f (x , ω), and then strata can be de�ned as a partition of the g(ω). It is also convenient for visualization, as in many cases the user is interested in ∗ viewing statistics for ω leading to extreme values of Eω f (x , ω). More generally, two criteria dictate the choice of strata:
•
a small variance inside each stratum, i.e.
S, •
V arω|S f (x∗ , ω) small for each stratum
is a good idea;
interpretable strata for visualization purpose.
The sampling can be
• proportional,
i.e. the number of samples in each stratum
the probability
S
is proportional to
P (ω ∈ S);
• optimal, i.e. the number of samples in stratum S is proportional p to a product of P (ω ∈ S) and an approximation of the standard deviation V arω|S f (x∗ , ω). In this case, reweighting is necessary, as in Eq. 5.13.
Strati�ed noisy optimization:
Compared to classical strati�ed Monte Carlo, ∗ an additional di�culty when working in strati�ed noisy optimization is that x is ∗ unknown, so we can not easily sample f (x , ω). Also, the strata should be used
x; if some V arω|S f (x, ω) is
for many di�erent the variance
of them are very di�erent, nothing guarantees that ∗ approximately the same for each x and for x . As
a consequence, there are few works using strati�cation for noisy optimization and there is, to the best of our knowledge, no work using optimal sampling for noisy optimization, although there are many works around optimal sampling.
We will
here focus on the simple proportional case. [97] uses the word �strati�ed� for de�ning their sampling applied to noisy optimization; however it is
Latin Hypercube Sampling
(LHS) rather than strati�ed sampling.
Common random numbers Common Random Numbers (CRN), is a simple but powerful technique for variance d reduction in noisy optimization problems. Consider x1 , x2 ∈ R , where d is the
5.3. VARIANCE REDUCTION dimension of search domain and
V ar
X
87
ωi
denotes the
ith
independent copy of
ω:
(f (x1 , ωi ) − f (x2 , ω 0 i )) = nV ar(f (x1 , ωi ) − f (x2 , ω 0 i ))
i∈{1,...,n}
= nV ar f (x1 , ωi ) + nV ar f (x2 , ω 0 i ) − 2n × Covariance(f (x1 , ωi ), f (x2 , ω 0 i )) X X = V ar f (x1 , ωi ) + V ar f (x2 , ω 0 i ) i∈{1,...,n}
i∈{1,...,n}
− 2n × Covariance(f (x1 , ωi ), f (x2 , ω 0 i )). Covariance(f (x1 , ωi ), f (x2 , ω 0 i )) > 0, i.e. there is a positive correlation between f (x1 , ωi ) and f (x2 , ω 0 i ), the estimation errors are smaller. CRN is based on ωi = ω 0 i , 0 which is usually a simple and e�cient solution for correlating f (x1 , ωi ) and f (x2 , ω i ); If
there are examples in which, however, this correlation does not exist. 5.3.3, we will present examples in which CRN does not work. di�erent application domains related to optimization:
In Section
Pairing is used in
In games, it is a common
practice to compare algorithms based on their behaviors on a �nite constant set of examples [98]. The cost of labelling is a classical reason for this. This is di�erent from simulating against paired random realizations, though it is also a form of pairing and is related to our framework of dynamic optimization.
More generally, paired
statistical tests improve the performance of stochastic optimization methods, e.g.
Di�erential Evolution [101]. [102] proposes a paired comparison-based Interactive Di�erential Evolution method with faster rates. In Direct Policy Search, paired noisy optimization has been proposed in [103, 104, dynamic
Random Search
[99, 100] and
105]. Our work follows such approaches and combines them with strati�ed sampling. This is developed in the next section. In
Stochastic Dynamic Programming (section 3.2) and its dual counterpart Dual Sample Average Approximation (SAA) reduces the
SDP (section 3.3), the classical
problem to a �nite set of scenarios; the same set of random seeds is used for all the optimization runs.
It is indeed often di�cult to do better, because there are
sometimes not in�nitely many scenarios available. Variants of dual SDP have also been tested with increasing set of random realizations [106] or one (new, independent) random realization per iteration [107]. A key point in SDP is that one must take care of anticipativity constraints, which are usually tackled by a special structure of the random process. This is beyond the scope of this work; we focus on direct policy search, in which this issue is far less relevant as long as we can sample in�nitely many scenarios. However, our results on the compared bene�ts of strati�ed sampling and common random numbers suggest similar tests in non direct approaches using Bellman values.
CHAPTER 5.
88
NOISY OPTIMIZATION
Paired noisy optimization for dynamic problems.
Paired statistical tests
(e.g. Pegasus [108]) convert a stochastic optimization problem into a deterministic and easier one. Although Pegasus can cause excessive �over�tting� (specialization to the set of considered seeds) when using a �xed number of scenarios, several methods, e.g. using
Wilcoxon signed rank sum test
can reduce the �over�tting� [103, 104].
or changing the scenarios during learning,
Wilcoxon signed rank sum test
pays more
attention to small improvements across all scenarios rather than large changes over the return of an individual one, so that it can reduce the �over�tting� caused by a few extreme (good or bad) scenarios.
[104] also shows that using an adaptive
number of trials for each policy can speed-up learning in such a CRN framework.
Independent Random Numbers Partial Common Random Numbers
The most related existing work is [105]. It compares (IRN),
Common Random Numbers
(CRN) and
(PCRN, which use pairing in the sense that the same pseudo-random numbers are
Simultaneous Perturbation Stochastic Finite Di�erences Stochastic Approximation. Both algorithms
used several times but in di�erent orders) for
Approximation
and
are faster when using CRN.
Di�erent forms of pairing. oracle,
the
algorithm
{seedn,1 , . . . , seedn,mn }.
also
For each request
xn
Seedn
of
provides
a
set
to the objective function random
seeds;
Seedn =
One can see in the literature di�erent kinds of pairing.
The simplest one is as follows: all sets of random seeds are equal for all search points evaluated during the run, i.e.
Seedn
is the same for all
n.
The drawback of this ap-
proach is that it relies on a sample average approximation: the good news is that the objective function becomes deterministic; but the approximation of the optimum is only good up to the relevance of the chosen sample and we can not guarantee conver-
mn increasing and nested sets Seedn , seedn,i = seedn+1,i . A more sophisticated
gence to the real optimum. Variants consider such as
∀(n ∈ N, i ≤ mn ), mn+1 ≥ mn
and
version is that all random seeds are equal inside an o�spring, but they are changed between o�spring (see discussion above).
However, to the best of our knowledge,
there is no published work about using a common pool of random seeds for all search points, and then randomly drawing a subset of this pool for each search point. In Section 5.3.3, we explain on an illustrative example why in some cases, pairing can be detrimental. It might therefore make sense to have partial pairing. In order to have the best of both worlds, we propose below an algorithm for switching smoothly from full pairing to no pairing at all.
5.3. VARIANCE REDUCTION
5.3.2
89
Algorithms
We have seen that pairing can be e�cient or detrimental depending on the problem. We will here propose intermediate algorithms, somewhere in between the paired case (g(n)
= r(n)
below) and the totally unpaired case (g(n) large, see below as well).
Let us consider algorithms with:
• λ •
individuals to be evaluated at each iteration;
each of these with
Pg(n) •
r(n)
individuals is evaluated
is a set of cardinal
r(n)
times (n is the iteration index)
g(n)
(with
g(n) ≥ r(n)),
Pg(n) .
which is either:
0 00 {(ω10 , ω100 ), (ω20 , ω200 ), . . . , (ωg(n) , ωg(n) )} 0 00 distributed, identically to ω = (ω , ω );
(ωi0 , ωi00 )
inde-
an independently drawn random set of cardinal 0 00 according to the distribution of ω = (ω , ω ).
g(n)
nested case: the set pendently
•
λ
distinct random seeds randomly drawn in the family
, with
or independent case:
5.3.3
Experiments
Arti�cial experiments We consider a λ = 8d2 , µ =
(µ/µ, λ)-Self-Adaptive min(2d, round(λ/4)).
Evolution Strategy (see section 4.1.2), with All experiments are performed with 10000
function evaluations and are reproduced 9999 times.
Why common random numbers can be detrimental.
The phenomenon by
which common random numbers can improve convergence rates is well understood; correlating the noise between several points tends to transform the noise into a constant additive term, which has therefore less impact - a perfectly constant additive term would not change any comparison and has no impact on the algorithm run. Setting
α=1
in Eq. 5.14 (below) provides an example in which pairing totally can-
cels the noise. We here explain why CRN can be detrimental on a simple illustrative example: Let us assume (toy example) that:
•
we evaluate an investment policy on a wind farm;
•
we assume that a key parameter is the orientation of the wind turbines;
•
a crucial part of the noise is the orientation of wind;
CHAPTER 5.
90
•
NOISY OPTIMIZATION
we evaluate 30 di�erent individuals per generation, which are 30 di�erent policies - each individual has a dominant orientation;
•
each policy is evaluated on 50 di�erent simulated wind events.
With CRN: If the wind orientation was on average more East than it would be on expectation, then this �East orientation bias� is the same for all evaluated policies. As a consequence, the good individuals are more East-oriented. The next iterate is therefore biased toward East-oriented.
Without CRN: (i) Even if the wind orientation is too much East for the simulated wind events for individual 1, such a bias is unlikely to occur for all individuals. (ii) Therefore, some individuals will be selected with a East orientation bias, but others with a West orientation bias or other biases. (iii) As a conclusion, the next iterate will incur an average of many uncorrelated random biases, which is therefore less biased. We will design an arti�cial testbed which smoothly (parametrically depending on
α)
switches from ideal case for pairing (pairing cancels the noise) to a worst case
setting for pairing (as illustrated above). We will compare strati�ed sampling and common random numbers on this arti�cial testbed. Later, we will consider a realistic application.
Arti�cial testbed for paired noisy optimization.
With
ω = (ω 0 , ω 00 ),
let us
de�ne
f (x, ω) = ||x||2 + αω 0 + 20(1 − α)ω 00 · x. where
· denotes the scalar product.
(5.14)
Two di�erent cases are considered for the random
processes:
•
Continuous case: and
•
ω 00
is a
−1
is a unidimensional standard Gaussian random variable
d-dimensional
Discrete case: a vector of
ω0
d
ω0
standard Gaussian random variable.
1 00 and ω is 2 1 with probability and 2
is a Bernoulli random variable with parameter
independent random variables equal to
1
otherwise.
For the strati�ed sampling, in case of 4 strata, we use the 2 �rst components of which leads to 4 di�erent cases: one for one for
•
(1, −1).
(−1, −1),
one for
(1, 1),
The motivations for this testbed are as follows:
It is a generalization of the classical sphere function.
one for
(−1, 1)
ω 00 , and
5.3. VARIANCE REDUCTION
•
The case
α=1
91
enough for fast convergence, as in the cancelling noise, even with
•
The case
α=0
Sample Average Approximation is noise-free case, r(n) = g(n) leads to
is very easy for pairing: a
r(n) = 1.
is very hard for pairing; the case
r(n) = g(n)
means that the
noise has the same bias for all points.
•
For the noisy framework, the strati�ed sampling directly reduces the dimension of the noisy case: the two �rst components have no more noise in the strati�ed case.
Experimental results. where
x
is the estimate of the
the optimum is
0.
E log(||x||2 )/log(ne ) (the lower the better), optimum after ne = 10000 function evaluations and
We study
Experiments are reproduced 9999 times.
The continuous case
±0.0015 for the worst cases (i) When α is close to 1, β small 0, β large (nearly no pairing) is
leads to results in Table 5.2. Standard deviations are and are not presented. Essentially, the results are: (more pairing) is better.
(ii) When
α
is close to
better.
In the discrete case, it is easy to de�ne pairing as we can use strata that 00 correspond to distinct values of the two �rst components of ω . Using the four strata 00 corresponding to the 2 possible values of each of the two �rst components of ω , we get the results presented in Table 5.3. We still see that pairing is good or bad depending on the case (sometimes leading to no convergence whereas the non-paired case converges, see row
α=0
in dimension 5) and never brings huge improvements;
whereas strati�ed sampling is always a good idea in our experiments.
Real world experiments For the real world experiments, the same framework as presented in chapter 4 is considered. This framework is described in section 4.2.1. We use the same settings
operational horizon h = 5 time steps (i.e. covers 5 time steps) and a tactical horizon k = 10
here, except that we use an
each time
we make a decision, it
time steps
(i.e. we optimize over the 10 next time steps to speed up computations instead of doing it for all remaining time steps). We use Direct Value Search (chapter 4) as the resolution method in these experiments. Like in chapter 4, a
(µ, λ)-evolution strategy
is used to optimize the parametric policy which approximates of the valorization function
V.
Moreover, like in chapter 4, this parametric policy is a neural network
with one hidden layer. The following setup is
(µ, λ)-evolution strategy is described in section 4.1.2. used: d = 60 (number of weights in the neural network); The
CHAPTER 5.
92
√ λ = 4(d + 1) = 244; µ = λ/4; r(n) = d10 n + 1e.
NOISY OPTIMIZATION
We de�ne paired optimization
(common random numbers) and strati�ed sampling in such a case:
•
We apply the evolutionary algorithm for optimizing the parameters (i.e. the weights) of the neural network controller.
•
Each (noisy) evaluation within the evolutionary algorithms is a Monte Carlo average reward for a vector of parameters; a Monte Carlo evaluation is a call to
f (x, ω).
Here,
f
is the �Simulate� function de�ned in Algorithm 9. It repeatedly
applies the parametric policy and the transition function from an initial state to a �nal state. The returned value is the cumulated reward (or cost).
•
These evaluations are either pure Monte Carlo, paired Monte Carlo, strati�ed Monte Carlo or paired strati�ed Monte Carlo.
Common random numbers for energy policies.
In the case of CRN (also
known as pairing) for the speci�c case of energy policies, we apply
r(n) = g(n),
i.e.
ω1 , . . . , ωr(n) are used for all individuals of a generation (of algorithm). The random outcomes ω1 , . . . , ωr(n) are independently
the same random outcomes the evolutionary
drawn for each new generation.
Strati�ed sampling for energy policies.
Strati�cation in the general case was
de�ned earlier; we here discuss the application to our speci�c problem.
It is very
natural, as far as possible, to ensure that points are equally sampled among (i) the 25% best cases (ii) the 25% worst cases (iii) the second quartile (iv) the third quartile. Even if these categories can only be approximately evaluated, this should decrease the variance. It is usually a good idea to stratify according to quantiles of a quantity which is as related as possible to the quantity to be averaged, i.e.
f (x, ω).
The four
strata are the four quantiles on the annual average of an important scalar component of the noise.
Experimental results
in Fig. 5.2 show that pairing provides huge improvement
in the realistic case. Strati�cation has a minor impact.
5.3.4
Conclusions
We tested, in Direct Policy Search, paired optimization and partial variants of it. We also tested strati�ed sampling. Both algorithms are easy to implement, �almost� black-box and applicable for most applications. Paired optimization is unstable; it
5.3. VARIANCE REDUCTION
3.0
93
Evolution of the performance during the DPS policy build
2.5
Mean reward (M )
2.0 1.5
1.0
0.5 0.00
10000
20000
30000
40000
Evaluation
Pairing and stratification Pairing Reference Stratification (noise factor) 50000 60000 70000 80000
Figure 5.2: X-axis: evaluation index. Y-axis: reward (the higher the better). We see that pairing is very e�cient whereas strati�cation provides no clear improvement.
can be e�cient in simple cases, but detrimental with more di�cult models of noise, as shown by results on
α = 1 (positive e�ect) and α = 0 (negative e�ect) in the arti�cial
case (Eq. 5.14). We provided illustrative examples of such a detrimental e�ect (Section 5.3.3). Strati�cation had sometimes a positive e�ect on the arti�cial test case and was never detrimental. Nonetheless, on the realistic problem, pairing provided a great improvement, much more than strati�cation. Pairing and strati�cation are not totally black box; however, implementing strati�cation and pairing is usually easy and fast and we could do it easily on our realistic problem. We tested an intermediate algorithm with a parameter for switching smoothly from fully paired noisy optimization to totally unpaired noisy optimization. However, this parametrized algorithm (intermediate values of (β
= ∞).
β)
was not clearly better than the fully unpaired algorithm
It was not more robust in the case
α = 0,
unless
β
is so large that there
is essentially no pairing at all. As a conclusion, we �rmly recommend common random numbers for population-based noisy optimization. Realistic counter-examples to CRN's e�ciency would be welcome - we had such detrimental e�ects only in arti�cially built counter-example. There are probably cases (e.g. problems with rare critical cases) in which strati�cation also helps a lot, though this was not established by our application (which does not have natural strata).
CHAPTER 5.
94
Further work.
NOISY OPTIMIZATION
Other variance reduction techniques are possible. Methodologies
protecting variance reduction techniques from their possible detrimental e�ects are a nice challenge (e.g. as e�cient as CRN when when
α = 0).
α=1
and as e�cient as no pairing
5.3. VARIANCE REDUCTION
α
β = 1.0
(paired) -0.07435 -0.34475
α=0 α = 0.8 α=1
-0.75048
α=0 α=1
-0.47681
-0.06258 0.02965 -0.15077
α=0 α = 0.8 α=1
-0.23235
β = 1.16
95
β = 1.35
β = 1.57
β = 1.82
β = 2.12
dimension 2 (bold for best tested algorithm) -0.06654 -0.07670 -0.08581 -0.09219 -0.09603 -0.34661 -0.35921 -0.36253 -0.36565 -0.36709 -0.52772 -0.50544 -0.49794 -0.49109 -0.49339 dimension 3 (bold for best tested algorithm) -0.06373 -0.07978 -0.09489 -0.10463 -0.10931 -0.43320 -0.41439 -0.41004 -0.40880 -0.40202 dimension 5 (bold for best tested algorithm) 0.03964 0.04409 0.04394 0.04680 0.04826 -0.15977 -0.16369 -0.16687 -0.16770 -0.16793 -0.23188 -0.23174 -0.23125 -0.23225 -0.23232 Dimension 10 (bold for best tested algorithm)
-0.09344 -0.36917
-0.49182
-0.10977
-0.39641 0.04823
-0.16920
-0.23182 β=∞
β=1
(paired) 0.097 0.038
α=0 α = 0.8 α = 1.0
β = 2.46
(' unpaired)
(' unpaired) -0.033 -0.053
-0.054
-0.057
Table 5.2: E�ciency of pairing (i.e. case
β
small) in the continuous case. Left hand side
columns (β small) have more pairing than right hand side columns. Pairing is e�cient for the �gentle� noise
α = 1, up to a moderate 50% faster;
but it is harmful when
α = 0 (correlated
noise). Next results will investigate strati�cation. Bold font shows best performance and signi�cant improvements. values of
β
Positive numbers correspond to no convergence.
Intermediate
(intermediate levels of pairing) were never signi�cantly better than others and
not clearly more robust to changes in
α.
CHAPTER 5.
96
α α=0 α=1 α=0 α = 0.4 α = 0.8 α=1 α=0 α = 0.8 α=1 α=0 α=1 α=0 α=1
β = 1.0
β = 1.16
β = 1.35
β = 1.57
NOISY OPTIMIZATION
β = 1.82
β = 2.12
dimension 2, no strati�ed sampling (bold for signif. best) -0.07200 -0.06392 -0.07926 -0.08873 -0.09539 -0.09443 -0.09382 -0.74716 -0.52659 -0.50665 -0.49758 -0.49383 -0.49402 -0.49310 dimension 3, no strati�ed sampling (bold for signif. best) -0.00802 -0.00519 -0.01246 -0.01672 -0.01750 -0.01660 -0.01635 -0.09327 -0.10422 -0.11704 -0.12771 -0.13248 -0.13375 -0.13138 -0.25365 -0.27016 -0.28168 -0.29045 -0.29341 -0.29459 -0.29474 -0.39480 -0.38398 -0.37981 -0.37504 -0.37562 -0.37646 -0.37653 dimension 3, strati�ed sampling (bold if better than no strati�cation) -0.01931 -0.01396 -0.02585 -0.03590 -0.04430 -0.04836 -0.04744 -0.26548 -0.28079 -0.29481 -0.30133 -0.30797 -0.30761 -0.30763 -0.39714 -0.38346 -0.38021 -0.37749 -0.37411 -0.37614 -0.37442 dimension 5, no strati�ed sampling (bold for signif. best) 0.03285 0.04253 0.04896 0.04962 0.05125 0.05336 0.05412 -0.23188 -0.23207 -0.23265 -0.23080 -0.23219 -0.23148 -0.23042 Dimension 5, strati�ed sampling (bold if better than no strati�cation) 0.00197 -0.00880 -0.02657 -0.04158 -0.04991 -0.05404 -0.04617 -0.23294 -0.23146 -0.23161 -0.23150 -0.23228 -0.23158 -0.23198 Dimension 10, no strati�ed sampling (bold for signif. best) β=∞
β=1
α=0 α = 0.8 α=1 α=0 α = 0.8 α=1
β = 2.46
(paired) (' unpaired) 0.108 -0.105 0.012 -0.072 -0.056 -0.055 Dimension 10, strati�ed sampling (bold if better than no strati�cation) 0.047 -0.106 -0.033 -0.072 -0.057 -0.056
Table 5.3: Table of results (the lower, the better; see text for details) depending on (de�ning the problem) and
β
(de�ning the level of pairing;
β = 1
means full pairing,
α β
large means no pairing). We see that pairing can have a positive or a negative e�ect. We include results with strati�ed sampling; which are better or much better depending on the cases. Negligible standard deviations are not presented. Numbers in the strati�ed case are in bold when they outperform the non strati�ed setting.
Chapter 6 Convergence in non-quasi-convex problems In this chapter, we study the linear convergence of a simple pattern search method on non quasi-convex functions de�ned on continuous domains.
The assumptions
retained include an assumption on the sampling performed by the evolutionary algorithm (supposed to cover e�ciently the neighborhood of the current search point), the conditioning of the objective function (so that the probability of improvement is not too low at each time step, given a correct step size), and the unicity of the optimum.
6.1 Introduction Continuous evolutionary algorithms are well known for robust convergence. However, most proven results are for simple objective functions, e.g.
sphere functions [82].
Results also include compositions with monotone functions (so that not only convex functions are covered), but the considered objective functions are nonetheless still almost always quasi-convex (i.e. sublevel sets are convex), as well as most derivative free optimization algorithms [55], whereas nearly all testbeds are based on more di�cult functions [109, 110]. Extensions to non quasi-convex functions are still rare [111] and limited to convergence (i.e.: asymptotically we will �nd the optimum). We here extend such results to linear convergence (i.e. the precision after
O(exp(−Ω(n))).
n
iterations is
There are works devoted to unimodal objective functions, without
convexity assumptions [112], but such works are in the discrete domain and do not say anything for the linear convergence on continuous domains. All in all, only one of the six objective functions of Fig. 6.1 is covered by existing results, in terms of
97
98
CHAPTER 6.
CONVERGENCE IN NON-QUASI-CONVEX PROBLEMS
10
10
10
5
5
5
0
0
0
-5
-5
-5
-10 -10
-5
0
(a)
5
10
-10 -10
-5
0
(b)
5
10
-10 -10
10
10
10
5
5
5
0
0
0
-5
-5
-5
-10 -10
-5
0
(d)
5
10
-10 -10
-5
0
(e)
5
10
-10 -10
-5
-5
0
5
10
0
5
10
(c)
(f)
Figure 6.1: Six graphical representations of "easy" objective functions; only the �rst one (sphere) is covered by existing linear convergence results.
Even the sixth one
(ellipsoids) is not included in published linear convergence results. We extend to all functions verifying Eqs. 6.1-6.6 (see Section 6.2), including all functions presented here. We present assumptions under which our results hold in Section 6.2, the main result in Section 6.3, and we will show in details that the sixth case above (quadratic functions) is covered by the result in Section 6.3.3 (but case 1 is a special case of case 6, and cases 2, 3, 4, 5 can be tackled similarly). [111] provides other examples, with di�erent but very related assumptions; their examples are also covered by our theorem.
linear convergence. In this chapter, we prove linear convergence of a simple pattern search method with derandomized sampling on non quasi-convex families of functions. Section 6.2 presents the framework, and the assumptions under which our results hold.
Sec-
tion 6.3 is the mathematical analysis, under this set of assumptions. Section 6.3.3 presents the application to positive de�nite quadratic forms: it shows that the family of quadratic forms with conditioning bounded by some constant veri�es our set of assumptions, and therefore that our evolution strategy with derandomized sampling has linear convergence rate on such objective functions.
Incidentally, this section
emphasizes the critical underlying assumptions for proving the result, suggesting extensions to other families of �tness functions. Section 6.4 concludes and discusses limitations and further work.
6.2. A SIMPLE PATTERN SEARCH METHOD
99
6.2 A Simple Pattern Search Method We consider an evolutionary algorithm as in Alg. 13. As the sampling is derandomized, we might indeed call this algorithm a pattern search method. We assume the following framework.
6.2.1
The Objective Function
We assume that the function
f
has a unique minimum. Without loss of generality,
we assume that the objective function veri�es
f (0) = 0 and that this is the minimum.
The considered algorithms are invariant by translation or composition with monotone functions, so this does not reduce the generality of the analysis.
6.2.2
Conditioning
We assume that
K 0 ||x|| ≤ f (x) ≤ K 00 ||x|| for all
x
in
Rd
and for some constants
K0 > 0
and
K 00 > 0.
(6.1)
We point out that, as
we consider algorithms which are invariant under transformations of the objective function by composition with monotonic functions, this assumption is not so strong as a constraint and quadratic positive de�nite forms with bounded condition number are in fact covered (their square root veri�es Eq. 6.1).
6.2.3
Good Sampling
Here we use the derandomized sampling assumptions (Eqs. 6.2-6.6), which are crucial in our work. This sampling is deterministic, as in pattern search methods [55]. We
CHAPTER 6.
100
CONVERGENCE IN NON-QUASI-CONVEX PROBLEMS
Algorithm 13 The Simple Evolution Strategy. In case there is no unicity for choosing
x0 ,
any tie breaking solution is good. (c) refers to the counting operation, which
will be important in the proof.
[[1, k]]
stands for the integer set
d
x∈R ∗ ∗ ∗ d ∗ Parameters k ∈ N , δ 1 , . . . , δ k ∈ R , σ ∈ R+ , k1 ∈ N , k2 ∈ N for t = 1, 2, 3, . . . do Initialize
// just Xt ← x
mutations
// For
for archiving
i ∈ [[1, k]], xi ← x + σδ i
// useful auxiliary variables n ← number of xi such that f (xi ) < f (x) (c) 0 x ← xi with i ∈ [[1, k]] such that f (xi ) is minimum // if
step-size adaptation
n ≤ k1 then σ ← σ/2
end if if
n ≥ k2 then σ ← 2σ
end if
// if
win: accepted mutation
k1 < n < k2 x ← x0
end if end for
then
{1, . . . , k}.
6.3. MATHEMATICAL ANALYSIS assume that for some
σ
σ
σ
0 < b < b0 ≤ 2b0 ≤ c0 ≤ c, 0 < η < 1
too large:
small enough:
large enough:
σ
too small:
Perfect
6.2.4
101
σ:
and
∀x ∈ Rd ,
σ ≥ b−1 ||x|| ⇒ #{i ∈ [[1, k]]; f (x + σδ i ) < f (x)} ≤ k1
(6.2)
σ ≤ b0−1 ||x|| ⇒ #{i ∈ [[1, k]]; f (x + σδ i ) < f (x)} > k1
(6.3)
σ ≥ c0−1 ||x|| ⇒ #{i ∈ [[1, k]]; f (x + σδ i ) < f (x)} < k2
(6.4)
σ ≤ c−1 ||x|| ⇒ #{i ∈ [[1, k]]; f (x + σδ i ) < f (x)} ≥ k2
(6.5)
−1
−1
b0 ||x|| ≤ σ ≤ c0 ||x|| ⇒ ∃i ∈ [[1, k]]; f (x + σδ i ) ≤ ηf (x)
(6.6)
Discussion on Assumptions
Assumptions 6.2, 6.3, 6.4, 6.5, 6.6 basically assume that the sampling is regular enough for the shape of the level sets. For example, the �nite VC-dimension of ellipsoids ensure that, when the conditioning is bounded, quadratic functions verify the assumptions above (and therefore the theorem below) with arbitrarily high probability if
δ 1 ,. . . ,δ k
are randomly drawn and if
k
is large enough. Importantly, the critical
assumption in the derandomization is that all iterations have the same
δ1, . . . , δk .
This will be developed in Section 6.3.3. Assumptions 6.6 and 6.1 use the �tness values; but they just have to hold for one of the �tness values obtained by replacing
f
with
g◦f
with
g
a monotone function.
6.3 Mathematical Analysis 6.3.1
Main Theorem
Assume Eqs. 6.1-6.6. There exists a constant K , depending on η, K 0 , K 00 , maxi ||δ i || only such that for index t su�ciently large
ln(||X t ||)/t ≤ K < 0
(6.7)
102
CHAPTER 6.
CONVERGENCE IN NON-QUASI-CONVEX PROBLEMS
C B A B C
Figure 6.2: The linear convergence proof in a nutshell. X-axis: − ln(||x||). Y-axis: l = ln( ||x|| ). At each iteration, either case A holds: then the iteration is for sure σ an improvement by a factor at least η , or case B holds: the iteration can be an improvement or not; if not, the point is moved towards case A by downwards, or
case C holds: then
x
ln(2)
upwards or
is moved upwards (if it is at the bottom) or
downwards (if it is at the top). This ensures that after �nitely many time steps we go back to case A unless there is a �win� by case B in the mean time. The crucial point for the proof is that each �win� is an improvement by at least a controlled factor
η,
so that the slope of �win� arrows is bounded, so that there is linear convergence and not only an in�nite sequence of �small� improvements.
(with ln(0) = −∞) where the sequence of X t is de�ned as in Alg. 13. 6.3.2
Proof
First, we brie�y explain and illustrate the proof, before the formal proof below. The proof is sketched in Fig. 6.2. At each iteration t, we are at some point in the �gure; � � the ||x|| . x-axis is − ln(||x||) (equivalent to − ln(f (x)), by Eq. 6.1), the y-axis is l = ln σ The step-size adaptation ensures that if we are at the bottom (l upwards; if we are at the top (l
≥ ln(c)),
≤ ln(b)), we go l = ln(b) and
we go downwards. Between
l = ln(c),
everything can happen; but if there is no �win� case in the mean time, we 0 0 will arrive between l = ln(b ) and l = ln(c ), where a win is ensured. As steps are
l increases by ln(2) or [ln(b ), ln(c0 )]). This will be
fast, this can not take too much time (if there is no �win�, decreases by
ln(2)
in direction of the �forced win� range
0
6.3. MATHEMATICAL ANALYSIS 0 formalized below. c 0 to l > ln(c ) or from
103
≥ 2b0 ensures that the algorithm can not jump from l < ln(b0 ) l > ln(c0 ) to l < ln(b0 ). Therefore there is necessarily a �win� in
the mean time. Eq. 6.6 ensures that wins provide a signi�cant improvement. We now write the proof formally. Consider an iteration of the algorithm, with the number of mutations De�ne
l = ln
�
||x|| σ
�
i
•
ln(2)
#{i ∈ [[1, k]]; f (x + σδ i ) < f (x)} ≤ k1 #{i ∈ [[1, k]]; f (x + σδ i ) < f (x)} > k1 #{i ∈ [[1, k]]; f (x + σδ i ) < f (x)} < k2 #{i ∈ [[1, k]]; f (x + σδ i ) < f (x)} ≥ k2 ∃i ∈ [[1, k]]; f (x + σδ i ) ≤ ηf (x)
(6.8) (6.9) (6.10) (6.11) (6.12)
l ≤ ln(b),
then
n ≤ k1 ; σ
is divided by
2,
and
l
is increased
(Eq. 6.8). This is a case C in Fig. 6.2.
Forced decrease: decreased by
•
⇒ ⇒ ⇒ ⇒ ⇒
as in Alg. 13. We get the following behavior:
Forced increase: if by
•
x0
(as de�ned in Alg. 13, Eq. (c)).
. Eqs. 6.2-6.6 can be rephrased as follows:
l ≤ ln(b) l ≥ ln(b0 ) l ≤ ln(c0 ) l ≥ ln(c) 0 ln(b ) ≤ l ≤ ln(c0 ) De�ne
f (x + σδ i ) < f (x)
with
n
if
ln(2)
Forced win: if
l ≥ ln(c),
then
n ≥ k2 ; σ
is multiplied by
2,
and
l
is
(Eq. 6.11). This is a case C in Fig. 6.2.
ln(b0 ) ≤ l ≤ ln(c0 ),
then
x ← x0 ; this by maxi ||δ i ||)
l can be increased (at most ln(||x||/||x ||)). This is a case A in Fig. 6.2.
(Eq. 6.12);
is the �sure win� case or decreased (by
∆=
0
0 Importantly, these 3 cases do not cover all possible cases; ln(c ) < l < ln(c) and 0 ln(b) < l < ln(b ) are not covered in items above. These two remaining cases are termed case B in Fig. 6.2.
Step 1: Showing that there are in�nitely many wins.
l ≥ ln(c)) ensure that if l is too [ln(b0 ), ln(c0 )] (where a win necessarily occurs), unless there is a win in the mean time (in the range [ln(b), ln(c)] where wins are not sure but are possible). Importantly, l can increase or decrease 0 by ln(2) at most; so the algorithm can not jump from less than ln(b ) to more than ln(c0 ). This ensures that in�nitely often we have a win x ← x0 . But we want linear The two �rst lines above (case
l ≤ ln(b)
and case
low or too high, it eventually comes back to the range
convergence. Therefore we must consider how many steps there are before we come back to a �win�, and how large are improvements in case of �win�.
CHAPTER 6.
104
CONVERGENCE IN NON-QUASI-CONVEX PROBLEMS
Step 2: showing that �wins� are big enough. 0 In all cases of �win�, i.e. k1 < n < k2 , with ∆ = ln(||x||/||x ||), we know that 0 || 00 ||x f (x0 ) ≤ ηf (x) and f (x0 ) ≤ K 00 ||x0 || ≤ K f (x) so that ln(f (x)) is decreased by K 0 ||x|| at least max(ln(1/η), ln(K 0 /K 00 ) + ∆). (6.13) After a �win�, with
l0 = ln
�
||x0 || σ
�
,
•
l0 ≤ ln(b0 ), then the number of iterations before the next win is at most z = 1 + ln( cb )∆/ ln(2), because l0 ≥ ln(b) − ∆ ≥ ln(b0 ) − ln(b0 /b) − ∆ ≥ ln(b0 ) − ln(c/b) − ∆ and forced increase are by steps of at least ln(2).
•
l0 ≥ ln(c0 ), then the number of iterations before the next win is at most z = 1 + ln( cb ) maxi ln(||δ i ||)/ ln(2), because l0 ≤ ln(c) − maxi ln(δ i ) ≤ ln(c0 ) − ln(c0 /c) − maxi ln(δ i ) ≤ ln(c0 ) − ln(c/b) − maxi ln(δ i ) and forced decreases are by steps of at least ln(2).
•
less than in both cases above, otherwise.
if
if
In both cases, Eq. 6.13 divided by
z
is lower bounded by some positive constant
P rogressRate =
z max(ln(1/η), ln(K 0 /K 00 ) + ∆i ) = . min(1 + ln(c/b)∆i / ln(2), 1 + ln(c/b) maxj ln(||δ j ||)/ ln(2)) Eq. 6.13 divided by
(6.14)
Step 3: summing iterations. Eq. 6.14 is the progress rate between two wins, after normalization by the number of steps between these two wins. Hence if
t > n0 ,
ln(f (X t )) ≤ ln(f (X 1 )) − (t − n0 ) × X max(ln(1/η), ln(K 0 /K 00 ) + ∆i ) i where the summation is for
(6.15)
min(1 + ∆i / ln(2), 1 + maxj ln(||δ j ||)/ ln(2)) i
index of an iteration
number of initial iterations before a �win� (i.e. but it is �nite). Eq. 6.15 yields the expected result.
n0
t
with a �win�, and
n0
is the
depends on the initial conditions
6.3. MATHEMATICAL ANALYSIS
105
This result would be void if there was no algorithm and no space of functions for which assumptions 6.1-6.6 hold. Therefore, next Section is devoted to showing that for the important case of families of quadratic functions with bounded conditioning, assumptions 6.1-6.6 hold, and therefore the theorem above holds.
6.3.3
Application to Quadratic Functions
This section shows an example of application of the theorem above.
The main
strength of our results is that it covers many families of functions; yet, Eqs. 6.1-6.6 are not so readable. We show in this section that a simple family of �tness functions verify all the assumptions. We consider the application to positive de�nite quadratic forms with bounded conditioning, i.e.
we consider
objective functions
f
f ∈ F
with
F
the set of quadratic positive de�nite
such that
maxEigenV alue(Hessian(f )) < cmax < ∞. minEigenV alue(Hessian(f ))
(6.16)
Notably, thanks to the use of VC-dimension, the approach is indeed quite generic and can be applied to all families of functions obtained by rotation/translation from �tness functions in Fig. 6.1. Instead of working on
Q
x 7→ Q(x − p x∗ ) a quadratic form with Q Q(x − x∗ ), so that Eq. 6.1 work on x 7→
directly, with
positive de�nite with optimum in
0,
we
is veri�ed; as considered algorithms are invariants by composition with monotone functions, this does not change the result. We assume that
δ1, δ2, . . . , δk
are independently uniformly randomly drawn in
the unit ball B(0, 1). From now on, we note p = px,σ,f the probability that x + σδ i P −1 is in E = f ([0, f (x)[), and pˆ = pˆx,σ,f the frequency k1 ki=1 1x+σδi ∈E . We will often drop the indices for short. The assumptions in Section 6.2 essentially mean that frequencies are close to −1 expectations for x+σδ i ∈ f ([0, f (x)[) and x+σδ i ∈ f −1 ([0, ηf (x)[), independently of
x, σ , f .
This is typically a case in which VC-dimension [113] can help.
The purpose of this section is to show Eqs. 6.1-6.6, for a given family of functions, namely the family
F
de�ned above; by proving Eqs. 6.1-6.6, we show the following.
Corollary:
Assume that the δ i are uniformly randomly drawn in the unit ball B(0, 1). Assume that F is the set of quadratic functions with minimum in 0 (f (0) = 0) which verify
CHAPTER 6.
106
CONVERGENCE IN NON-QUASI-CONVEX PROBLEMS
Eq. 6.16 for some cmax < ∞. Then, almost surely on the sequence δ 1 , δ 2 , . . . , δ k , for k large enough and some parameters k1 and k2 of Alg. 13, then Eqs. 6.1-6.6 hold, and therefore for some K < 0, for all t > 0,
ln(||X t ||)/t ≤ K
(6.17)
with ln(0) = −∞ and where the sequence of X t is de�ned as in Alg. 13. Proof of the corollary We use the main theorem above for proving Eq. 6.17, so we just have to prove that Eqs. 6.1-6.6 hold.
Step 1: using VC-dimension for approximating expectations by frequencies. Thanks to the �niteness of the VC-dimension of quadratic forms (see e.g. [72]), we
� > 0, almost surely in δ 1 , δ 2 , . . . , δ k , for all δ > 0 and k probability at least 1 − δ ,
know that for all large, with
su�ciently
sup |ˆ px,σ,f − px,σ,f | ≤ �/2
(6.18)
x,f,σ>0 where
x
ranges over the domain,
f
ranges over
F.
For short, we will often drop the indices, so that Eq. 6.18 becomes Eq. 6.19:
sup |ˆ p − p| ≤ �/2
(6.19)
x,f,σ>0 The important point here is that this result is a uniform result (uniform on
f ∈ F );
this is not just a simple law of large numbers, it is a uniform law of large
numbers, so that it is not a mistake if there is a supremum on
x, σ, f .
Almost surely,
the supremum is bounded; it is not only bounded almost surely for each
x, σ, f
separately, and this is the key concept in this proof.
Step 2: showing that
σ
small leads to high acceptance rate and
σ
high
leads to small acceptance rate. Thanks to the bounded conditioning (Eq. 6.16), there exists
1 s0 < s 2
�>0
s.t.
(6.20)
6.3. MATHEMATICAL ANALYSIS
� with
s0 → 0
and
�
0
s = inf
and
because
s = sup
s→∞
as
107
σ ; σ, x, f ||x||
σ ; σ, x, f ||x||
s.t.
s.t.
p≥
� 2
�
1 � p< − 2 2
�
� → 0.
Eq. 6.18 implies
1 1 sˆ ≥ s 2 2
(6.21)
s0 ≥ sˆ0
(6.22)
and
� with
and
sˆ = sup �
0
sˆ = inf
σ ; σ, x, f ||x||
σ ; σ, x, f ||x||
So, Eqs. 6.21, 6.22 and 6.19, with
k
s.t.
s.t.
� pˆ ≥ �
� 1 pˆ < − � 2
large enough, imply
1 sˆ > sˆ0 2 Eq. 6.23 provide
k1 , k2 , c0
and
b0
as follows for Eqs. 6.4 and 6.3:
1 = sˆ , b0 k1 = b�kc with
�
k1 /k , ||x|| � � σ = inf ; σ, x, f s.t. pˆ < k2 /k , ||x||
CHAPTER 6.
108
CONVERGENCE IN NON-QUASI-CONVEX PROBLEMS
1 which provide Eqs. 6.5 and 6.2 with b < c thanks to � < (� was chosen with 10 1 0 0 � < 10 in step 1). Eqs. 6.2-6.5 then imply b < b and c < c. We now have to ensure Eq. 6.6. Equations Eq. 6.1-6.5 are proven above for k su�ciently large; from now on, we note q = qx,σ,f the probability that x + σδ i is P 0 −1 in E = f ([0, ηf (x)[), and qˆ = qˆx,σ,f the frequency k1 ki=1 1x+σδi ∈E 0 . For showing Eq. 6.6, let us assume σ −1 −1
b
≤c ; ||x|| > 0; so for k ≤
q > �0 for some �0 su�ciently large for ensuring supσ,x,f |qx,σ,f − qˆx,σ,f | ≤ �0 /2, by VC-dimension, we get q 0 ≥ �0 /2 > 0, which implies 0 that at least one δ i veri�es x + δ i ∈ E . This is exactly Eq. 6.6.
this implies
Step 4: concluding. We have shown Eqs. 6.1-6.6 for square roots of positive de�nite quadratic normal forms with bounded conditioning. Therefore, the main theorem can be applied and leads to Eq. 6.17.
6.4 Discussion and Conclusion This work provides, to the best of our knowledge, the �rst proof of linear convergence of evolutionary algorithms (here, the Simple Evolution Strategy in Alg. 13) in continuous domains on non quasi-convex functions. Indeed, even the application to quadratic positive de�nite forms is new. This proof is for derandomized samplings only, which means that the mutations
δ i , before multiplication by the step-size which
obviously varies, are constant. A main missing point for an application is the evaluation of the convergence rate as a function of condition numbers (see extensions below) and the extension to randomized algorithms preferred by many practitioners. In Section 6.4.1 we discuss extensions of this work that we plane to develop in the near future, and in Section 6.4.2 deeper (harder to get rid of ) limitations.
6.4.1
Extensions
Two properties are used for applying our main theorem to quadratic functions with a bound on condition numbers:
•
VC-dimension of level sets. VC-dimension is a classical easy tool for showing that a family of functions verify a property such as Eq. 6.19 for arbitrarily small
� > 0,
provided that
k
is large enough.
6.4. DISCUSSION AND CONCLUSION
•
109
Eq. 6.20, also crucial in the proof, is directly a consequence of bounded conditioning (assumption formalized in Eq. 6.16).
With these two assumptions, we can show Eqs. 6.1-6.6, and then the theorem can be applied. This is enough for objective functions with level sets having simple graphical representations with rotations/translations. However, we do not need assumptions so strong as �nite VC-dimension for showing Eqs. 6.1-6.6. Glivenko-Cantelli results are enough; and for this, �niteness of the bracketing covering numbers, for example, is enough [79]; this is the most natural extension of this work. In particular, there are results showing the �niteness of bracketing covering numbers for families of Hölder spaces of functions; this is a nice path for applying results from our work to wide families of functions. Assumptions in [114] are slightly di�erent from the assumptions in this chapter; their main assumption are
•
the frontier of any level set
•
for some
Cmin ∈ R
has a bounded curvature.
Cmax ∈ R, with x∗ f and f (x∗ ) = 0, for
and
the objective function
f −1 (r)
the (assumed unique) optimum of any
r ∈ R,
we have
B(x∗ , Cmin r) ⊂ f −1 (r) ⊂ B(x∗ , Cmax r). The second assumption is equivalent to our conditioning assumption, but the �rst one is not directly equivalent to our derandomized sampling assumptions. Re�ning the assumptions might be possible by combining their assumptions and our assumptions. Condition numbers are classical for estimating the di�culty of local convergence; a nice condition number for di�cult optimization should generalize some classical condition number from the literature, and include non-di�erentiable functions as well. [111] did a �rst step in that direction; in particular, isotropic algorithms do not solve functions with in�nite condition number (for the de�nition of [111]), whereas covariance-based algorithms [58, 115] do. Eq. 6.7 we guess that it is possible to derive a new such number with direct links to convergence rates of evolution strategies.
6.4.2
Limitations
In this chapter, we work on an evolutionary algorithm for which mutations are randomly drawn once and for all (the same mutation vectors iterations of the algorithms).
This makes the proof much easier.
δ1, . . . , δk
δ i 's
for all
We believe that
the proof can be extended to the case in which the mutations are randomly drawn at each iteration, as in most usual cases; yet, the adaptation is not straightforward;
CHAPTER 6.
110
CONVERGENCE IN NON-QUASI-CONVEX PROBLEMS
we must study the frequency (over iterations) at which assumptions 6.2-6.6 hold, and the consequences of bad cases on Eq. 6.15. For this work, we just assume that the
δ i 's
are randomly drawn once and for all iterations; equivalently, they could be
quasi-randomized. Cumulative adaptation [116] is not considered in our analysis; this is a considerably harder step for generalizing our results, because then the simple separation between 5 cases (see Fig. 6.2) is the idea that clearly divides the proof between step-size adaptation and progress rate. This work covers quadratic functions, but the rates are not independent of the conditioning, so complementary results are necessary for algorithms evolving a covariance matrix, such as [58, 117, 115]. Maybe ergodic Markov chains are a better tool for showing such results [82]. We work under assumptions which imply a very large
k.
More precisely, using
VC-dimension or bracketing numbers, it is possible to get explicit bounds on these numbers will be far above the usual values for values of
k
k.
k,
but
Obtaining results for limited
is a classical challenge in machine learning, and for the moment only
huge values of
k
are applicable when using VC-dimension assumptions. Seemingly,
weaker assumptions are enough, such as Glivenko-Cantelli properties [79]. For our work, VC-dimension is easier to use and su�cient for our purpose.
Part IV General Conclusion
111
Chapter 7 Conclusion In this thesis, we aimed at creating new decision aids tools for energy management. We focused on Unit Commitment problems which are important problems with huge political, economical, environmental and sociological repercussions. Our initial motivation was to help electricity managers to face the new challenges described in section 1.2, that is to say, �nd better exploitation and investment strategies, with larger, more detailed and more realistic models, using multiple scenarios. Our contribution to making solvable large scale Unit Commitment problems with realistic models can be summarized as follows.
7.1 A general trend in arti�cial intelligence: reducing the model error In our opinion, strong assumptions on the model is one of the biggest weakness of
valuebased methods assume that the random processes involved can be reduced to a small Markovian Random Process and Stochastic Dual Dynamic Programming assumes most classical decision aids tools for energy management. For instance, most
that the value function is convex.
Thus, a simpli�ed model of the system to be
solved is often used in order to �t these assumptions. But as explained in section 1.5, a good solution for a simpli�ed model can be a rather bad solution for the actual one. For instance, [29] points out that a computer-aided decision can provide good results on a simpli�ed model (the one used as objective function in the computeraided decision process), but be detrimental on a more realistic one. We do not deny that mathematical programming methods are essential to deal with large action spaces. Indeed, relying purely on Reinforcement Learning methods
113
CHAPTER 7.
114
CONCLUSION
cannot work when the action space is of a large dimension, e.g. more than 10000 action variables and constraints. Such a setting is usual in Unit Commitment problems and therefore mathematical programming is widely used. But this often implies substantial simpli�cations within the model. Using a method like Stochastic Dual Dynamic Programming is possibly more adequate. However, this implies simplifying the model too. Thus we aimed at exploring a di�erent approach, inspired by the Reinforcement Learning community, and tried to understand how Direct Policy Search � which has very few modelling constraints � could be applied to power systems. This means that we are mostly interested in two questions:
•
Finding parametric policies, so that they can be applied on large scale power systems. For this, we �nd inspiration in classical Stochastic Dynamic Programming representations, i.e.
splitting the objective function into instantaneous
cost and long-term reward.
•
Studying optimization algorithms compliant with Direct Policy Search. Evolution strategies are a classical choice for Direct Policy Search, thus we studied:
� their runtime in noisy settings; � their improvement by pairing methods; � their convergence proof in non-quasi-convex settings. Also, from a methodological point of view, we believe that methods should be tested on the best available model, not on the approximation used inside the optimizer.
7.2 Summary of Contributions We pointed out the di�erent forms of errors, which explain suboptimal choices in power systems simulation and optimization. We advocated the use of tools with a stronger focus on model errors, rather than optimization error.
Direct Value Search.
The �rst part of our work (chapter 4) deals with the mul-
tistage aspect of power systems.
Direct Value Search (DVS), a tool and from Direct Policy Search. DVS
We proposed
combining ideas from Bellman decomposition combines:
•
a polynomial time decision making, compliant with high-dimensional constrained action spaces;
7.3. DIRECT VALUE SEARCH BENEFITS
•
115
a simulation-based objective function, compliant with non-Markovian random processes and arbitrary models;
•
an iterative global optimization procedure, providing an anytime approach.
This tool is convenient, anytime, stable, much more model-free than value-based methods and compliant with non-Markovian random processes.
Noisy optimization.
The methodology above, DVS, as well as many DPS meth-
ods, involves a noisy black-box non-linear optimization component. In chapter 5, we contributed to the state of the art in non-linear optimization, in two directions:
•
we proved rates for noisy optimization under some locality assumption.
•
we improved empirical convergence rates with variance reduction techniques.
Convergence in non-quasi-convex problems.
Finally, in chapter 6, we have
provided � to the best of our knowledge � the �rst proof of linear convergence of evolutionary algorithms (a simple Evolution Strategy) in continuous domains on non quasi-convex objective functions.
7.3 Direct Value Search Bene�ts In chapter 4, we presented Direct Value Search (DVS), a merge of Stochastic Dynamic Programming (SDP) and Direct Policy Search (DPS). It has many strengths:
•
with DVS, forecasts naturally included in optimization;
•
DVS can encode non-linear policies, indirectly, without losing the polynomial time DMR, as long as the decision making can be encoded as a linear problem. The model can be arbitrarily complex and can include small time scale e�ects without increasing the state space, whereas SDP-based methods have a precision loss when the number of time steps increases.
•
DVS allows detailed simulations (e.g. with very small time scale, for volatility);
•
DPS does not need convex Bellman values (whereas SDDP does).
Stock-
dependent e�ciencies in pumped-storage systems is not a problem.
•
DVS is an anytime algorithm (it can be stopped anytime, users immediately get a usable approximate solution);
CHAPTER 7.
116
•
CONCLUSION
ADP, SDP and SDDP need Markovian random processes, which is not an issue for DVS. DVS can be applied on a problem where random processes are continuous and not Markovian. This is relevant for climate data.
•
DVS can highly and rather easily be parallelized;
•
Stopping criteria can be de�ned for SDDP [48, 41] or more generally SDP methods.
These stopping criteria are, by nature, asymptotic, as well as stopping
criteria of noisy optimization algorithms involved in our DVS method.
•
DVS can handle large state spaces (as DPS);
•
DVS can handle large action spaces (as SDP);
Thus, Direct Value Search can work on the �real� problem, without �simpli�cation�. To the best of our knowledges, there are no equivalent algorithm capable of solving large problems with such realistic models for an acceptable solving time.
7.4 Further work Here we would like to mention several directions of future research which look the most promising.
Some of these ideas were already discussed in the corresponding
chapters and sessions. The further work includes:
Mathematical analysis of DVS.
DVS has many advantages in practice.
We
started a work around the formalization of its advantages, in particular in case of non-Markovian random processes. Assuming that
Πθ
is a su�ciently good approxi-
mator, we show that DVS can encode optimal policies, though the decision making is polynomial. Interestingly, we do not need the transition function used in the policy (Eq. 4.8) to be the same as the real transition - provided that the
simulations
are
performed with the real transition.
More intensive testing of DVS.
We tested Direct Value Search on a rather
simple problem, for which the approach has given satisfactory results. lem we have used in our baseline is not that much a toy problem:
The prob-
we applied a
random generator without discretization, which is a challenge for many algorithms. Direct Value Search is, by design, less sensitive to dimension than classical methodologies and does not need any convexity assumption. Therefore our method should be tested on very high scale problems (hundreds of stocks and thousands of time
7.4. FURTHER WORK
117
steps), showing its ability to handle non-Markovian random processes, non-convex Bellman values, high-scale state space. Among the other directions to explore, we are working on theoretical proofs for Direct Value Search.
Optimization at the level of investments.
The investment problem have been
described in section 1.3.3. It attempts to answer the following question: when, where and how much should we invest on new capacities (plants, transmission lines, . . . ) in order to optimize pro�ts, keep the system in a reasonable condition and adapt it to the future changes of its environment on the long run ? Long term investment studies are extremely important. They are involving investments in hundreds of billions of euros and they have to be made with huge non-stochastic uncertainties. Optimization at the level of investments is a challenging problem we have not considered so far, but it recently became one of our main goal.
Non-stochastic uncertainties.
Such an extension in our algorithms is crucial
for a better handling of the investment problem, discussed before and described in 1.3.3. Among relevant non-stochastic uncertainties, there are long-term technological breakthroughs and political and geopolitical uncertainties. our work is critical for one of our current works, the POST and long term
3
1
This extensions of
2
project, a high scale
investment optimization platform with huge (non-stochastic) uncer-
tainties about the future (technologies, subsidies, laws, . . . ).
1 Plateforme
d'Optimisation des Supergrids Transcontinentaux http://www.presse.ademe.fr/ 2013/06/les-reseaux-electriques-intelligents-innovent.html
2 Transcontinental 3 horizon
scale, e.g. Europe and North Africa. 2030 to 2050.
118
CHAPTER 7.
CONCLUSION
Bibliography [1] France. Ministère de l'économie, des �nances et de l'industrie and Fontaine,
Livre blanc sur les énergies.
N.,
Ministère de l'économie, des �nances et
de l'industrie, 2003. [Online]. Available:
http://books.google.fr/books?id=
dWwEHQAACAAJ [2] E. Assoumou, �Modélisation markal pour la plani�cation énergétique long terme dans le contexte français,� Ph.D. dissertation, 2006. [Online]. Available: http://pastel.archives-ouvertes.fr/pastel-00002752 [3] Organisation for Economic Co-operation and Development (OECD), �Oecd factbook 2014.� [Online]. Available: http://www.oecd-ilibrary.org/economics/ oecd-factbook-2014_factbook-2014-en [4] International Energy Agency (IEA), �World energy outlook 2012.� [Online]. Available:
http://www.oecd-ilibrary.org/energy/world-energy-outlook-2012_
weo-2012-en [5] J.
Conca,
ergy
�How
sources,�
deadly
is
your
kilowatt?
we
rank
the
killer
en-
http://www.forbes.com/sites/jamesconca/2012/06/10/
energys-deathprint-a-price-always-paid/, 2012, accessed: 2010-09-03. [6] J. Hansen, P. Kharecha, M. Sato, V. Masson-Delmotte, F. Ackerman, D. J. Beerling, P. J. Hearty, O. Hoegh-Guldberg, S.-L. Hsu, C. Parmesan
et al.,
�Assessing "dangerous climate change": required reduction of carbon emissions to protect young people, future generations and nature,�
PloS one,
vol. 8,
no. 12, 2013. [Online]. Available: http://pubs.giss.nasa.gov/abs/ha08510t.html [7] B.
D.
opinion
Henri on
Wallard energy
and
P.
Cornick,
policy,�
119
fukushima:
Global
http://www.ipsos.com/public-a�airs/
after-fukushima-global-opinion-energy-policy/, 03.
�After 2012,
accessed:
2010-09-
BIBLIOGRAPHY
120
[8] M. Cooper and D. Sussman, �Nuclear power loses support in new poll,� http: //www.nytimes.com/2011/03/23/us/23poll.html, 2011, accessed: 2010-09-03. [9] A.
et
McCrone
ergy
investment
al.,
�Global
2013,�
trends
in
renewable
en-
http://fs-unep-centre.org/publications/
global-trends-renewable-energy-investment-2013, 2013, accessed: 2010-09-03. [10] A. Zervos
et al.,
�Renewables 2014 global status report,� http://www.ren21.
net/REN21Activities/GlobalStatusReport.aspx, 2014, accessed: 2010-09-03. [11] A. Wood, B. Wollenberg, and G. Sheblé,
Control.
Power Generation, Operation and
Wiley, 2013. [Online]. Available: http://books.google.fr/books?id=
Iev9AAAAQBAJ [12] S. Kazarlis, A. Bakirtzis, and V. Petridis, �A genetic algorithm solution to the unit commitment problem,�
Power Systems, IEEE Transactions on,
vol. 11,
no. 1, pp. 83�92, Feb 1996. [13] N. Padhy, �Unit commitment-a bibliographical survey,�
Transactions on,
Power Systems, IEEE
vol. 19, no. 2, pp. 1196�1205, May 2004.
[14] G. Sheble and G. Fahd, �Unit commitment literature synopsis,�
IEEE Transactions on,
Power Systems,
vol. 9, no. 1, pp. 128�135, Feb 1994.
[15] D. Siface, M. Vespucci, and A. Gelmini, � Solution of the mixed integer large scale unit commitment problem by means of a continuous stochastic linear programming model,�
Energy Systems,
vol. 5, no. 2, pp. 269�284, 2014.
[Online]. Available: http://dx.doi.org/10.1007/s12667-013-0107-z [16] A. Wood and B. Wollenberg,
Power generation, operation, and control.
Wiley,
1984. [Online]. Available: http://books.google.fr/books?id=dwRtAAAAIAAJ [17] RTE,
�Developpement
durable,�
http://www.
rte-france.com/fr/developpement-durable/les-enjeux-1/ les-metiers-de-rte-et-les-enjeux-de-developpement-durable/ les-metiers-les-enjeux, 2011, accessed: 2010-09-09. [18] I. T. Sidonie Blanchard, �Les réseaux de transport et distribution d'électricité,� http://www.developpement-durable.gouv.fr/IMG/pdf/16_-_Les_reseaux_ de_transport_et_de_distribution_electricite.pdf , 2013, accessed: 09.
2010-09-
BIBLIOGRAPHY
121
[19] B. Wright, �A review of unit commitment,� 2013. [20] P. Pinson, �Renewable energy forecasts ought to be probabilistic,� 2013, wIPFOR seminar, EDF. [21] P. Bornard, �Conduite d'un système de production-transport,�
l'ingénieur Réseaux électriques de transport et de répartition, [Online]. Available:
Techniques de
no. D4080, 2000.
http://www.techniques-ingenieur.fr/base-documentaire/
energies-th4/reseaux-electriques-de-transport-et-de-repartition-42263210/ conduite-d-un-systeme-de-production-transport-d4080/ [22] International Energy Agency (IEA), �Variability of wind power and other renewables. management options and strategies,� 2005. [23] D. Bertsimas, E. Litvinov, X. A. Sun, J. Zhao, and T. Zheng, �Adaptive robust optimization for the security constrained unit commitment problem,�
Systems, IEEE Transactions on,
Power
vol. 28, no. 1, pp. 52�63, 2013.
[24] C. Autorita per l'Energia Elettrica e il Gas, �Report on the events of september 28th, 2003 culminating in the separation of the italian power system from the other UCTE networks,� www.autorita.energia.it/docs/04/061-04all.pdf , 2004, accessed: 2010-09-09.
Approximate Dynamic Programming: Solving the Curses of Dimensionality (Wiley Series in Probability and Statistics). Wiley-Interscience,
[25] W. B. Powell, 2007. [26] D. Bertsekas,
Dynamic Programming and Optimal Control, vols I and II.
Athena Scienti�c, 1995. [27] R. Sutton and A. Barto,
Reinforcement learning: An introduction.
Cambridge,
MA: MIT Press., 1998. L. Puterman, Markov Decision Processes: Discrete Stochastic Dynamic Programming. Wiley-Interscience, April 1994. [Online]. Avail-
[28] M.
able:
http://www.amazon.ca/exec/obidos/redirect?tag=citeulike09-20&
path=ASIN/0471619779 [29] A. Dallagi and T. Simovic, �Optimisation des actifs hydrauliques d'edf : besoins métiers, méthodes actuelles et perspectives,� 2012, pGMO.
BIBLIOGRAPHY
122
[30] A. Couetoux, �Monte carlo tree search for continuous and stochastic sequential decision
making
problems,�
Ph.D.
dissertation,
2013,
thèse
de
doctorat
dirigée par Teytaud, Olivier Informatique Paris 11 2013. [Online]. Available: http://www.theses.fr/2013PA112192 [31] R. E. Bellman,
Dynamic Programming.
Princeton, New Jersey, USA: Prince-
ton University Press, 1957. [32] R.
Dynamic Programming and Markov Processes.
Howard,
Cambridge,
Massachusetts: MIT Press, 1960. [Online]. Available: http://books.google.fr/ books?id=fXJEAAAAIAAJ [33] J. Nunen,
Contracting Markov Decision Processes.
Amsterdam : Mathema-
tisch Centrum, 1976. [Online]. Available: http://repository.tue.nl/29937 [34] M. L. Puterman and M. C. Shin, � Modi�ed policy iteration algorithms for discounted Markov decision problems,�
Management Science,
vol. 24, no. 11,
pp. 1127�1137, 1978. [35] �Tight performance bounds on greedy policies based on imperfect value functions,� Northeastern University, Tech. Rep. NU�CCS-93-14, Nov 1993. [Online]. Available: http://leemon.com/papers/1993wb2.pdf [36] Y. Bengio, criterion,�
�Using a �nancial training criterion rather than a prediction CIRANO,
CIRANO
Working
Papers
98s-21,
1998.
[Online].
Available: http://ideas.repec.org/p/cir/cirwor/98s-21.html [37] H. Heitsch and W. Römisch, �Scenario tree reduction for multistage stochastic programs,�
Computational Management Science,
2009. [Online]. Available:
vol. 6, no. 2, pp. 117�133,
http://EconPapers.repec.org/RePEc:spr:comgts:v:
6:y:2009:i:2:p:117-133 [38] W.-B. Powell,
Approximate Dynamic Programming.
Wiley, 2007.
[39] C. Cortes and V. Vapnik, � Support-vector networks,� vol. 20, no. 3, p. 273�297, 1995. [Online]. Available:
Machine Learning,
http://dx.doi.org/10.
1007/BF00994018 [40] D. P. Bertsekas, �Dynamic programming and suboptimal control: from ADP to MPC,�
Eur. J. Control,
A survey
vol. 11, no. 4-5, pp. 310�334, 2005.
BIBLIOGRAPHY
123
[41] M. V. F. Pereira and L. M. V. G. Pinto, �Multi-stage stochastic optimization
Math. Program.,
applied to energy planning,�
vol. 52, no. 2, pp. 359�375, Oct.
1991. [Online]. Available: http://dx.doi.org/10.1007/BF01582895 [42] A. Ruszczynski.
North-Holland Publishing Company, Amsterdam, 2003,
vol. 10, ch. Decomposition methods. [43] A. Shapiro, �Analysis of stochastic dual dynamic programming method,�
ropean Journal of Operational Research,
Eu-
vol. 209, no. 1, pp. 63�72, 2011.
[44] K. Astrom, � Optimal control of Markov decision processes with incomplete state estimation,�
Journal of Mathematical Analysis and Applications,
vol. 10,
pp. 174�205, 1965. [45] D. Bertsekas and J. Tsitsiklis,
Neuro-dynamic Programming.
Athena Scienti�c,
1996. [46] V. Heidrich-Meisner and C. Igel, �Hoe�ding and bernstein races for selecting
ICML '09: Proceedings of the 26th Annual International Conference on Machine Learning. New York, NY, policies in evolutionary direct policy search,� in USA: ACM, 2009, pp. 401�408. [47] Z. L. Chen and W. B. Powell, � Convergent cutting-plane and partial-sampling algorithm for multistage stochastic linear programs with recourse,�
Theory Appl.,
J. Optim.
vol. 102, no. 3, pp. 497�524, 1999.
[48] C. J. Donohue and J. R. Birge, �The abridged nested decomposition method for multistage stochastic linear programs with relatively complete recourse,�
Algorithmic Operations Research,
vol. 1, no. 1, 2006.
[49] K. Linowsky and A. B. Philpott, �On the convergence of sampling-based decomposition algorithms for multistage stochastic programs,�
Appl., [50] A.
J. Optim. Theory
vol. 125, no. 2, pp. 349�366, 2005.
Philpott
and
Z.
Guan,
�On
the
convergence
of
stochastic
dual
dynamic programming and related methods,�
Operations Research Letters,
vol.
[Online].
36,
no.
4,
pp.
450
�
455,
2008.
Available:
http:
//www.sciencedirect.com/science/article/pii/S0167637708000308 [51] V. Fabian, �Stochastic approximation of minima with improved asymptotic speed,�
Ann. Math. Statist.,
vol. 38, no. 1, pp. 191�200, 1967.
BIBLIOGRAPHY
124
[52] H.-G. Beyer,
The Theory of Evolutions Strategies.
Heidelberg: Springer, 2001.
[53] S. Astete-Morales, J. Liu, and O. Teytaud, �log-log convergence for noisy optimization,� in
Proceedings of EA 2013, ser. LLNCS.
Springer, 2013, p. accepted.
[54] N. Hansen, S. D. Müller, and P. Koumoutsakos, �Reducing the time complexity of the derandomized evolution strategy with covariance matrix adaptation (cma-es),�
Evolutionary Computation,
vol. 11, no. 1, pp. 1�18, 2003.
[55] A. Conn, K. Scheinberg, and L. Toint, �Recent progress in unconstrained nonlinear
optimization
without
derivatives,�
1997.
[Online].
Available:
citeseer.ist.psu.edu/conn97recent.html [56] B. Doerr and C. Winzen, �Towards a complexity theory of randomized search heuristics: Ranking-based black-box complexity,� in
CSR,
ser. Lecture Notes
in Computer Science, A. S. Kulikov and N. K. Vereshchagin, Eds., vol. 6651. Springer, 2011, pp. 15�28. [57] S.
Grünewälder,
� Regret
Bounds
J.-Y. for
Audibert,
Gaussian
M.
Process
Workshop and Conference Proceedings : Laguna
Resort,
Sardinia,
Italie,
2010,
Opper, Bandit
and
J.
AISTATS 2010, pp.
Shawe-Taylor,
Problems,�
273�280.
JMLR
in
vol.
[Online].
9,
Chia
Available:
http://hal-enpc.archives-ouvertes.fr/hal-00654517 [58] H.-P. Schwefel,
Numerical Optimization of Computer Models.
Wiley & Sons, 1981, 1995 � 2
nd
New-York: John
edition.
[59] H.-G. Beyer, �Mutate large, but inherit small ! On the analysis of mutations in
(1, λ)-ES
with noisy �tness data,� 1998, pp. 109�118.
[60] J. Fitzpatrick and J. Grefenstette, �Genetic algorithms in noisy environments, in machine learning: Special issue on genetic algorithms, p. langley, ed. dordrecht: Kluwer academic publishers, vol. 3, pp. 101 120,� 1988. [61] D. V. Arnold and H.-G. Beyer, �Local performance of the (1+1)-ES in a noisy environment,�
IEEE Transactions on Evolutionary Computation,
vol. 6, no. 1,
pp. 30�41, 2002. [62] D. V. Arnold and H. georg Beyer, �Evolution strategies with cumulative step length adaptation on the noisy parabolic ridge,� Tech. Rep., 2006.
BIBLIOGRAPHY
125
[63] U. Hammel and T. Bäck, �Evolution strategies on noisy functions: improve convergence properties,� in
How to
Parallel Problem Solving From Nature, ser.
LNCS, Y. Davidor, H.-P. Schwefel, and R. Männer, Eds., vol. 866.
Jerusalem:
springer, 9�14Oct. 1994, pp. 159�168. [64] J. M. Fitzpatrick and J. J. Grefenstette, �Genetic algorithms in noisy environments,�
Machine Learning,
vol. 3, pp. 101�120, 1988.
[65] M. Jebalia and A. Auger, � On multiplicative noise models for stochastic search,� in
Parallel Problem Solving From Nature,
dortmund Allemagne, 2008.
[Online]. Available: http://hal.inria.fr/inria-00287725/en/ [66] O. Teytaud and A. Auger, � On the adaptation of the noise level for stochastic optimization,� in
IEEE Congress on Evolutionary Computation,
Singapour,
2007. [Online]. Available: http://hal.inria.fr/inria-00173224/en/ [67] R. Coulom, �Clop: Con�dent local optimization for noisy black-box parameter tuning,� in
ACG, ser. Lecture Notes in Computer Science,
and A. Plaat, Eds., vol. 7168.
H. J. van den Herik
Springer, 2011, pp. 146�157.
[68] R. Coulom, P. Rolet, N. Sokolovska, and O. Teytaud, �Handling expensive optimization with large noise,� in Eds.
FOGA,
H.-G. Beyer and W. B. Langdon,
ACM, 2011, pp. 61�68.
[69] P. Rolet and O. Teytaud, �Bandit-based estimation of distribution algorithms for noisy optimization:
Rigorous runtime analysis,� in
(accepted); presented in TRSH 2009 in Birmingham, [70] ��, � Adaptive Noisy Optimization,� in
Proceedings of Lion4
2009.
EvoStar 2010,
Istambul, Turquie,
Feb. 2010. [Online]. Available: http://hal.inria.fr/inria-00459017 [71] V. Heidrich-Meisner and C. Igel, �Uncertainty handling cma-es for reinforcement learning,� in
GECCO,
F. Rothlauf, Ed.
[72] L. Devroye, L. Györ�, and G. Lugosi,
nition.
ACM, 2009, pp. 1211�1218.
A probabilistic Theory of Pattern Recog-
Springer, 1997.
[73] R. Coulom, P. Rolet, N. Sokolovska, and O. Teytaud, �Handling expensive optimization with large noise,� in Eds.
ACM, 2011, pp. 61�68.
FOGA,
H.-G. Beyer and W. B. Langdon,
BIBLIOGRAPHY
126
[74] D. R. Jones, M. Schonlau, and W. J. Welch, �E�cient global optimization of expensive black-box functions,�
J. of Global Optimization,
vol. 13, no. 4, pp.
455�492, 1998. [75] J. Villemonteix, E. Vazquez, and E. Walter, � An informational approach to the global optimization of expensive-to-evaluate functions,�
Optimization,
Journal of Global
p. 26 pages, 09 2008. [Online]. Available: dx.doi.org/10.1007/
s10898-008-9354-2http://hal-supelec.archives-ouvertes.fr/hal-00354262/en/ [76] L. Bienaymé, �Considérations à l'appui de la découverte de laplace,�
Rendus de l'Académie des Sciences,
Comptes
vol. 37, pp. 309�324, 1853.
[77] P. Chebyshev, �Sur les valeurs limites des integrales,�
Math Pure Appl,
vol. 19,
pp. 157�160, 1874. [78] A. Markov, �On certain applications of algebraic continued fractions,� Ph.D. dissertation, St Petersburg, 2002. [79] A. V. D. Vaart and J. Wellner,
Weak Convergence and Empirical Processes.
Springer series in statistics, 1996. [80] O. Teytaud and S. Gelly, �General lower bounds for evolutionary algorithms,� in th
10 International Conference on Parallel Problem Solving from Nature (PPSN 2006), 2006.
[81] H. Fournier and O. Teytaud, �Lower bounds for comparison based evolution strategies using vc-dimension and sign patterns,�
Algorithmica,
vol. 59, no. 3,
pp. 387�408, 2011. [82] A. Auger,
�Convergence results for (1,λ)-SA-ES using the theory of
irreducible Markov chains,�
Theoretical Computer Science,
ϕ-
vol. 334, no. 1-3,
pp. 35�69, 2005. [83] A. Auger, M. Schoenauer, and O. Teytaud, �Local and global order 3/2 convergence of a surrogate evolutionnary algorithm,� in
Gecco,
2005, p. 8 p.
[84] D. V. Arnold and H.-G. Beyer, �E�ciency and mutation strength adaptation of the (mu/mui,lambda)-es in a noisy environment,� in
from Nature, ser. LNCS, M. S. et al., Ed., vol. 1917. [85] H.-G. Beyer, ries.
The Theory of Evolution Strategies,
Springer, Heideberg, 2001.
Parallel Problem Solving springer, 2000, pp. 39�48.
ser. Natural Computing Se-
BIBLIOGRAPHY
127
[86] H. Chen, �Lower rate of convergence for locating a maximum of a function,�
Ann. Statist.,
vol. 16, no. 3, pp. 1330�1334, 1988.
[87] J. Kiefer and J. Wolfowitz, �Stochastic estimation of the maximum of a regres-
Annals of Mathematical Statistics,
sion function,�
vol. 23, no. 3, pp. 462�466,
1952. [88] E.
Vazquez,
optimization
J.
Villemonteix,
based
on
statistical approaches,� [Online]. Available:
noisy
M.
Sidorkiewicz,
evaluations:
an
and
E.
Walter,
empirical
Journal of Global Optimization,
study
� Global of
two
p. 17 pages, 2008.
dx.doi.org/10.1007/s10898-008-9313-yhttp://hal-supelec.
archives-ouvertes.fr/hal-00354656/en/ [89] R. Cranley and T. Patterson, �Randomization of number theoretic methods for multiple integration,�
SIAM J. Numer. Anal.,
vol. 13, no. 6, p. 904�914, 1976.
[90] M. Mascagni and H. Chi, �On the scrambled halton sequence,�
Methods Appl.,
vol. 10, no. 3, pp. 435�442, 2004.
[91] X. Wang and F. Hickernell, �Randomized halton sequences,�
Modelling,
Monte-Carlo
Math. Comput.
vol. 32, pp. 887�899, 2000.
[92] W. J. Moroko�, �Generating quasi-random paths for stochastic processes,� vol.
40,
no.
4,
pp.
765�788,
Dec.
1998.
[Online].
Available:
http:
//epubs.siam.org/sam-bin/dbq/article/31795 [93] J. Dupacova,
N. Gröwe-Kuska,
and W. Römisch,
�Scenario reduction in
stochastic programming: An approach using probability metrics,� ser. Stochastic Programming E-Print Series, J. L. Higle, W. Römisch, and S. Sen, Eds. Institut für Mathematik, 2000, no. 20, published; Springer; Berlin [u.a.]; Mathematical Programming; 95; 2003; 3. [94] P. Lavallée and M. Hidiroglou, �On the strati�cation of skewed populations,�
Survey Methodology,
vol. 14, no. 1, pp. 33�43, 1988. [Online]. Available:
http://www.amstat.org/sections/srms/Proceedings/papers/1987_142.pdf [95] V. Sethi, �A note on optimum strati�cation of populations for estimating the population means,� 1963.
Australian Journal of Statistics,
vol. 5, no. 1, pp. 20�33,
BIBLIOGRAPHY
128
[96] M. Kozak, �Optimal strati�cation using random search method in agricultural surveys,�
Statistics in Transition,
Available:
vol. 6, no. 5, pp. 797�806, 2004. [Online].
http://www.researchgate.net/publication/229051808_Optimal_
strati�cation_using_random_search_method_in_agricultural_surveys/�le/ d912f5062bc010dd58.pdf [97] J.
Linderoth,
A.
Shapiro,
and
S.
Wright,
�The
sampling methods for stochastic programming,�
empirical
Annals OR,
behavior
of
vol. 142, no. 1,
pp. 215�241, 2006. [Online]. Available: http://dblp.uni-trier.de/db/journals/ anor/anor142.html#LinderothSW06 [98] S.-C. Huang, R. Coulom, and S.-S. Lin, �Monte-carlo simulation balancing in practice,� in
Computers and Games,
2010, pp. 81�92.
[99] C. Hamzaçebi and F. Kutay, �Continuous functions minimization by dynamic random search technique,�
Applied Mathematical Modelling, vol. 31, no. 10, pp.
2189�2198, 2007. [100] Z. B. Zabinsky, �Random search algorithms,�
Research and Management Science,
Wiley Encyclopedia of Operations
2009.
[101] R. Storn and K. Price, �Di�erential evolution�a simple and e�cient heuristic for global optimization over continuous spaces,�
Journal of global optimization,
vol. 11, no. 4, pp. 341�359, 1997. [102] H. Takagi and D. Pallez, �Paired comparison-based interactive di�erential evoin Nature & Biologically Inspired Computing, 2009. NaBIC 2009. World Congress on. IEEE, 2009, pp. 475�480. lution,�
[103] M. Strens and A. Moore, �Direct policy search using paired statistical tests,� in
Proceedings of the 18th International Conference on Machine Learning.
Mor-
gan Kaufmann, San Francisco, CA, 2001, pp. 545�552. [104] M. Strens, A. Moore, C. Brodley, and A. Danyluk, �Policy search using paired comparisons,� in [105] N.
L.
Journal of Machine Learning Research,
Kleinman,
J.
C.
Spall,
and
D.
Q.
2002, pp. 921�950.
Naiman,
�Simulation-based
optimization with stochastic approximation using common random numbers,�
Management Science,
vol. 45, no. 11, pp. 1570�1578, 1999. [Online]. Available:
http://pubsonline.informs.org/doi/abs/10.1287/mnsc.45.11.1570
BIBLIOGRAPHY
129
[106] V. de Matos, of
stochastic
A. Philpott, dual
and E. Finardi,
dynamic
�Improving the performance
Applications � OR and
programming,�
Management Sciences (Scheduling),
2012.
[Online].
Available:
http:
//www.optimization-online.org/DB_FILE/2012/07/3529.pdf [107] A. Shapiro, W. Tekaya, J. P. da Costa, and M. P. Soares, �Risk neutral and risk averse stochastic dual dynamic programming method,�
of Operational Research,
European Journal
vol. 224, no. 2, pp. 375�391, 2013.
[108] M. Dowell and P. Jarratt, � The �pegasus" method for computing the root of an equation,�
BIT Numerical Mathematics,
vol. 12, no. 4, pp. 503�508, 1972.
[Online]. Available: http://dx.doi.org/10.1007/BF01932959 [109] N. I. M. Gould, D. Orban, and P. L. Toint, �Cuter and sifdec: A constrained and unconstrained testing environment, revisited,�
ACM Trans. Math. Softw.,
vol. 29, no. 4, pp. 373�394, 2003. [110] T.Back, F.Ho�meister, and H.Schewefel, �A survey of evolution strategies,� Dpt. of Computer Science XI, University of Dortmund, D-4600 , Dortmund 50, Germany, Tech. Rep., 1991. [111] O. Teytaud, � Conditionning, halting criteria and choosing lambda,� in
EA07,
Tours France, 2007. [Online]. Available: http://hal.inria.fr/inria-00173237/en/ [112] S. Droste, T. Jansen, and I. Wegener, �On the optimization of unimodal functions
with
the
(1+1)
evolutionary
Solving from Nature - PPSN V,
algorithm,�
in
A. Eiben, T. Bäck, M. Schoenauer, and H.-P. Schwefel, Eds. / Heidelberg,
1998,
vol. 1498,
Parallel Problem
ser. Lecture Notes in Computer Science,
pp. 13�22,
Springer Berlin
10.1007/BFb0056845. [Online].
Available: http://dx.doi.org/10.1007/BFb0056845 [113] V. Vapnik and A. Chervonenkis, �On the uniform convergence of relative frequencies of events to their probabilities,� in
plications, 16:264-280,
Theory of probability and its ap-
1971.
[114] R. Bergasse, �Stratégies d'évolution dérandomisées,� Ecole Normale Supérieure de Lyon, Tech. Rep., 2007. [115] N. Hansen and A. Ostermeier, �Completely derandomized self-adaptation in evolution strategies,� 2001.
Evolutionary Computation,
vol. 9, no. 2, pp. 159�195,
BIBLIOGRAPHY
130
[116] A. Ostermeier, A. Gawelczyk, and N. Hansen, �Step-size adaptation based on non-local use of selection information,� in
- PPSN III.
Parallel Problem Solving from Nature
Springer, 1994, pp. 189�198.
[117] H.-G. Beyer and B. Sendho�, �Covariance matrix adaptation revisited - the CMSA evolution strategy,� in
Proceedings of PPSN,
G. Rudolph, T. Jansen,
S. M. Lucas, C. Poloni, and N. Beume, Eds., 2008, pp. 123�132.
Foundations of Genetic Algorithms, 11th International Workshop, FOGA 2011, Schwarzenberg, Austria, January 5-8, 2011, Proceedings. ACM, 2011.
[118] H.-G. Beyer and W. B. Langdon, Eds.,
Appendix A Appendix Here are some useful de�nitions taken form
ca/Zoo_Glossary#ospeedup:
https://complexityzoo.uwaterloo.
adaptive Each question you ask (say to an oracle) can depend on the answers to the previous questions.
decision problem A problem for which the desired answer is a single bit (1 or 0, yes or no). For simplicity, theorists often restrict themselves to talking about decision problems.
function problem A problem where the desired output is not necessarily a single bit, but could belong to a set with more than 2 elements. Contrast with decision problem.
nondeterministic machine A hypothetical machine that, when faced with a choice, is able to make all possible choices at once - i.e.
to branch o� into
di�erent 'paths.' In the end, the results from all the paths must be combined somehow into a single answer. One can obtain dozens of di�erent models of computation, depending on the exact way this is stipulated to happen.
For
example, an NP machine answers 'yes' if any of its paths answer 'yes.'
By
contrast, a PP machine answers 'yes' if the majority of its paths answer 'yes.'
o
("little-oh") For a function is not
O
Ω(g(n))
(i.e.
f (n)
f (n)
to be
o(g(n))
grows more slowly than
("big-oh") For a function constant
k, f (n)
is less
means that
f (n)
is
and
g(n)).
f (n) to be O(g(n)) means that for some than kg(n) for all su�ciently large n. 131
O(g(n))
nonnegative
APPENDIX A. APPENDIX
132
Ω
(Omega) For a function constant
Θ
k, f (n)
f (n)
Ω(g(n)) means that for some kg(n) for all su�ciently large n.
to be
is greater than
(Theta) For a function
f (n) = Ω(g(n))
f (n)
to be
Θ(g(n))
means that
nonnegative
f (n) = O(g(n))
and
(i.e. they grow at the same rate).
polynomial To mathematicians, a polynomial in
n is a sum of multiples of nonnegative integer powers of n: for example, 3n − 8n + 4. To computer scientists, on 2
the other hand, polynomial often means upper-bounded by a polynomial: so
n + log(n),
for example, is "polynomial." Also an adverb ("polynomially"). A
function that grows polynomially is considered to be 'reasonable,' unlike, say, one that grows exponentially.
quasipolynomial
c
O(2log n ),
for some constant
c.
subexponential Growing slower (as a function of
n) than any exponential function. o(n) Depending on the context, this can either mean 2 (so that the Number Field 1/3 n Sieve factoring algorithm, which runs in about 2 time, is "subexponential"); o(n� ) or 2 for every � > 0.
superpolynomial Growing faster (as a function of This is not the same as exponential:
n) than any polynomial in n. log n for example, n is superpolynomial, but
not exponential.
lower bound A result showing that a function grows at least at a certain asymptotic rate.
Thus, a lower bound on the complexity of a problem implies that any
algorithm for the problem requires at least a certain amount of resources. Lower bounds are much harder to come by than upper bounds.
upper bound A result showing that a function grows at most at a certain asymptotic rate. For example, any algorithm for a problem yields an upper bound on the complexity of the problem.
tight bound An upper bound that matches the lower bound, or vice versa. I.e. the best possible bound for a function.
with high probability (w.h.p.) Usually this means with probability at least 2/3 (or any constant greater than 1/2). If an algorithm is correct with 2/3 probability, one can make the probability of correctness as high as one wants by just repeating several times and taking a majority vote. Note: Sometimes people say "high probability" when they mean "non-negligible probability."