Feasibility Study of MEMS-Based Accelerator Grid Systems .... Pulsed Plasma Thruster (PPT) technologies exist and also have reached very high levels of ...
FeasibilityStudy of MEMS-BasedAcceleratorGridSystems for Micro-Ion Engines: Electric Breakdown Characteristics Juergen Mueller', David Pyle", Indrani Chakraborty', Ronald Ruiz', William Tang", and Russell Lawton' Jet Propulsion Laboratory California Instituteof Technology Pasadena, CA 91109 dbxide was investigated
Low-temperature (LTO) chemical vapor deposited (CVD)
for use as an insulator materialinmicrofabricatedionengineacceleratorgrids.
as well as surface breakdown
substrate (bulk)
thicknesses for substrate breakdown breakdowns were performed over gap Substrate breakdown forlarger
experiments were performed.
tests ranged between
V. A slight decreaseinbreakdown
thicknesses was observed.Temperature
strengths do exist, however,aresmall.Onlya noted at 400 Cvs. strengthsranged
5 pm and
600-700 V/pm were measured,
strengths up to
600 pm.
allowing
for
field strength
effects onsubstratebreakdown
field
15% drop in breakdown field strengthwas
strengths measured at roomtemperature.Surfacebreakdown
as high as 260V/pm
Oxide
3.9 pm. Surface
1 pm and
distances ranging between
maximum stand-off voltages of2500
Both
, leading
to astand-offcapability
5 pm oxide film. Tests wereperformedtostudythe
field
of 700 Vovera
influence of silicon oxide surface
morphologyonthesurfacebreakdownstrengthandnonewasfound.
I. INTRODUCTION A strong interest has arisen recently within the aerospace community to develop micropropulsion devices capable of delivering very small thrust values and low impulse bits while are availablewithcurrent featuringenginesizesandmassesordersofmagnitudesmallerthan technologies'. Applications for such devices would span propulsion needs of some of the smallest primary andattitudecontrolof andlargestspacecraftcurrentlybeingenvisioned,rangingfrom microspacecraft,toprecisepositioningcontrolofspacecraftconstellationsforinterferometry of solar-pressureinducedtorquesonlargeinflatablespacecraft. missions,tocompensation Microspacecraft*, typically defined as spacecraft having wet masses of a few tens of kilograms, and possiblyextendingintothesub-kgmassrange, are beingconsideredinordertoreduceoverall 'Advanced Propulsion Technology Group. Senior Member AIAA. **Academic Part-Time, University of Texas. "EMS Group, Micro Devices Laboratory Group Supervisor, MEMS Group, Micro Devices Laboratory. Failure Analysis Group ++
mission cost by reducing themass of the spacecraft. Since launch costs may contribute as much as 30 % to the cost of a mission, microspacecraft will be more cheaply to launch, thus allowing for more frequent access to space. Microspacecraft may also be deployed in fleets or constellations, charting entire regions of space, and reducing mission risk by not relying a on single craft. However, microspacecraft require radically new approaches in design, both on the system as well as component level. While significant progress inthat direction is being made in the instrument, attitude sensing,as well as data handling and storage areas, for example, propulsion still appears to be fit thedesignconstraints lacking in this regard,offeringonly limited hardwarechoicesableto size as well as power'. Virtually all propulsion imposed by microspacecraft with respect to mass, subsystem areas, such as attitude control, primary propulsion and feed system components, are still in need for suitable design solutions. Withinthe primary propulsion area high specific impulse options may be of particular interest, since their ability to conserve considerable amounts of propellant mass may have a significant bearing on microspacecraft design. Other space applications, such as the aforementioned interferometry-classor space inflatable spacecraftalsomayhave a need forsmall,light-weightenginetechnologyabletoprovide a continuous,lowlevelthrusttooffsetsolar-pressureinduceddisturbancetorques,forexample. Depending on the mission, these thrust levels may range from as little as a few mircro-Newtons3 to a few milli-Newtons. Again, due to the fairly long durations of thrust required over the course of the missions in some of these applications, high specific impulse devices may be desirable. Currently among the most mature high-specific-impulse (Isp) propulsion technologies is ion this technologyonNASA's Deep Space(DS) 1 propulsion,asevidencedbytherecentflightof mission. Presently available engine technology, however, is relatively large, extending from beam diameters of 30 cm in case of the DS-1 engine, down to about 10-cm, and requiring power levels on the order of several thousands to several hundreds of Watts'. Thus, there obviously exists a need to furtherminiaturizethistechnologytomakeitmoreamenabletotheaforementionedmission categories. Other competing thruster options, such as Field Emission Electric Propulsion (FEEP) and Pulsed Plasma Thruster (PPT) technologies exist and also have reached very high levels of maturity or both are expected to play a role in the types of mission applications up to the point that one be discussed3.However,micro-ionenginetechnology,ifitcanbesuccessfullydeveloped,will characterized by a uniquecombinationofhighspecificimpulsecapability,theuseofinert,noncontaminatingpropellants,lowerthrust-to-powerratiosthanobtainablewithFEEPsystems,for example, and, unlike the inherently pulsed PPT devices, a continuous mode of operation.
2
AttheJetPropulsionLaboratory(JPL)thereiscurrentlyunderway a feasibility study to sizes dramatically below current state-of-the-art levels. investigate the potential of reducing ion engine mN range are being Engine diameters in the 1-3 cm range and thrust levels in the sub-mN to few of small a size, several feasibility issues will targeted. In order to arrive at a functional ion enginethis need to be investigated and overcome. Among these are the sustainability and efficient operation of high surface-to-volume ratio plasma discharges, the replacement of hollow-cathode technologies with lower-powerconsumingandeasiertominiaturizecathodesystems,suchasfieldemitterarray technology4, to functionas engine cathodes and neutralizers, and miniature accelerator grid system fabrication and operation,as well as the feasibility of fabrication and operation of miniaturized power conditioning units and feed system components.
In this paper, the feasibility of microfabricated grid designs will perspective of obtainable grid breakdown voltages.
be investigatedfromthe
11. MICROFABRICATEDGRIDDESIGNISSUES Although the targeted micro-ion engine diameters of 1 -3 cm are such that microfabrication technologies may not be needed to machine the engine body, a case can be made to investigate the feasibility of microfabricated grid designs. Smaller diameter engines allow grids to be spaced much morecloselywithrespecttoeachothersincetheamountofelectrostatic-stressinducedgrid deformation, as expressed by the height of the resulting dished contour of the grids, will be less. Placing grids closer with respect to each other will increase the grid perveance, proportional to l/d2, with d being the grid spacing. Thus, higher beam currents could be extracted form the engine for a given voltage, extending its performance range. However, ion optical considerations generally require gridaperturediametersto be scaleddown in sizewiththegridspacinginordertoavoidion impingementsongridscausingpotentiallyenginelifethreateningerosion,forexample.Smaller aperturediameters,andtherequirementtoplacegridaperturesofthevariousgrids(screen, to each accelerator, and, potentially, decelerator grid) of a grid system concentrically with respect other, requires tight machining tolerances. Even current grids are machined within 0.05 mm, or 50 pmtolerances,representingalimit
in mostcasesformanyconventionalmachiningtechniques
typically used in grid fabrication, such as electric discharge machining or laser drilling for example. Usingmicrofabricationtechniques,however,muchsmallertolerancescaneasilybeobtained.In addition,theabilitytoproduceentirebatch-fabricatedgridsystems,notrequiringanyadditional as well . assembly and grid alignment procedures, weighs in favor of microfabrication techniques
3
In this paper, the feasibility of grids based on silicon-based MEMS (Microelstroaechanical Systems) machining techniques is being explored. While other microfabrication possibilities exist, silicon MEMS techniques were investigatedfmt due to considerable heritage and experience available with these technique, as well as its demonstrated ability to produce extremely small feature sizes within very tight tolerances of1 pm or less. However, MEMS-fabrication of accelerator grids opens up ahostoffabricationandoperations-relatedissues.Foremostamongthemistheselectionof appropriate grid materials, suitingboth microfabrication as well as grid operation needs, in particular In particular the grid insulator with respect to sputter erosion and voltage stand-off characteristics. material, isolating the screen and accelerator voltages from each other, will have to be able to stand off voltages on the order of 1.3 kV or more over distances on the order of a few micrometer if current as is desirable. grid voltages, and engine specific impulses, are to be maintained,
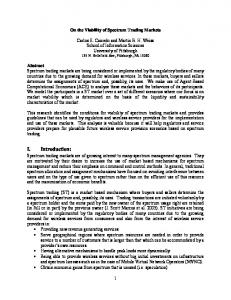
It is the scope of this study to investigate the feasibility of silicon dioxide as a grid insulator material.Siliconoxidewaschosensinceitexhibitsgoodelectricinsulatingcharacteristicswhen compared to other materials used in silicon-based MEMS fabrication, and is already widely used in the microfabrication field. In order to study the suitability of silicon oxide for this application, both as well as electric breakdown characteristics along its surface bulk electric breakdown characteristics, need to be studied. This is evident when inspecting Fig. 1. As can be seen, both modes of electric breakdown, substrate (or bulk) and surface, are possible in a typical grid design. The latter may occur along the walls of grid apertures. Two experiments were conducted using specially designed silicon oxide breakdown test chips to systematically study both modes of electric breakdown, and will be described in detail below. The here performed measurements can only be regarded as a first step in evaluating MEMSbased grid designs. Besides the always existing possibility that other insulators, deposited in newly modified and previously untried processes, may result in different breakdown characteristics, one of the most important feasibility issues with respect to grid designs such as the one shown in Fig. 1 is the possibility of coating the insulator material along the exposed grid aperture wall surfaces with conducting, sputter-deposited material. Shadow-shielding around grid spacers is commonly used in grid system today, and similar concepts will need to be explored for microfabricated grids, and be to integrated into the batch fabrication process. However, insulator grid breakdown characteristics were regarded as a logical starting point for a MEMS grid feasibility investigation to be followed up, if successful, in later studies by topics of considerably higher degrees of complexity in fabrication, such as insulator shielding.
4
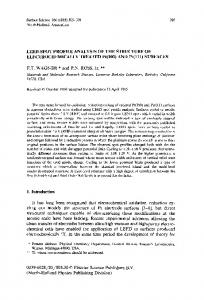
11. PREVIOUS RELATED RESEARCH It may seem surprising at first that a detailed study of breakdown behavior of oxide films is been performed in this area over the past necessary since a substantial amount of research has already decades. However, a closer examination of the available literature reveals that results obtainable from past research may notbe directly applicable to the problem studied here. Most previous research work on breakdown characteristics has been focused on studying the electric breakdown of gate oxides in MOSFET (Metal-on-Silicon Field Effect Transistor) applications. These gate oxides are typically very thin, less than one tenth of a micron thick, and the required minimum breakdown voltages range into the tens of volts, and thus are significantly lower than the kV-voltagerangeconsideredforgridapplications.Oneparticulartypeofoxidemostfrequently consideredforgateoxideapplications is thermaloxide.Thisoxidelayeriscreatedbydirectly oxidizing the silicon surface in an oxygen furnace ( d r y oxide), sometimes aided by the addition of steam (wet oxide) to increase film growth rates5. StudiesonbreakdownstrengthsofthermaloxideshavebeenperformedbyOsburnand O r m ~ n d ~Osburn . ~ , and Weitzmand, Klein’, Chou and Eldridge”, Soden”, Fritzsche’*, W~rthing’~ and Yang et a l . 1 4 . Typically two types of breakdowns were observed by all researchers: theso called Primary breakdownfieldstrengthsrangefrom primaryandtheintrinsic,orfinal,breakdown. approximately 200 V/pm to as high as lo00 V/pm, whereas final breakdowns follow a more sharply peakeddistributionrangingbetweenapproximately
800
-
10oO V/pm6. Insome
cases, final
breakdown strengths as high as 1400 - 1500 V/pm have been observed for extremely thin oxides7. As Primary breakdowns are thought to be triggered by thermal instabilities along defects in the oxide’. resistance is locally increased at these defect sites, conductivities locally decrease and the resulting so on, until increase in current adds heat dissipation, leading atofurther decrease in conductivity, and
breakdownoccurs.Usingvery
thin electrodes(lessthan
0.3 pm inthecaseofOsburn’sand
be destroyed through evaporation of electrode material near Ormond’s experiment7) the electrode will the breakdown location, thus representing a “self-healing” breakdown since no electrical contact can loss of conductive material. This allowsall defect be maintained between the two electrodes due to the is reached. This related breakdown sites to be eliminateduntiltheintrinsic,orfinal,breakdown breakdown strength thus corresponds to the dielectric strength of ideal, defect-free oxide material. Different theories evolve around this final breakdown and both thermal breakdown’, similar to the as well as electronic breakdowns7 due to process thought to govern defect-triggered breakdowns,
5
electron avalanches have been proposed. Chou and Eldridge” have succeeded in fabricating virtually in final breakdown strengths defect free thermal oxides and eliminated primary breakdowns, resulting of 600-700 V/pm and up to loo0 V/pm for thermal oxide coated with phosphorsilicate glass, filling pits in the oxides which were believed to have triggered breakdowns. Whileitthusappearspossibletoachieveratherhighelectricbreakdownstrengthsusing be stood off with these oxides may, carefully prepared thermal oxides, absolute voltages that can are typically grown only however, be rather limited. This is largely due to the fact that thermal oxides up to thicknesses of around
1 pm, possibly somewhat larger, but typically always less than 2 pm.
The reason for this limitation can be foundin the thermal oxidation process. The surface is oxidized directly, i.e. no oxide layer is deposited onto the silicon surface, and the oxide layer instead grows partly into the silicon, using the substrate silicon to form the oxide5. Since new oxygen arriving at the an increasingly thicker oxide layer to form an oxidation reaction with the surface now has to penetrate underlying silicon, diffusion limitations will eventually occur, resultingin increasingly larger process times until the process becomes impractical. Therefore, even using Chou’s and El”idge’slo values for defect-free oxides, the obtainable voltages that can be stood off for oxides being less2than pm thick 1.3 kVwill be required for grid maythusbesomewhatmarginalassumingthatvoltagesof to maintained. applications andan adequate additional margin of safety will have be
If,aswas thecase in mostoftheexperimentsconducted,muchlowervoltageprimary breakdowns occur, stand-off voltages would be insufficient for ion engine grid applications. The process of “self-healing” breakdowns, while appropriate in the conduction of experiments addressing fundamental research, would not be suitable for operational ion engine grids since the massive erosion of thin electrode material would lead to grid destruction. In addition, thermal oxides will need to be grown directly on silicon surfaces, thus limiting the choice of substrate materials to silicon only. Although silicon can be doped to render it electrically conductive, other considerations, such as the of ion engine grid lifetimes, may make this too all-important sputter yield considerations in view limited a choice. Other oxides that have been investigated in the past are RF-sputter deposited oxides. These oxides can be grown to much larger thicknesses (several microns) since the silicon surface is coated with externally supplied, sputter-eroded silicon oxide material. Limitations with respect to thickness arise eventuallyas thick oxides develop intrinsic compressive stresses which may lead to delamination of oxide from its substrate material. Pratt” performed dielectric strength measurements on RF-sputter deposited oxides, however, given targeted applications in the electronics industry, focused only on 6
very thin oxides. Measured dielectric strengths ranged from
lo00 V/pm at 0.07 pm to about 220
V/pm at 0.7 pm. This trend of decreasing electric breakdown field strength is noteworthy and has also been noted for thermal oxides. While breakdown voltages typically still increase with increasing oxide thickness, the trend towards lower electric breakdown field strengths for thicker oxides limits the voltage stand-off capability. In the case of Pratt’s experiment, the breakdown voltage at0.7 pm can thusbe calculated to about150 V. Klein and GafniI6reported electric breakdown field strengths for vapor-deposited oxide films an oxygen atmosphere. Silicon on glass slides, fabricatedbyevaporationofsiliconmonoxidein dioxide and silicon monoxide layers were created. thick and yielded breakdown strengths of Siliconmonoxidelayersofupto
The silicon dioxide layers were up to
0.49 pm
490 V/pm, or about 250V voltage stand-off capability.
5 pm weredepositedandresultedinelectricbreakdownfield
strengths of 192 V/pm, thus yielding a voltage stand-off capability of
just under lo00 V. Silicon
monoxidebreakdownfieldstrengthswerefoundto be lowerthanthoseforsilicondioxidefor comparable oxide thicknesses. Again,as in the case of thermal and sputter-deposited oxides, a trend towards lower breakdown field strengths with increasing oxide thickness could be noted. The survey of the literature thus established the need for a more targeted investigation of thick oxides capable of delivering stand-off voltages comparable to typical grid voltages with acceptable are knowntoproducegoodelectric marginsofsafety.Chemicalvapordeposited(CVD)oxides insulation and canbe deposited to thicknesses up to about 5 pm. While some breakdown data canbe found in the literature, they very often do not give film thicknesses, or list data for relatively thin films only given the present focus of applications in the semiconductor electronics field. More detailed informationwasrequiredespeciallyconcerningbreakdowncharacteristicsofthickoxide films, surface breakdown data,as well as temperature dependence of the breakdown strength of these oxides 300 - 4OOC. since grid operating temperatures may range between Therefore, a systematic study of breakdownstrengthsof LTO-CVD oxides was initiated. limited Preliminary results were reported in an earlier paper17. Those tests were conducted with a amount of test chips and thus provided only a very preliminary data base. Although tests in Ref. 17 were initially only targeted to provide substrate, or bulk, electric breakdown field strengths, and tests werethereforeconductedinatmosphereforsimplicity,unintendedelectricbreakdownsalongthe
7
surface were also noted during those experiments. Surface electric breakdown field strengths at the gap distances encountered (about 200 pm) were low, ranging only around 2V/pm. This necessitated a further development of this experiment. First, test chips intended for the measurement of substrate be redesignedtoeliminatetheparasiticsurfacebreakdowns,and a more breakdownshadto be initiated.Thelattertestswereto be systematicexaminationofsurfacebreakdownshadto conducted under vacuum conditions to eliminate any gas breakdown or surface contamination effects. describe this new set of experiments in detail. The following section will 111. DESCRIPTION OF EXPERIMENT The experiments (substrate, or bulk, and surface breakdown) were conducted with two types been tested.About100substrateand100surface oftest chips.Atotal of about200chipshas breakdown tests have been conducted. The chip type used for substrate breakdownis shown in Fig. 2. Each chip is 1 x 1 cm2 in size. It consistsof a silicon substrate wafer (400 pm thick) onto which a
#O resistivity). Next a layer of LTO thin layer(0.3 pm) of doped polysilicon is deposited (about 22 oxide, using a low pressure CVD (LPCVD) silandoxygen process, is deposited up to a thickness of 3.9 pm at around 450C. Poly and oxide deposition was performed at the University of Berkeley. Some chips tested were poly and oxide-deposited at the University of California/Los Angeles (UCLA) earlier using a similar process, yielding oxide thicknesses of a maximum of 2.7 pm. The latter type of chips was also used in previous tests reported in Ref. 17. Depending on the desired oxide thickness, the oxide layer is etched back. Next, a via is etched into the oxide to provide access to the polysilicon layer, which will form one of the two electrodes. Finally, a 0.25 pm thick aluminum layer is deposited onto the chip, patterned and etched to form the second electrodeas well as a heater coil. This (square-shaped) heater coil can be seen in Fig. 3 and is used to heat the chip for breakdown testingat elevated temperatures. Temperatures up to 400 C have been achieved with this design at power levels of about1 1W (160 V, 0.07 mA). Small variations in heater coil performance were found from chip to chip. The substrate breakdown tests were performed under atmospheric conditions by placing the quartz fixture, which in turn was placed underneath an IR camera test chips into a specially designed (see Fig. 4). The IR camera was used for temperature measurements and was also able to record arcing on the chip at ambient temperature. The IR image was recorded on video tape for later test
8
evaluation. The chip was contacted via a probe station featuring four adjustable probe tips. Two tips servedashigh-voltageleadswhiletheremainingtwowereusedtocontacttheheatercoil. Unfortunately the range of the probe tips was not large enough to test entire wafers. Therefore, wafers had tobe diced into individual chips and the chips were tested one by one. The designof the surface breakdown test chip varied slightly from substrate breakdown chip design. The surface breakdown chip design is shown schematically in 5.Fig. The chip isof the same size as the substrate breakdown chip and very similar in appearance to the chip in Fig. 3, however, featuringsmallercontactpadareas.Inthecaseofthesurfacebreakdowntestchip,nodoped polysiliconlayerwasdepositedontothesiliconsubstrate.InsteadLTOoxide(sameprocess as describedabove)wasdepositeddirectlyontothesubstratewafer.Followingwas an aluminum deposition (same thicknessas above), and pattern and etching of the aluminum. Aluminum pads were placedbetween100pmand
600 pmapart,in100pmincrements.Later
in thecourseofthe
experiment it was found that testing of molybdenum contact pads was considered desirable, and accordingly chips featuring contact pads made from this material were fabricated. Pads on that set of chips were separated by 5, 10,20, 100,200, and 300 pm, respectively, taking into accountnew data foundwiththeprevioulsydescribedaluminumchips,indicatingmuchhighersurfacebreakdown strengths than measured in earlier tests. In order to simplify the fabrication process, the surface breakdown test chips also featured a
run as the wafers 3.9 p n thick oxide which allowed the wafers to be fabricated in the same oxidation bound for substrate breakdown chip fabrication. In the course of the tests it was noted that the thick oxide had suffered localized surface delaminations in the shape circular, droplet shaped protrusions due to the high intrinsic stresses in the thick oxide. Since it was uncertain how these delaminations would affect surface breakdown strengths, another set of surface breakdown chips featuring a 2 pm thick oxide layer, free of surface delaminations, was also fabricated, and tests were performed with both set of chips to determine the effect of surface morphology on surface breakdown characteristics. The surface breakdown chips were mounted into a different probe station, also featuring four probe tips, that could be attached to a Scanning Electron Microscope (SEM) vacuum stage (see Fig. 6).Pressures as low as 1 x Torr could be obtained, although the majority of tests was performed Torr, measured using the SEM stage pressure gage, since this pressure level could at around 3 x be reached rather quickly using the existing pumping facilities. The vacuum stage of the SEM was turbomolecular pumped.
9
Both breakdown experiments, substrate and surface, were conducted using a portable DC Hypot device by Associated Research, Inc (Model 5220A). This device is capable of delivering up to 15 kV voltage at currents of2 mA or less. Voltages wererecorded with a separate voltmeter (Simpson 260 Series 4). Currents were registered on the scale provided with the Hypot device. This current scalewascalibratedandknowntobe accurate within 3-5%. prior tobreakdownofthe chips, however, it was noted that most of the current registered (in the pA range) was flowing through the voltmeter, as currentlevelswereseverelyinfluencedbyvoltmetersettings.Duringbreakdown, however,currentstypicallyranged as high as 0.5 mA andvoltmetereffectswerenegligibleby comparison. All chipswerecleaned after dicinginsidethemicrofabricationcleanroomfacilitiesin an acetone ultrasonic bath for 10 minutestoremovecontaminantsandremainingphotoresisttraces, followed by an isopropyl alcohol rinse to remove remaining acetone residues, followed in turn by a dry, andwere finally subjectedtoanoxygenplasma etch at 200 W for 10 minutestoremove remaining organic residue. The chips were then sealed inside plastic trays. The chips were left sealed time they were subjected to the laboratory inside those trays until the moment of usage, at which environment either for the duration of the test (substrate breakdown), or, in the case of the surface the breakdown tests, for the durationit took to install one chip onto the probe station and pump down system, typically a few minutes.
IV. SUBSTRATEBREAKDOWNTESTS OxideThicknessDependence Determiningbreakdownfieldstrengthwithrespecttooxidethickness is crucialinthe in ionacceleratorgrids. As wasseeninSection 11, electric evaluationofLTOoxidesforuse vary withoxidethickness,andsimpleextrapolationofa breakdownfieldstrengthstypically breakdown field strength obtained for one oxide thickness to a much different thickness may not be appropriate. Chips with oxide thicknesses of 1, 1.5, 2,2.7, and 3.9 pm were tested. The breakdown field strengths vs. thickness are plottedin Fig. 7. As can be seen, for the thicknesses studied here a small downwardtrend in breakdownfieldstrengthcanbenotedwithincreasingthickness. Breakdown field strengths range between approximately600 - 750 V / p at 1 pm oxide thickness to around 600 - 650 V / p at 3.9 p.Two data points significantly below those values can be found for
10
two 3.9 pm chips. These values may likely be due to oxide defects. The curve fit shown in Fig. 7 excludes these two data points. Breakdown voltages can thus be found between 600 - 750 V at 1 pm oxide thickness, approaching2000 V at 2.7 pm thickness, and reaching values as high as 2500 V at 3.9 pm oxide thickness. Thusit can be estimated that LTO oxide thicknesses of 3 pm or greater are fullysufficienttostandofftypicalgridoperatingvoltages,asfar as substratebreakdownis a concerned. Later it will be shown that fortheassociatedsurfacebreakdownforthisthickness different conclusion may have to be drawn. The data obtained in this study for LTO CVD oxide were compared with data obtained for different oxides from the previously reviewed literam (see Section 11). Breakdown field strengths are compared in Fig.8. As mentioned already in Section 11, for various oxides at different thicknesses in this study have been recorded in breakdown field strengths much larger than the ones obtained almost every case found in the literature, however, at much lower oxide thicknesses. This increase in breakdown field strength with decreasing oxide thickness appears to become more pronounced with thinner oxides in all cases, independent of the oxide considered, although numerical values vary from oxide to oxide. Thermal oxide breakdown strengths are particularly remarkable, which is precisely the reason for their extensive use as gate oxides in MOSFET applications. It should be noted, however, 8 for thermal oxide, taken from Ref.10, are the aforementioned intrinsic, that the values listed in Fig. are typically orfinalbreakdownvalues,andprimarybreakdownvaluesduetooxidedefects significantly lower. Thevalueofthisinvestigationbecomesevidentwhenplottingtheobtainedbreakdown LTO oxides, voltages vs. oxide thickness, as shown in Fig. 9. Due to the availability of thicker achievable breakdown voltagesare much higher for LTO oxides than for any other oxide considered - the in this comparison. Even if breakdown voltages for thermal oxides were to be extrapolated 1into 2 pmthicknessrange(roughlythemaximumobtainablethermaloxidethickness),obtainable
breakdown voltages wouldbe marginal for ion engine grid applications, and LTO oxides, due to their largerachievablethicknesses,willstilloutperformthermaloxides,aswell as all otheroxides 9 thus very clearly validate the necessity of this study. considered. These results displayed in Fig. TemperatureDependence
11
pm thickLTOoxide
InFig.10electricbreakdownfieldstrengthsfora1
at various
temperatures are shown. Temperatures werevaried from ambient (23 C) toas high as 400 C. Typical grid temperatures for conventional (macro-sized) grids range between 300- 400 C. As can be seen, breakdown field strengths decrease slightly with temperature.At ambient, breakdown field strengths range around 600 - 750 V/pm (and breakdown voltages accordingly around 600- 750 V for a 1 pm thickoxidesample).
At 400C,thebreakdownstrengthhasfallenoffto500
-
650V/pm,
corresponding to a breakdown voltage range of 500- 650 V. This corresponds to drop in breakdown strength and voltage of about 15%.
of 2.7 pm Attempts were made to repeat measurements at the more relevant oxide thicknesses and 3.9 pm, respectively. However, since these tests were performed under atmospheric conditions in ordertohaveaccesstothe IR camera,andhighervoltages are forreasonsofsimplicityand required to cause breakdown in the thicker oxides, heavy arcing was noted on and above the chip surface. Arcing was noted between different locations on the chip, between probe tips and as the chip, well as between probe tips. The arcing was found tobe more pronounced at higher temperatures and
mayhave
been duetoaPaschenbreakdown.Since
in thecaseofthe1pmsamplerequired
in breakdownvoltages are low,theseproblemswerenotencountered.Furthermore,thedrop breakdown field strength, at least for the smaller oxide thicknesses, is so low, and the margins with so great, that respect to breakdown strengths for ion engine grid applications for the larger thicknesses temperature effects are currently not being considered a serious impediment to proper grid function with respect to substrate breakdown. Visual Post-TestInspection of TestSamples Electron microscope scans were taken of various test samples after the breakdown tests to determine their failure mechanisms. Figure 11 shows a typical oxide breakdown. It is located at the of the photograph edge of the aluminum contact padarea, which is still recognizable in the lower part although heavily eroded in the immediate vicinity of the breakdown. Note the relatively large sizeof this breakdown, extending approximately 30 pm in diameter. Oxide thickness in this case was 2.7 pm. Electric breakdown occurred at 1800 V. The oxide used inthis case wasof the batch provided by UCLA.
12
Breakdown at the contact pad edges and contact pad comers by far outnumbered breakdowns at other pad locations. Similar observations were made by Soden" during his investigation of the dielectric strengthof thermal oxides. Soden attributed this fact to the lack of defects in the oxides. If defects would have triggered a breakdown, one would expect the breakdown sites to be distributed more randomly. The fact that breakdowns instead occur predominantly on contact pad edges and comers arean indication that these may be intrinsic breakdowns, triggered by the higher electric field strength in these regions. Small inhomogenities on the contact pad surface or slight variations in the oxide thickness may trigger breakdown at one particular location along the contact pad edge versus us to believe that the another. The high number of breakdowns observed on contact pad edges leads oxides were mostly free of defects. Figure 12 shows a side-on view of the breakdown shown in Fig. 11, clearly indicating that the oxide layer, visibleas the lightly colored layerjust above the darker colored silicon substrate, has been penetrated (the polysilicon layer, being only 0.3 pm thick, is hardly visible on the photograph
and appears as a very thin black linejust between the silicon substrate and the oxide in the original). As can be seen, besides destroying the oxide layer, substantial damage has also been done to the silicon substrate located directly below the breakdown area, likely due to the substantial local Joule heating during breakdown. Although no temperature measurements on the arc were performed in this study, Klein',inperformingspectroscopictemperaturemeasurementsonthebreakdown arc, determined arc temperatures onthe order of 3900 - 4500 K for thermal oxide breakdowns. If similar as well, these values would certainly be sufficient to temperatures were to occur in LTO breakdowns melt the silicon substrate, havinga melting temperature of about1400 C. Figure 13 showsaspectral(X-rayfluorescence)analysisofthedistributionofelements surrounding the breakdown shown in Figs.1 1 and 12. Three picture segments show the distribution of silicon (top right), aluminum (bottom left) and oxygen (indicative of silicon oxide, bottom right) as seen from a top view position similar to the one shown in Fig.1 1. As can be seen by inspecting the top right segment, silicon is clearly visible through the gap in the oxide layer, which shows up as a scan in the bottom right segment, indicating the lack of oxide dark ring shaped structure in the oxygen here. This, together with the visual evidence presented in Fig.12, also gives a clear indication that a Also visible in these break-through to the underlying silicon/polysilicon layers has indeed taken place. scans is the heavy erosion of the aluminum contact pad (located in the lower half of the picture segments).Whilesomealuminumtracescanstill be foundinthisarea (see lowerleftpicture in segment), the silicon oxide, onto which the aluminum contact pad was deposited, is clearly visible this area nowas well ( s e e lower right picture segment).
13
InthecaseshownFigs. 11-13, as inallbreakdowncasesrecordedduringthissetof experiments, a permanent short was noted after breakdown. Voltages typically collapsed to values been as high as several hundred or even ranging around a few tens of volts or less (after having mA were measured thousands of volts just prior to the breakdown) and currents in excess of 0.5 (current values prior to breakdown were the on order of a few micro-Amps to possibly extended into the low 20 pA range in some cases, but were found to be dependent on the volt-meter setting. It is thus believed thata substantial fraction ofthis current went through the meter, rather than through the sample). The shortis likely causedby the severe disturbances noted in the breakdown area, as seen in Fig. 12, mixing elements of the various chip layers, thus providing electrical contact. Figure14showsanotherbreakdownofachipfeaturing2.7
pm thickoxide,withthe
breakdown also occurring at 1800 V, as in the case of the chip depicted in Figs. 11 through 13. This chip was fabricated using the oxide provided by Berkeley. A peculiar meandering pattern can be noted on the chip surface in areas that have seen heavy aluminum pad erosion. The sequence of events, as documented by the IR camera and recorded on tape, was as follows: Breakdown first occurred at a contact pad edge location in the top left comer of the pad area. The probe tip contacted the in pad area the location shown. After breakdownthe at contact pad edge, the aluminum pad eroded outward from the initial breakdown location, with the eroded aluminum pad edge recessing until it reached the probe V prior tiplocation.Atthispointtheerosionprocessstopped.Thevoltagedroppedfrom1800 to breakdown (at small pA current values believed to be conducted largely through the volt meter), to about 500- 600V and about 0.5mA during the surface erosiodarcing process,and finally collapsing to the aforementioned few to few tens of Volts depending on chip sample at currents ofmA, about 0.5 shorting the circuit. Current and voltage values, except for the initial breakdown voltage of course, in this fashion, except for the ones using the were found typical for most chips breaking down thinnest oxides (1 pm- see below). At first glance, the meandering erosion pattern seems to point to a pure surface breakdown phenomenon as aresult of arcing between the- after the initial breakdown at the pad edge - exposed grounded polysilicon layer and the aluminum pad edge which is heldathighvoltageandwhich as a result of excessive Joule heat. The surface typically evaporates around the initial breakdown area arcing between the breakdown area and the aluminum layer could then be thought to then continue to generate heat which causes the aluminum layer to ablate further until the probe location is reached,
14
representingthe minimum pathofresistancetothehigh-voltagesupply. however, reveals a more intricate process.
A more detailed study,
Figures 15 through 17 show a detailed view of the initial breakdown area and the starting point of the meandering “tree-shaped” pattern that was observed on the chip surface. Figures 16 and 17 were obtained by dicing the chip along one of the “branches” of the “tree” pattern. In Fig. 16, the initial breakdown can be seen, revealing a similar structure as the breakdown shown in Fig. 12. Again, a penetration of the oxide layer combined with a significant disturbance of the various layers of the chip (aluminum, oxide,plysilicon and silicon substrate) canbe observed. Just tothe right of the seen inFig.16,however,alongoneofthesurfacebreakdown ‘’hw initialbreakdownarea branches”, additional penetrations of the oxide and cavities formed inside the silicon substratebe can noted. This pattern continues if one were to progress further to the right of the locationinshown Fig. Fig. 16, as seen in Fig. 17. Clearly,a large penetration of the oxide can be noted in the left half of 17. Additional cavities appear to be sealed by the oxide layer, however, it should be noted that dicing furtherintothechipmayhaverevealedthesecavitiesto be “open” as well, thus quite possibly representing oxide penetrations as well. Thus, the process forming the meandering ‘’tree” pattern on the surface of this chip is clearly not a sole surface phenomenon, but involves subsurface events as well.
been observed by Klein’ during breakdown tests Similar erosion patterns have previously performed on thermal oxides. Klein termed these types of breakdowns “propagating breakdowns” and offered an explanation for their occurrence. According to Klein’, the breakdown starts aat single our experiments also. DuetotheJouleheatproducedby this initial location,asobservedin breakdown conductivity of the insulator material may be slightly lowered in the vicinity of the initial breakdown location, causing another breakdown to occur in an area immediately surrounding the initial breakdown location. The process now continues, causing the “tree branch” pattern to form. Since, as was noted in this study, a current of approximately 0.5 mA is constantly flowing between the two electrodes during this erosion process, a (however minute) voltage drop is expected to occur along the uneroded aluminum pad area, extending froma high value at the location of the contacting probe tip toa low value in the proximity of the eroded pad edge. Thus, a preferential direction is given for subsequent breakdowns to occur (towards higher voltage values) until one of the “tree branches” finally connects with the probe tip location. It should be noted that the observed surface erosion process could be stopped anytime after the initial breakdown and the low voltage short would still have been observed, as was demonstrated in various test runs.
15
Another interesting breakdown pattern can be observed in Figures 18 through 2 1. Figures 18 and 19 show a chip featuringan oxide thickness of 1 prn after a 750 V breakdown. As can be seen, multiple breakdown locationscan be recognized distributed over an area that was again located close to the contact pad edge. Several breakdowns had again occurred very near to this edge. In Figs. 20 and 21 another breakdown of a
1 prn oxide chip is shown. This chip broke down at 750 V also,
however, this test was performed at 205 C (all previous chips discussed in this section were tested at ambient temperature, about23 C). Again, multiple breakdown locations can be noted, many of them at one corner of the pad (see close to or on the contact pad area edge, with one breakdown occurring Fig. 21). All breakdowns again penetrate the silicon oxide layer deep into the silicon substrate and causing the already previously noted severe disturbance of the chip material in this area, again leading to a permanent short after breakdown. Current and voltage characteristics for the shorts lpm in chips were around 0.3 - 0.4 mA and with voltages ranging mostly around 0.15 V to about 12 V, with one in Figs. 18 and 20 didnotoccur valuebeing as high as 150V. Thebreakdownpatternsshown instantaneously, but required time to develop, with arcing starting near the edge or corner of the contact pad, and then progressing inward towards the probe tip location. In the case of the chip shown in Fig. 18, this process stopped on its own after reaching the state depicted in the figure. 0.3 mA and Current and voltage characteristics for these chips during this arcing process were around 400 V, and thus, as for the case of the shorts, slightly lower thanthe in case of thicker oxides. Again, this type of breakdown pattern has been observed before by Klein’ in his study of dielectric strengths of thermal oxides and was attributed by Klein to the same thermally triggered breakdown process as described above. However, the different appearances of the two classes of propagating breakdown patterns shown in Figs. 14 and 18 and 20, respectively, warrant a closer examination.Oneobviousdifferencebetweenthechipsexhibitingthesedifferentpropagating breakdown behaviors is the much smaller oxide thickness(1 pm vs. 2.7 pm) in the case of the chips shown in Figs. 18-21 vs. the chip shown in Fig. 14. Several tests were performed to examine how breakdown patterns for intermediate oxide thicknesses would appear. The results of one of these tests is shown in Fig.22. The breakdown pattern exhibited on this chip appears to be somewhat of cross a between the two classes identified above: While multiple, separated breakdowns did occur near the “tree” growth emanating from the breakdown edge, almost all of these breakdowns show rudimentary locations. Webelieveanexplanationforthisbehaviormaybefoundinpossiblydifferentthermal conductionprocessesinchipsofdifferentoxidethicknesses.Silicondioxide is apoorthermal
16
conductor when compared to silicon, the thermal conductivity being 1.4 W/mK in the case of oxide versusabout 150 W/mK for silicon.Giventhatthedestructionfoundunderneaththeinitial breakdown locations involves the silicon substrate, heat conduction away from the initial breakdown as well as through the silicon. Some portion of the heat site is likely to occur both through the oxide will be conducted radially outward directly through the oxide layer, while another portion will be conducted through the silicon and, from positions radially further outward from the initial breakdown location, maybe directed partially back into the oxide layer as this layer is being heated from the underlying silicon substrate. For thinner oxides a larger fraction of heat may thus be receivedat faster locationsfurtherawayfromtheoriginalbreakdownlocationbyconductionthroughthesilicon substrate, which in turn could lead to breakdowns further away from the initial breakdown site. Since those locations closer to the high-voltage probe tip will carry the majority of the current as it seeks its path of lowest resistance, the current passing through the original breakdown site may subside and no additional breakdownsin its immediate neighborhood,as shown in Fig. 16, may occur. The ultimate location of the individual breakdowns, apart from the temperature profile, may then be determined by small variations in oxide thickness or inhomogenities on the contact metal surface. Since again a as observed in current is constantly flowing between the two electrodes (polysilicon and aluminum), these experiments, a voltage drop will again extend from the high-voltage probe tip location on the aluminumpadtoitserodededgeandthusagainprovide a preferentialdirectionforfurther breakdowns, until the position of the high-voltage probe tip has been reached. As in the case of the previously discussed class of breakdowns, it can be stopped immediately after initial breakdown by turning off the voltage.
V. SURFACEBREAKDOWNTESTS Dependence onGapDistance As was noted in the Introduction and indicated in Fig. 1, in an ion engine accelerator grid arcing may also occur along the insulator oxide surface. Previous tests performed by the authors under atmospheric condition^'^ had led to parasitic surface breakdowns when performing substrate
breakdown tests. The resulting surface breakdown voltages were a troublesome
2Vlp.m over gap
distances of about 200 to 300 pm. Surface breakdown field strengths that low, if applied over a
5
micron thick oxide layer (corresponding to roughly the maximum LTO oxide thickness that can be deposited), would be wholly insufficient for ion engine grid applications. Thus, a more thorough investigationofsurfacebreakdownsalongLTOoxidesurfaceswasconducted.Thesetestswere
17
performed in a vacuum system, as outlined in Section III. Unless otherwise notes, breakdown tests x lo-' Torr. were performed at a vacuum pressure3of Given the low measured breakdown field strength in earlier
experiment^'^, initial tests were
performed with contact pads separated by a gap distance of 100, 200, 300,400, 500, and 600 pm, respectively.Resultsobtainedfromthesetests
are showninFig.
23. As can beseen,surface
breakdown electric field strengths range from around 20 V/pm at a 1 0 0 pm gap distance to as littleas 3 4 V/pm at a 600 pm gap distance between the aluminum pads. At values between 200 - 300 pm, electric breakdown field strengths are around 10 V/pm, thus clearly higherthan for breakdown under atmospheric conditions. Even these increased breakdown field strengths, however, were still too low for ion engine grid applications. Suspicions were raised that the use of aluminum, which has a tendency to form hillocks on its surface, may have led to decreased voltage stand-off capability as a result of these surface roughnesses'*. Aluminum had been used in the design of these test chips because of it being readilyavailableinourcleanroomfacilities,easeofuseinthemicrofabricationprocess,past expansive experience with itsuse as a MEMS material, as well as good sticking abilities. In addition, Osburn and Ormond7, in performing experiments aimed at determining substrate breakdown field strengthsforthermaloxides,hadtestedvariouselectrodematerials,includingaluminumand molybdenum, and had found no difference in breakdown behavior. To resolve remaining doubts and uncertainties chips using molybdenum contact pads were fabricated. In addition, due to the noted slight increase in breakdown field strength for the chips using aluminum pads, the mask design for the molybdenum chips was changed and now, in addition to gap distances of 100,200, and 300 pm, included gap distances of 5, 10, and 20 pm to perform tests at these lower gap distances as well. The obtained data are also plotted in Fig. 23 (open squares) and are to be noted: First, in represent the steeply inclined part of the curve. Two remarkable findings testing molybdenum chips ata 1 0 0 pm gap distance, it was noted that there is no apparent difference in surface breakdown field strength when compared with chips featuring aluminum contact Data pads. for the 1 0 0 pm gap distance for both types of contact pads almost overlap identically at around V/pm.TheseresultsobtainedforsurfacebreakdownexperimentsonLTOoxidesthusmirrors experiences gained by Osburn and Ormond7 with substrate breakdowns of thermal oxides.
18
20
Secondly, when decreasing the gap distance further, a remarkable increase in breakdown field strength can be noted. At least three measurements were taken for each gap, with results repeating each other with comparably little scatter in data. This increase in surface breakdown field strength mirrors a similar behavior found for substrate,or bulk, breakdown towards lower gap distances thus of many other oxides (compare with Fig.8). Note that two separate curve fits were used, one for the molybdenum data, another for the aluminum data, yet both curves appear to match very well.
This increaseinelectricbreakdownfieldstrength is encouraging, however, still not quite sufficient for ion engine accelerator grid use, as can be seen by inspecting Fig. 24. For gap distances of 5 pm,representingtheapproximatemaximumLTOoxidethicknessthatcanbedeposited, breakdown voltages remainjust below loo0 V. Thus, a new approach was explored. A setof surface breakdown test chips was fabricated featuringan oxide undercut extending below the (molybdenum) contact pad (see Fig. 25). The undercut was achieved through a Buffered Oxide Etch (BOE). This undercut was hoped to accomplish (1) an increased breakdown surface path, thus increasing surface breakdown voltages, and (2) eliminate the sharp90" edge of the pad in direct contact with the oxide, thus hopefully decreasing local field strengths and therefore delaying the onset of breakdown to larger voltages. This chip design was influenced by cold cathode designs. Using similar designs, Spindt'* has reported breakdown voltages of up250 to V/pm and more.
Table 1 lists results obtained withseta of chips featuringan oxide undercut as shown.A 5 pm gap was tested. For comparison, data obtained for chips with the same gap distance, but withoutan oxide undercut were tested as well. Both set of chips were fabricated from the same wafer and were exposed to the same fabrication processes and condition, except for the oxide etch in the case of the data point chips featuring the undercut. As can be seen by inspecting Table 1, although one single obtained for a chip featuring an undercut resulted ina record breakdown field strength of 260 V/pm at 1300 V breakdown voltage, the remainder of the results is not very convincing. As a matter of fact, in are some cases the breakdown field strengths and voltages obtained with chips featuring undercuts lower than those not featuringan undercut, although this may bean effect of the scatter of data.Thus, the undercut does not appear to be effective, at least within the current chip geometries. It is possible thattheoxideetchmayalsoaffectthemolybdenumandmayincreasesurface roughnesses, counteracting any desired effects the changein geometry may have caused, if any. It is interesting to note that breakdown voltages obtainable with cold cathode arrays, featuring similar electrodelinsulator
19
geometries, yields breakdown values as high as 250 V/pm, however, at smaller thicknesses'8. It is unclear whether breakdown occurs through the substrate or along the surface in these cases. PaschenBreakdownConsiderations An experimentwasconductedtodeterminetheinfluenceanyremainingrestgases in the 26, breakdown voltages are vacuum system might have had on the measurements, if any. In Fig. plotted versus the product of gas pressure inside the vacuum system and gap distance. Using this representation, if arcing through the rest gas would have been present, a Paschen-type curve should
0 pm and pressure was varied have resulted. All measurements were performed at a gap distance1 0of
bytakingmeasurements at variousstagesduringthepumpdownprocess.Thisallowedfor measurementsatpressuresrangingbetweenTorrto as lowas 10" Torr. Accordingly,pressure Torr cmto 2 xTorrcm.Typically, andgapproductsareextremelylow,rangingbetween far too the left of the minimum of the Paschen curve for these values would indicate a position commonly used gases that could have been present in the chamber (nitrogen, oxygen, water vapor traces). At these values, if aPaschenbreakdownwouldhavebeenpresent,breakdownvoltages should have been much higher than observed and should have decreased dramatically towards larger pressure and gap product values. In inspecting Fig. 26, however, it is clear that this is not the case. No particular trend is visible among the data points and only the usual scatter of theasdata, observed for measurements taken at constant pressure and gap distance as well (see Fig. 24), can be noted. Thus, it was concluded that the surface breakdowns observed were likely true surface effects. Influence of SurfaceMorphology During early surface breakdown measurements, chips fabricated from wafers featuring a thick
3.9 pm oxide were used for reasons explained in Section
111. In the course of these experiments it
was discovered that droplet-shaped surface features were present on the chip surface, and thus in the gap area as well (see Figs.27 and 28). Feature sizes ranged between 3 pm (Fig. 27) and less than 1 pm (Fig. 28) in diameter. Naturally, it was feared that these features could have had an influence on the obtained data and be at least partly responsible for the low surface breakdown strengths. It was as quicklydetermined,throughacombinationofX-rayfluorescencespectralanalysis,aswell various standard cleaning techniques, that the surface features were not contaminations resulting from organic residue, photoresist, or else, but, instead, were stress delaminations caused bythelarge
20
intrinsic stresses in the thick LTO layer. Consequently, wafers featuring thinner oxides (2 pm) were fabricated and used in subsequent tests. However, using these chips,an unexpected opportunity presented itself to study the influence oxide surface morphology might have on surface breakdown characteristics. Chips of the original 3.9 pm LTO batch, chips fabricated by UCLA using a 2.7 pm oxide featuring fewer delaminations, as well as the latest Berkeley batch using 2 pm oxide having no detectable delaminations, were tested and data obtained were compared. All surface delaminations inside the gap area were counted under an optical microscope and average surface densities in the gap area were calculated. These densities so, since are believed to be accurate within less than 10% or counting this great a multitude of features been tested and debris resulting lead to miscounts, in particular since in some cases chips had already from aluminum pad erosion had to be discerned from surface delaminations. However, this accuracy is believed to be sufficient, considering that a very wide range of surface delamination densities, as high as 4000/mm2were obtained. ranging from zero to Figure 29 shows the results forthree gap distances: 100,200 and 300 pm.No particular trend of breakdown field strength with respect to delamination density be canobserved for either of the gap data appearssomewhatlesspronouncedforlower distances.Thescatterinbreakdownfield delamination densities, but differences remain small. There definitely appears tobe no trend towards lower breakdown field strengths at higher delamination densities. Therefore, it was concluded that surface morphology of the type observed in Figs. 27 and 28 did not affect breakdown strengths. However, it should be pointed out that the particular surface features encountered here have relatively smooth shapes and comparably large radii of curvature. Visual Post-TestInspection of TestSamples All surface breakdown test samples appearedvery similar after breakdown. Examples of two chips imaged after breakdown are shown in Figs. 30 and 3 1. Both chips featured aluminum contact pads and a gap distanceof 100 pm. Arcing occurred preferentially at the comers of the pad area, but
also at straight edge sections. Depending on the intensity of the arcing, usually well correlated with at 2100V, or the magnitudeof the breakdown voltage, isolated bum marks, as in Fig. 30 (breakdown 21V/pm), or extensive erosion alongthe entire pad edge, as in Fig. 31 (breakdown at 3200V or 32 V/pm), canbe observed. Damage is typically more intensive on the negative pad (shown in the left of
21
both Figures) than on the positive pad. It is not certain what the cause for this behavior is. One explanation offered was that electron field emission from microscopic tips along the negative pad edge may have lead to local heating and thus increased erosion. An example of an (uneroded) aluminum small (approx. less than a contact pad edge canbe seen in Fig. 32. Tips protruding from the edge are microfabricatiodpatterning technology), however, few tenths of microns, representing state-of-the-art 33 shows the eroded negative pad area of a molybdenum pad. are sharply pointed. Finally, Fig. Molybdenum thickness was about0.05 pm and thus the damage was more severe. VI. CONCLUSIONS Microfabricated ion acceleratorgrids are being considered foruse in micro-ion engines due to be built. In particular for grids, requiring the unrivaled precision with which these components could a multitude of closely spaced apertures placed within tight tolerances to provide proper grid hole alignment and beam extraction, mirofabrication techniques may be beneficial. However, fabrication of these grids will require the use of new materials, typically not used in the fabrication of conventional an approach. grids, requiringan investigation into the feasibility of such Amongthematerialpropertiesto be studiedisthedielectricstrengthofgridinsulator materials. One of the most popular insulator material usedin the MEMS area is silicon dioxide. Most thinofthermal oxides for useas breakdown work in the past however, was focused on the evaluation gate oxides in MOSFETs. While these oxides show excellent electric breakdown field strengths for thin layers, thermal oxide, due to its growth process, can typically only be grown up to thicknesses not exceeding 2 pm. Over these thicknesses, the total voltage that canbe stood off is marginal with respecttoionenginegridapplications.
On theotherhand,
CVD depositedLTOoxidecanbe
deposited up to thicknesses of possibly 5 p.m. However, many details of the dielectric properties of LTO oxides, in particular for very thick films, and at elevated temperatures, were not known. Thus, a mixed at this thorough investigation ofthese properties was initiated. Results of this evaluation remain point ofthe investigation.
On the one hand, substrate, or bulk, electric breakdown properties of LTO oxide are excellent. Voltages as high as2500 V can be stood off over oxide thicknesses of 3.9 pm, providing more than sufficient margins ofsafety for grid applications. In addition, there are strong indications that the no defects that could lead to premature electric breakdown as evidenced by oxides used show little to thefactthatbreakdownsusuallyoccurrednearcontactpadedges,ratherthanbeingrandomly
22
distributed as would be expected if defects would have caused these breakdowns. No particularly adverse temperature effects with respect to breakdown strengths were noted for LTO oxides either. Although a small dropin breakdown strength was measured for 1apm thick oxide sample, decreases aresmall(approximately 15%) withincreasingtemperaturesfromambientto 400 C. Breakdown data found for other oxides, voltages obtained compare very favorably to corresponding literature such as thermal and sputter deposited oxides. In the case of thermal oxides this is mainly due to the be deposited. comparatively larger LTO oxide thicknesses that can On the other hand, surface breakdown properties still appear inappropriate. Although it was discovered that surfacebreakdownelectricfieldstrengthsincreasesignificantlywithsmallergap
distances,reachingvaluesaround
200 V/pn for 5 pm,obtainablevoltagesoverthesedistances
lo00 V).Newgridlinsulatorgeometriesweretherefore remainrelativelysmall(i.e.lessthan explored,basedon certain coldcathodedesignfeatures.Sincebreakdownstendedtooccur predominantly along contact pad edges and near corners, it was reasoned that the field concentration at these locations does play a major role in oxide breakdowns. Chips with oxide undercuts, extending at underneath the contact pad edges were therefore fabricated. The maximum obtainable field strength
break down obtained using these chips was 260 V/pm, but in most cases were comparable to results obtained with chips featuring no undercut, rendering the undercut rather ineffective. It is interesting to note that similar electrode/insulator configurations featuring oxide undercuts have been used in cold cathode arrays in the past and resulted in breakdown field strengths of to 250upV/pm. Thus,resultsobtained so farforionenginegridsfabricatedusingsilicon-based MEMS technologies do not look promising. There does exist the possibility to use these types of grids for or Argon, since required grid voltages will lighter inert gas propellants than Xenon, such as Krypton be lower, however, this will impose limitations on propellant selection that maynot be desirable. Another possibility that has emerged only recently theisuse of very thick PECVD (Plasma Enhanced Chemical YaporBposition) oxide films reaching thicknesses up 15 to pm as proposed by ..... ...... Although PECVD oxide films typically do not have the same quality as LTO oxide films, the much larger thickness available with these films may well compensate forany defects, if any. Finally, non be explored in the near future. silicon-based microfabrciation techniques will also
VII. ACKNOWLEDGEMENTS
23
TheauthorswouldliketothankMs.EuniceKooandMr.JamesBustilloofthe MicrofabricationLaboratories at theUniversityofBerkeley, as well as Mr.KevinTsingofthe UniversityofCalifornia/LosAngeles(UCLA)for perfodng thepolysiliconandoxidegrowth processing steps for the wafers used in the experiment. Theresearchdescribed in this paperwascarriedoutbytheJetPropulsionLaboratory, CaliforniaInstituteofTechnology,under a contractwiththeNationalAeronauticsandSpace Administration.
VIII. REFERENCES ‘Mueller,J.,‘‘ThrusterOptionsforMicrospacecraft A ReviewandEvaluationofExisting Hardware and Emerging Technologies”, AIAA Paper 97-3058, 33rd Joint Propulsion Conference, July 6-9, 1997, Seattle, WA. 2Collins,D.,Kukkonen,C., andVenneri, S., “Miniature,Low-CostHighlyAutonomous Spacecraft - A Focus for the New Millennium”,IAF Paper 95-U.2.06, Oslo, Norway, Oct. 1995. 3Blandino, J., Cassady, R., and Sankovic, J., “PropulsionRequirementsandOptions for the 1, 34th Joint Propulsion New Millennium Interferometer (DS-3) Mission”, AIAA 98-333 Conference,, Cleveland, OH, July 13 - 15, 1998. 4Marre~e,C., Polk, J., Jensen, K., and Gallimore, A., TBD, This Issue .. ’Wolf, S. and Tauber, R., “Slllcon Processin9 for the W I Ern”, Vol. 1, Lattice Press, 1986. 60sburn, C.M. and Ormond, D.W., “Dielectric Breakdown in Silicon Dioxide Films on Silicon, Part I”, J.EZectrochem.Soc.,Vol. 1 19, No.5, pp.59 1-597, May 1972. ’Osburn, C.M. and Ormond, D.W., “Dielectric Breakdown in Silicon Dioxide Films on Silicon, Part II”, J.EZectrochem.Soc.,Vol. 1 19, No.5, pp. 597-603, May 1972. *Osburn, C.M. and Weitzman, E.J., “Electrical Conduction and Dielectric Breakdown in Silicon Dioxide Films on Silicon”,J.EZectrochem.Soc.,Vol.119, No.5, pp. 603 - 609, May 1972. ’Klein, N., “The Mechanism of Self-Healing Electrical Breakdown in MOS Structures”, IEEE Transactions on Electron Devices, Vol. ED-13, No.11, pp. 788-805, Nov. 1966. “Chou, N.J. and Eldridge, J.M., “Effects of Material and Processing Parameters on the Dielectric J.EZectrochem.Soc., Vol.117, No.10, pp.1287-1293, StrengthofThermallyGrownSiO,Films”, Oct. 1970. “Soden, J.M., ‘The Dielectric Strength of SiO, in a CMOS Transistor Structure”, Proc. 1979 Electrical OverstressElectrostatic Discharge Symposium, pp. 176- 182, Sept. 1979. Z.angew.Phys., ‘*Fritzsche,C., “Der dielektrische Durchschlag in Si0,-Schichten auf Silizium”, V01.24, No.1, pp.48-52, 1967. 24
‘3Worthing,F.L.,“D-CDielectricBreakdownofAmorphousSiliconDioxideFilms at Room Temperature”, J.Electrochem.Soc.,Vol. 1 15, No. 1, pp. 88-92, Jan. 1968. Lampert, M.A.,“ScanningElectronMicrographs of Self14Yang, D.Y., Johnson, W.C., and Quenched Breakdown Regions in Al-Si0,-( 100)Si Structures”,Appl. Phys.Lett, Vo1.25, No.3, Aug 1974. ”Pratt, I.H., “Thin-Film Dielectric Properties of RF Sputtered Oxides”, Solid State Technology, pp. 49-57, Dec. 1969. Thin Silicon Oxide Films”, 16Klein,N.and Gafni,H.,“TheMaximumDielectricStrengthof IEEE Transactions on Electron Devices, Vol. ED-13, No. 12, Feb. 1966. Li, W. , and Wallace, A., “Micro-FabricatedAcceleratorGridSystem 17Mueller,J.,Tang,W., FeasibilityAssessmentforMicro-Ion Engines”, IEPC 97-071Paper,25thInternationalElectric Propulsion Conference, Aug. 1997, Cleveland, OH. 18Spindt, C.,Pers.Com with C. Marrese, SRI and JPL, June 1998.
25
Table 1: Surface Breakdown Voltages and Field Strengths fo a 5 pm Gap using Oxide Undercut Oxide Undercut Breakdown Voltage strength (VI 600 600 900 900 1300
(5 pm Gap) Breakdown Field
W P I 120 120 180 180 260
No Oxide Undercut Breakdown Voltage Strength (VI 700 700 700 800 900 900 950
26
(5 pm Gap) Breakdown Field (V/p) . 140 140 140 160 180 180 190
Accel Grid (-)
Substrate Breakdown Breakdown
H
\ -
Screen Grid (+) InsulatorGrid
Aperture
Fig. 1: Anticipated Grid Breakdown Modes
si4
AI Contact Pad
Heater Coil
\ I
f
I
/
Si-Substrate
\
\
Doped Polysilicon
Fig. 2: Schematic of Substrate Breakdown Chip
I
Fig. 3: View of Substrate Breakdown Test-Chip
Fig. 4: Substrate Breakdown Test Set-up
Si-Substrate
Fig. 5: Schematic of Surface Breakdown Chip
Fig. 6: Experimental Set-up for Surface Breakdown
Breakdown Field Strength vs. OxideThickness LTO Oxide
0 0 0 0
0 0
0
0 0
0 0 0
0
0
0
0
200
-11 " " 1 " " 1 " " 1 " " 1 " " 1 ' " ' 1 " " 1 0.5
1 .o
1.5
2.0
2.5 3.5
3.0
4.0
Oxide Thickness (pm)
Fig.7: Electric Breakdown Field Strength vs. LTO Oxide Thickness
b 1400
Breakdown Field Strength vs. OxideThickness for Various Oxide Types
-
sdi Symbols am Averaged Values
Glsss.
0 Vapor-Deposited Oxide on Klein and Gafni I Thermal oxide,oskun and ormond A RF Sputter-Depcsited Oxide, Prall o CVD (LTO) Oxide. Thii Study
21200 1 r,
5 1000: 0 U.
4 Y
0
8
0 n
3
0
0
0
600
0
0
- E
m
0
?!
400
C C I""I
0
" " I " ~ ' I ' ' " l " " " I " ' ' ~ ~ ~ ~ '
1
2
Oxide Thickness (pm)
3
Fig. 8: Breakdown Field Strengths forVarious Oxides vs. Oxide Thickness
BreakdownVoltage vs. Oxide Thickness forVarious Oxides -
l o 6o o ~
> -
".
>
4
I
Solid Symbols are Averaged V a l w s 0
Vapor-0- on Glass, Klein and Gafni ThermelO~,O.krmandOrmond
A RF SpuHer Dopoated Oxide, Pratl 0 CVD (LTO) Oxide. Thin Study
'1
Fig. 9: Breakdown Voltages vs. Oxide Thicknessfor Various Oxides
1200-
Breakdown Field Strength vs. Temperature 1.0 pn LTOThickness Oxide
r,
P p!
t j 800
i~ 0
0 Q) if
0
600
3m
!? m 400
0 0 0
0
0
0
0
4
0
0
0
100
200
300
400
Temperature (C)
Fig. 10: Electric Breakdown Field Strengthvs. Temperature for 1 pn LTO Oxide
Fig. 1 1: Electric Breakdownat Aluminum Contact Pad Edge
Fig. 12: Side View of Breakdown shown inFig. 1 1
Fig. 13: Spectral (X-Ray Fluorescence) Analysisof Breakdown shown in Fig.1 1.
Fig. 14: Propagating Breakdown Pattern showing“Tree- shaped” Conductive Channel Formations
Fig. 15: Close-up of Initial Breakdown Location in Fig.14.
Fig. 16: Side-View of Initial Breakdown Area shown in Fig. 15
Fig. 17: Side-View of Conductive Channel Segment, located to the rightof Formation shown in Fig. 16.
Fig. 18: Example of Multiple Breakdown Locations forThin Oxides (1 pm).
Fig. 19: Close-up of Breakdown in Fig. 18.
Fig. 20: Multiple Breakdowns for1 pm Oxide. Note preferred Breakdown Locations on Aluminum Pad Edge and Comer.
Fig. 21 : Close up of Corner Breakdown and Neighboring Breakdownsof Fig. 20.
Fig. 22: Multiple Breakdowns for Chip featuring1.5 pm Oxide. Note Fewer Breakdowns and Start of Channel Formations.
-3 E
-
0
Surface Breakdown Electric Field Strengths vs. Gap Distance for Aluminum and Molybdenum Contact Pads
50
0 0
Aluminum ContactPads Molyddenum Contact Pads
2 CR
e 3 1 00
0 0 ii
5
D
e
50
m
0
100
200
300
400
500
600
Contact Pad Gap Distance Qlm)
Fig. 23: Surface Breakdown Electric Field Strengths for LTO Oxide using Aluminum and Molybdenum Contact Padsvs. Pad Gap Distance
Fig. 25: Photo of Attempt to Achieve Oxide Undercut of Molybdenum Pad
24001
Breakdown Voltage vs. Product of PressureandGapDistance loo
ConstantGapDiStanca Nuninurn contact Pads
2200 h
L
-0 2000 e
s
0
0 0
0
5 1800 0
s
0
m
1600
1200
v
4
5
6
7 8 9 ' I. i-i 7
2
3
Pressure'GapDistance
4
5
6
7 6 9 l
1 o-6
(pd) (Torr cm)
Fig. 26: Breakdown Voltagesfor Constant Gap Distance at Various Background Pressures
Fig. 27: Example of Stress-Induced Surface Delamination (approx.3 pn dia.) on Oxide.
Fig. 28: Example of Stress-Induced Surface Delamination(less than 1 pm dia.) on Oxide.
BreakdownFieldStrength
vs. Density of SurfaceDelaminations Pressure: 3x16' Torr
0
0
0 0
1000 2000 3000 4000 Avg. Density of SurfaceDelaminations(l/mm*)
Fig. 29: Breakdown Field Strengthvs. Surface Delamination Density
Fig.30: Example of Contact Pad Damage after Surface Arc Breakdown (Arcing Voltage was 2100 V, Gap 100pm)
Fig. 3 1 : Example of Contact Pad damage after Surface Arc Breakdown (Arcing Voltage was 3200 V, Gap 100 pm)
Fig.32: Close-up of Aluminum Pad Edge
Fig. 33: Post-Test Scan of Molybdenum Surface BreakdownChip