IEEE JOURNAL OF SELECTED TOPICS IN APPLIED EARTH OBSERVATIONS AND REMOTE SENSING, VOL. 5, NO. 6, DECEMBER 2012
1761
ICT Methodologies and Spatial Data Infrastructure for Air Quality Information Management Francesco D’Amore, Sergio Cinnirella, and Nicola Pirrone
Abstract—Applications for atmospheric pollution monitoring and modelling are fundamental tools to develop environmental policies oriented to control and possibly reduce the impact of pollution on ecosystems and human health. However, differences among monitoring systems and data availability are an important limitation in environmental management. In order to standardize protocols and procedures, the EU directives (e.g., INSPIRE, Air Quality Directive) and international programs (i.e., GEOSS) have oriented the community towards developing interoperable standardized systems that assure real time data analysis and dissemination. To coordinate national earth and cross-disciplinary systems for promoting GEOSS and to support the INSPIRE implementation, the GIIDA (Integrated and Interoperable Management of Environmental Data) project was launched. Within GIIDA the working group on air quality was instructed to develop an interoperable system for air quality information management. The system is based on open-source tools compliant with standards and designed to develop a Spatial Data Infrastructure (SDI), which will contain information collected at ground-based as well as at off-shore monitoring sites. This infrastructure aims to store, mine and visualize information. The SDI will support modelling activities and environmental assessments for different scenarios in order to evaluate the impact of atmospheric pollution ecosystems and human health. In this paper we discuss the application of the IT framework and methodologies for the SDI development, which was built on open-source components: Postgis for data storage, Geoserver to export services and GeoNetwork for metadata generation. Finally, we describe the ICT pluggable framework GeoInt, which was developed to simplify the SDI component’s complexity for end users by supporting data input from different sources, as well as metadata management. Index Terms—GEO, geografical web service, GeoICT, GEOSS, ICT, INSPIRE, spatial data infrastructure.
I. INTRODUCTION
H
UMAN health diseases caused by environmental pollution are a growing concern worldwide, and in recent years studies have linked the two at both regional and global Manuscript received September 2011; revised January 17, 2012; accepted February 23, 2012. Date of publication August 31, 2012; date of current version December 28, 2012. This work was supported by the GIIDA project (funded by CNR) and EGIDA project (funded by EC contract FP7-ENV-2010-265124). F. D’Amore is with the National Research Council of Italy, Institute of Atmospheric Pollution Research, 87036 Division of Rende (CS), Italy (corresponding author, e-mail:
[email protected]). S. Cinnirella is with the National Research Council of Italy, Institute of Atmospheric Pollution Research, 87036 Division of Rende (CS), Italy (e-mail:
[email protected]). N. Pirrone is with the National Research Council of Italy, Institute of Atmospheric Pollution Research, 87036 Division of Rende (CS), Italy (e-mail:
[email protected]) Color versions of one or more of the figures in this paper are available online at http://ieeexplore.ieee.org. Digital Object Identifier 10.1109/JSTARS.2012.2191393
levels [1], [2]. These studies also offer a better knowledge of the connection between exposure to pollution and its effect on health, as well as the long-term impacts of chemical substances on human health, biological organisms, and the environment. To this end, monitoring and modelling are crucial in identifying key environmental pressures, an environment’s overall condition or status, and the level of environmental quality being achieved by changes in lifestyle [3]. Inevitably, both monitoring and modelling are challenging—not only from a technical point of view, but also for the complexity of the problems being addressed. These problems often feature interactions along multiple parameters, at different organizational levels (anthropogenic or biological, individual or population) and along different scales (from global to local). From this perspective, both the integration and linkage of information are strategic important and strategic issues to be addressed in the near future, particularly when oriented toward health assessment. A number of such initiatives already exist, and these aim to link varying types of environmental data collected across a wide range of scopes. These include efforts from EEA (EIONET), WMO (IGACO), OECD (ECOSANTE), UNECE (EMEP), AC (AMAP), GEO (GEOSS) and the EU and ESA (GMES), and a wide array of past and ongoing research projects. These initiatives involve several monitoring networks, a wide range of observational platforms, and the use of techniques for data harmonization, interconnectivity and linkage. Integrated human and environmental health assessments, which require both routinely and by-project collected datasets combined in multiple ways, are not the main purpose of these monitoring networks. Nevertheless, their information integrated into technological systems could be useful for the assessments themselves. Identifying and investigating causal links between human health and pollution by using data and model simulations is an activity crucial for policy makers and public participation within any environmental decision-making process (as well as for a broad understanding of the environment). However, these data are not always available to the public and are not usually in a format that is understood by all the different stakeholders [4]. Also, monitoring systems show relevant discrepancies in terms of spatial and temporal trends, as they do not cover appropriate regions, they are discontinue along years and are often application-oriented. Spatial Data Infrastructures (SDIs) have been designed to address these issues. An SDI is a framework of policies, institutional arrangements, technologies, data and people that enables the sharing and effective usage of geographic information [6]. For example, the Canadian Geospatial Data Infrastructure (CGDI)
1939-1404/$31.00 © 2012 IEEE
1762
IEEE JOURNAL OF SELECTED TOPICS IN APPLIED EARTH OBSERVATIONS AND REMOTE SENSING, VOL. 5, NO. 6, DECEMBER 2012
was implemented as an easy-to-use, advanced, online information resource for offering valuable benefits to decision-makers in four priority areas [7]: • public safety: to share maps of roads, bridges, electrical grids, water systems, buildings, etc., and to better plan for and respond to emergencies and disasters; • public health community: to share location-based information securely to track pandemics, analyze trends, and monitor population health; • local population community: to connect people and communities, map the future, and realize opportunities; and • environment and sustainable development: to better manage land and water, assess the environment, and monitor ecosystems. In order to overcome inconsistencies in spatial data collection, the EU adopted the INSPIRE Directive, a directive that was developed to enable effective data sharing both locally and across borders [8]. INSPIRE addressed a number of issues including lack of documentation, incompatibility of spatial data sets, barriers to share and re-use of existing spatial data, and incompatibility of geographic information initiatives. The overall objective of INSPIRE was to make quality, harmonized, spatial information readily available to support environmental policies and or activities which may have a direct or indirect impact on the environment in Europe. Hence, INSPIRE lays down general rules for the establishment of an SDI in Europe based on infrastructures for spatial information established and operated by the member states. The component elements of those infrastructures include: metadata; key spatial data themes and spatial data services; network services and technologies; agreements on sharing, access and use; co-ordination and monitoring mechanisms; and process and procedures. In addition, the Group on Earth Observations (GEO) launched a program to coordinate efforts to build a Global Earth Observation System of Systems (GEOSS) designed to assist in a broad range of areas including human health, biodiversity loss throughout resource management, climate prediction, weather forecasting, and ecosystems protection. GEO provided a web-based interface (the GEO Portal) for searching and accessing data, information, imagery, services and applications that were available through the GEOSS [10]. At the country level, some Italian regions have built SDIs, with differring platforms, costs and data (e.g., Lombardia, Sardegna, Piemonte) or are in the process of developing projects concerning spatial data and integrated information services (Abruzzo, Puglia, Calabria, Sicilia, Molise, Sardegna, Campania). In addition, the Department of Civil Protection and the Department of Environment of the Italian Environment Ministry each have portals oriented toward risk prediction/mitigation and collection of a vast Remote Sensing Plan for multispectral data. Also, the “Comando dei Carabinieri per la Tutela dell’Ambiente” (the Environmental Protection Command for the Carabinieri) has created an on-going important project for controlling environmental crime, utilizing a wide collection of spatial data, including many hyperspectral coverages. Finally, the “Direzione Generale per i Porti ” (the Directorate for Ports of the Italian Ministry for Transportations
and Infrastructures) has rebuilt and updated cadastral maps of the Italian coast. Thus, while spatial datasets are a basic part of public administration information systems and the aforementioned infrastructures and projects are within the mission of public administrations, they hardly ever attempt to create an SDI. Most of them use standards for interoperable data and network services and often have a web geo-portal, but currently there is no a uniform approach that covers all of Italy [11]. Moreover, neither research enterprises nor universities have SDIs or interoperable systems, despite having huge amounts of environmental information. To coordinate national earth and cross-disciplinary systems for promoting GEOSS and to support INSPIRE implementation, the Italian National Research Council (CNR) promoted the GIIDA project (Integrated and Interoperable Management of Environmental Data) [12]. GIIDA was aimed “to implement the Spatial Information Infrastructure (SII) of the CNR for Environmental and Earth Observation data”, and it also was intended to design and develop a multidisciplinary cyber-infrastructure for the management, processing and evaluation of Earth and environmental data. The output of GIIDA is a complex framework, and hopefully this infrastructure will lead to a greater Italian presence in international projects and initiatives that are similar to INSPIRE, GMES, GEOSS and SEIS. GIIDA covers seven main thematic areas/domains: Biodiversity, Changes in Climate, Air Quality, Soil and Water Quality, Risks, Infrastructures for Research and Public Administrations, Sea and Marine resources. This corresponds with the main research areas of the National Research Council of Italy (CNR). CNR-Institute of Atmospheric Pollution Research (CNR-IIA) leads the Working Group on Air Quality that developed i) a specific Web Portal; ii) a thematic catalog service; iii) a thematic thesaurus service; iv) a thematic Wiki; v) standard access and view services for thematic resources – such as: datasets, models, and processing services; and vi) a couple of significant use scenarios. This paper describes the implementation of the SDI on air quality as an output of the GIIDA project, focusing on the Information Communication Technology (ICT) framework GeoInt, which was developed to manage the SDI and which integrates software components to provide a unique entry point for final users. II. THE SDI’S ROLE IN AIR QUALITY INFORMATION MANAGEMENTPAPER SUBMISSION The goal of air quality information management is to protect and enhance air quality to preserve human health and ecosystems [15]. To accomplish the goal, several regulations and standards have been established, and these have utilized a broad suite of management tools and monitoring networks to track progress (e.g., AERONET, EMEP, GAW, GMOS). All of these components depend on robust and up-to-date scientific and technical inputs, which include the most advanced knowledge of relationships between air pollutant levels and their impacts on human health, ecosystems, atmosphere composition, and cultural heritage sites. At this level an SDI is not only a repository, but an intermediary mechanism that provides raw data for science, management, and policy.
D’AMORE et al.: ICT METHODOLOGIES AND SPATIAL DATA INFRASTRUCTURE FOR AIR QUALITY INFORMATION MANAGEMENT
An SDI oriented to air quality information management is a framework that should collect air quality information at both dataset and metadata levels, store it in a database, and make it accessible through a web-interface. The SDI can also integrate a component that connects external and heterogeneous databases, enabling access to a single user-friendly web interface that makes both appear as one, virtual database to the end-user. Therefore, external databases can be exported as a single data warehouse by using a data catalog component, making these databases available within the SDI. By incorporating this component, user’s requests can be forwarded to appropriate dataset(s). Results of such a query can then be downloaded from a central server or emailed to the customer. Large collections of air quality observation and simulation data can be made available through the cooperation of as many data centres as required, and the physical location of these datasets becomes irrelevant. The only real problem to be overcome is the differing data policies established by data owners, but even this problem is changing as new approaches to public access regarded environmental information are adopted (e.g., the European Directive 2003/4/EC). A. ICT Methodologies to Construct the SDI In an SDI, additional ICT tools and frameworks are more often required. These tools manage Web Sensors, Data Notification, Processing, and complex data Visualization. Furthermore, an SDI may manage a huge amount of data and processes like atmospheric chemical models that are coupled with meteorological models, for which the integration of a complex computational framework is required. The importance of integration between different tools is also supported by the Open Geographic Consortium (OGC), which released standards like Sensor Web Enablement [13] or Web Processing Services [14] in order to integrate results coming from different processes. The integration of such technologies requires a different approach in developing an SDI, for example by using ICT methodologies often adopted in e-business. This flexible Information Infrastructure solves integration issues among SDI components by hiding the complexity of geographic systems to final users [16], who are often scientists or decision makers but often not IT experts. Moreover, they cannot always rely on having access to the full-time technical staff that is administrating these complex IT infrastructures, and hence, using an SDI allows them to remain focused on their area of expertise. B. Type of Data to be Handled in the SDI The SDI can handle information on air quality that is diverse yet unique to any particular project. In this case, the included data ranged from concentration of contaminants emitted into the atmosphere (or released to water and/or soil), to concentration of contaminants measured at permanent sites (as well as along dedicated monitoring campaigns). These meteorological parameters are the input for transport models aimed to draw chemical weather. Outputs from models can be included in the SDI, and hence they can be used by policymakers to evaluate mid and long-term scenarios.
1763
III. THE SDI ARCHITECTURE AND IMPLEMENTATION With the above parameters in mind, we developed and implemented an SDI as the cornerstone of a project with an integrated architecture, so that additional components could be plugged in as necessary [20]. Open-source components were used in building the Air Quality SDI. Postgis, Geoserver and Geonetwork were utilized for geographic data storage, export geographic web services, and managing metadata, respectively, whereas Javascript libraries embedded in OpenLayers [27] were used to display geographic information. These tools effectively made the SDI a pluggable system (a system built through components plugged together), and required additional effort to integrate the different components. To this end, both an effective client application and a flexible software middleware were fundamental in crafting a common interface for the components involved in the SDI. Services and processes provided are now controlled through an Information Infrastructure (GeoInt), designed and developed at CNR-IIA, which wraps most useful processes in order to provide high-level services (e.g., data integration and management) to final users. GeoInt, described in Section IV, acts as middleware between users and the SDI in order to provide a more friendly interface to the data and processes managed by the Air Quality SDI. The architecture of the Air Quality SDI was designed to provide geographic services for integration into a Service Oriented Architecture (SOA) like GIIDA and GEOSS. SOA is now the primary orientation for development within the environmental sector. Hereafter, the SDI Architecture is described through different viewpoints by using the terminology of the Reference Model of Open Distributed Processing (RM-ODP) (ITU-T Rec. X.901-X.904 ISO/IEC 10746) [16]–[28]. RM-ODP is a model used to describe complex ICT systems. The following RM-ODP viewpoints have been considered: • Enterprise; • Information; • Computational; • Engineering; • Technology. A. Enterprise Viewpoint The enterprise viewpoint focuses on the purpose, scope, and policies of a system. It provides the context and the overall environment within which the system will be built, and therefore indicates constraints and obligations that must be applied to all other viewpoints, therefore representing the global requirements that the SDI must respect. Through the Enterprise Viewpoint, the SDI quality is described from a stakeholder’s point of view. 1) Actor and Users: From the perspective of an end-user, an SDI should both organize information and resources and distribute them by providing their services via a single access point, often online. Resources managed by an SDI should be geo-portals or catalogs of geographic Web Services oriented to users. In both cases the end-user should find resources through the access point by searching metadata. Users accessing an SDI can be human operators or they can be Service Clients, namely Web Service Clients. With human operators, the SDI is used by data readers or data and metadata
1764
IEEE JOURNAL OF SELECTED TOPICS IN APPLIED EARTH OBSERVATIONS AND REMOTE SENSING, VOL. 5, NO. 6, DECEMBER 2012
creators. In order to match requirements for this user category it is important to create tools to search geographic data (necessarily based on metadata), allowing for detection based on keywords and geographic location. In summary, three types of clients have been considered for the Air Quality SDI: • Web based, oriented to specific products and projects related to the air quality theme or dedicated to decision makers in public organizations. • Desktop GIS, oriented to researchers, operators and data providers. • Web Service, compliant with a standard and designed for system integration and interoperability. 2) Functional Requirements: In air quality information management data are the cornerstone for simulation models and decision-making systems. They are both widely distributed and heterogeneous, and so they are difficult to access in a coordinated way. The first step in making systems truly interoperable is to adopt agreed standards for data storage, searching and distribution. Metadata will also enable the community to get information on the data within the SDI. The second step is to produce data in a commonly recognized format. Hence, data storage can be virtual or even on a physical device, but it must be re-engineered and harmonized in order for more services to be produced from it. In many organizations, environmental information is based on proprietary formats and stored in local computers without any kind of metadata. This information must be harmonized in order to foster multidisciplinary approaches and advanced analysis. An essential requirement of any SDI is a database that holds harmonized data and related metadata. From the user’s point of view, creating metadata can be a tedious task, and the management of large XML files with verbose descriptions may discourage some operators. Organizations that manage large datasets need some tools that assist with the creation of metadata and its storage in a database. An additional point that discourages operators is the necessity of following standards that are often updated or changed. Metadata stored in the database will be used to search data. After this initial phase, visualization is the next critical requirement and visualized products should differ as a result of a different use of data. Here, metadata must indicate the access point related to data use. For example, web-based systems are browsed by end-users by means of geo-portals, in which geographic data are used to create high-level services in specific projects. These geo-portals are related to particular areas of interest, such as the monitoring of ozone precursor emissions from facilities, or simply viewing a list of information layers contained in the SDI. Therefore, web-based systems are the preferred tools for realizing information systems that reach a wide range of users. Users need to interact with an SDI in all phases of data management: data and metadata creation, process management, data access, data searching, and, finally, visualization. To these ends, many tools have been developed that show data in a user-friendly way (e.g., Openlayers). Still, an additional Information Infrastructure that hides the complexity of the SDI and
helps the data provider can be useful. Middleware, like GeoInt, help users add data and metadata without any direct interaction with the complex interface of the SDI. 3) Non-Functional Requirements: In order to match new requirements that arise from new and changing scenarios in e-Science and geomatic (Sensor integration, 3D supports…), the SDI has crafted a modular approach, where each component implements a single feature and then talks with the others in order to perform the required services. With this approach a change in a functional component has a minimal impact on the system as a whole, because components are only loosely coupled. This architectural design allows for an easier system upgrade, and it adds scalability as new modules can be added to balance the load. 4) Integration Constraints: Interoperability and systems integration have become important in geographic systems, and SOA architectures have become popular even in geo-system areas. The Air Quality SDI was created with the higher level GIIDA domain in mind. The integration of the Air Quality SDI with GIIDA occurs primarily through the use of the OGC CS-W protocol, a protocol that allows for the ability to publish collections of metadata, geospatial data, and services and related resources. Thus, it is an integration based on the common use of metadata standards according to the INSPIRE directive. Interoperability enables data harmonization by linking more systems in a complex and robust distributed system, like in GIIDA or GEOSS. B. Information Viewpoint The information viewpoint is focused on the information semantics and information processing that is performed. It describes the information managed by the system and the structure and type of content of the supporting data. It then describes the system in terms of data managed. 1) Data Analysis and State of the Art: Data analysis and infrastructure state of the art are crucial in understanding which kind of SDI to create. In the case of the CNR-IIA’s project, data are related to contaminants holding geographical information (i.e., latitude, longitude, elevation, depth, chemical concentration), which are gathered from monitoring systems and numerical simulations running on parallel computing clusters or existing datasets. Measurements, simulations and datasets must be integrated into the SDI by considering working methodologies. For example, some data have been collected in geographical containers (e.g., ESRI® Shapefile). Data coming for past work represent essential background information for the planning and implementation of the Air Quality SDI. GeoInt wraps any data source and provides an interface for final users in order to upload data and metadata in SDI databases. Data Sources can be managed by user (data file) or automatically managed in the data acquisition processes. To this end, it is strategic to provide integration between hardware and software components within the SDI, to minimize human actions in the data acquisition. This kind of integration is possible only with a flexible software middleware, integrated directly into the SDI, where any source can be wrapped with a specific Software Layer.
D’AMORE et al.: ICT METHODOLOGIES AND SPATIAL DATA INFRASTRUCTURE FOR AIR QUALITY INFORMATION MANAGEMENT
2) Metadata: The Knowledge Description: Description of data stored in an SDI is as fundamental as the data themselves. Storing and organizing data requires it to be contextualized in order to give information on any collection methodology, lineage, spatial and temporal domain, copyright, context of use, etc. Such documentation is called metadata. Metadata helps to organize and maintain data in order to: • provide information on an organization’s data hold in a catalogue form; • avoid duplication of efforts by ensuring the organization is aware of the existence of data sets; • help users to locate all available geospatial and associated data relevant to an area of interest; • build upon and enhances the data management procedures of the geospatial community; • promote the availability of geospatial data beyond the traditional geospatial community; • advertise and promote the availability of their data and potentially link them to on-line services [6]. 3) Thesaurus Integration: The Air Quality SDI was constructed with a thesaurus developed at CNR-IIA [18]. Indexing and searching by thesaurus to provide access to geo-information resources is still a quality issue in the Internet world. Nothing can be more frustrating than searching by subject when no indexing strategy is present: each searching session has to face all the uncertainties of natural language (synonymy, polysemy, homonymy) combined with all the uncertainties of a full text search (no relevance control on the retrieved occurrences). Moreover, most people realize that an indexing strategy itself is not enough, especially when we have to face either broad classification systems or indexing by using natural language. With regard to broad classification systems, navigation in wide virtual ’containers’ is often a time-wasting operation; whereas in natural language indexing synonyms, polysemes, or homonyms limit and/or delay efficient and effective information retrieval. These problems grow exponentially when large numbers of documents and multilingual contexts are involved. Adopting a thesaurus: i) guarantees the effective control of the indexing language, covering each selected concept with a preferred term (in each language, in the case of multilingual thesauri) and ensuring inter-language equivalence among these descriptors; ii) provides a systematic display of the descriptors, making navigation through the terminology easier; iii) allows indexing and searching by combining several descriptors ex post, in order to refine and personalize both the semantic description and the information retrieval. In this way, adopting a thesaurus creates results that balance the number of retrieved documents with their relevance. This was the reason behind the implementation of EARTh [18], a thesaurus oriented towards environmental issues that included a specific section for GIS terminology. C. Computational Viewpoint The Air The computational viewpoint enables distribution through functional system decomposition into objects that interact by interface. It describes the architecture of an SDI by means of its components. This SDI has a classical three-layer
1765
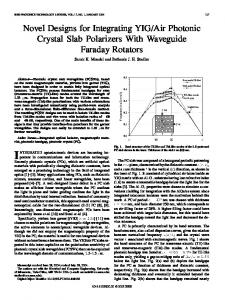
Fig. 1. SDI Architecture showing the Data Storage Layer (DSL), the Business Logic Layer (BLL) and the Application Layer.
architecture (shown in Fig. 1) with a Data Storage Layer (DSL) connected to a Business Logic Layer (BLL), hosted in a Tomcat Server that is linked to the Application Layer (AL). The core of the system is represented by the DBMS, which holds vector information and functional data. The DBMS represents the DSL in the SDI architecture, and stores metadata and geographic data in separate databases to maintain a different logic structure for each type of data. Additional databases are dedicated to functional tasks and to information coming from web sensors. In detail, the following databases are contained in the DSL: • g_container: used to store geographic information; • g_metadata: used by GeoNetwork for metadata stored in g_container; • geoint: used by GeoInt to perform functional tasks; • sos_database: which contains data coming from web sensors. The latter was a database designed by 52North [22] in order to match Sensor Web Enablement (SWE) specifications, which is connected to 52north SOS components deployed in the BLL, and is used to export sensor information. In the BLL, server components are plugged in to perform the system functionalities like metadata management, data and map creation, and data dissemination. The components related to this layer are: • GeoInt: the data producer and Information Infrastructure, oriented to the Geo Infrastructure; • GeoServer: the map server; • Geonetwork: the metadata manager and catalog; • EARTh: the Thesaurus used by the metadata editor. • GiCat: the Service Broker. [19] The AL represents a set of tools oriented towards final users. This container holds Desktop GISs, Web GISs, Metadata viewers and data downloaders. Each component is described in more detail in the Engineering Viewpoint, within Section III.D.
1766
IEEE JOURNAL OF SELECTED TOPICS IN APPLIED EARTH OBSERVATIONS AND REMOTE SENSING, VOL. 5, NO. 6, DECEMBER 2012
Fig. 2. GeoInt Components Overview.
Fig. 3. Façade and DAO in GeoInt.
D. Engineering Viewpoint The engineering viewpoint focuses on interactions between the distributed components of the system. Each component installed in the BLL and AL is described hereafter. The communication channel between components is realized through web links and REpresentational State Transfer services (REST) [21]. Until now, only the Thesaurus has been physically installed in GeoNetwork as the Simple Knowledge Organization System (SKOS) services has not been implemented. GeoInt (http://sdi.iia.cnr.it/geoint/) is the Information Infrastructure developed at CNR-IIA that wraps the SDI in order to provide facilities related to data and metadata creation and harmonization to the final-user. With GeoInt, users can work with a set of tools that make using the SDI components easier, particularly with regard to data and metadata creation, sensors integra-
tion and process management. This tool allows users to create metadata that is compliant with European and international standards, like those detailed in the ISO 19139 and the INSPIRE Directive. Geoserver (http://sdi.iia.cnr.it/geoserver) is a map server that exports data by creating Geographic Web Services, compliant with OGC (WMS, WFS, WCS). These services can be used directly by end-users in complex SOA systems or geo-portals built with Web technologies. OGC services are also used by Geonetwork to integrate metadata with maps and other geographic data. Geonetwork (http://sdi.iia.cnr.it/geonetwork) is a tool used to manage metadata. The metadata are exported via the CS-W 2.0.2 protocol, which is the basis for integrating the Air Quality SDI into complex systems. The tool allows links with Geographical Services such as WMS and correlation with different, even non-structured, data sources.
D’AMORE et al.: ICT METHODOLOGIES AND SPATIAL DATA INFRASTRUCTURE FOR AIR QUALITY INFORMATION MANAGEMENT
1767
Fig. 4. GeoInt. Select a DataSource.
EARTh (http://ekolab.iia.cnr.it/earth.htm) is the Thesaurus linked within Geonetwork in order to support the metadata editing process. GiCat (http://sdi.iia.cnr.it/gicat) [19] is a Service Broker used as a collector for Geographic Web Services. It supports several protocols like WMS, WFS, THREDDS, CS-W and accepts a wide variety of inputs, extracts information, and exports that information in a standardized protocol like CS-W. It is linked directly with Geonetwork to export metadata and to integrate the Air Quality SDI into a more complex System of Systems like those constructed within GIIDA or GEOSS. GiCat is a Service Broker developed at the ESSI-Lab (http://essi-lab.eu). Some WebGISs (http://www.webgis.iia.cnr.it) were developed using services generated by Geoserver and are released to end-users by means of a geo-portal, where geographic data are used to create high-level services in specific projects related to particular areas of interest. The web-based systems are therefore ideal tools to realize information systems that reach a wide range of users. E. Technology Viewpoint The Technology Viewpoint is focused on the system’s technology selection. It describes the technologies selected to provide processing, functionality and presentation of information. It examines products available in the marketplace that are used to build the SDI.
The SDI is based on the adoption of international standards. These are mainly OGC for data representation, and ISO19115 and INSPIRE, for metadata creation. Moreover, standards like WMS 1.1.1 and WFS 1.1.0 were adopted for data, and CS-W 2.0.2 was adopted for metadata dissemination through Geonetwork and GiCAT. As outlined in the ISO 19139 standard, metadata are presented in an XML document. ISO 19139 defines Geographic MetaData XML (gmd) encoding, an XML Schema implementation derived from ISO 19115. XML is a mark-up language, widely used in ICT systems, aimed to describe any type of information regardless of the means by which this information will be used or transmitted. Geonetwork acts as a component plugged into the Air Quality SDI architecture, so that metadata can be managed at all levels (metadata creation, storage, and management) and exported through OGC CS-W, the standard protocol used to describe it. Data served by the SDI are often used in WebGISs. In order to develop such applications, javascript frameworks were used. In our case we adopted Openlayers, which allowed us to develop applications with AJAX support. Openlayers is a very effective tool that can establish a connection directly to WMS services in order to develop effective, easy-to-use applications. These methodologies currently represent the most-used technique in the area of open-source WebGIS products and they offer excellent results. However, new methodologies for cre-
1768
IEEE JOURNAL OF SELECTED TOPICS IN APPLIED EARTH OBSERVATIONS AND REMOTE SENSING, VOL. 5, NO. 6, DECEMBER 2012
Fig. 5. Service Creation with GeoInt.
ating Web-based applications are available in the marketplace that can overcome a development approach based on Javascript.
IV. GEOINT GeoInt is the Information Infrastructure that was developed at CNR-IIA to provide data creation and harmonization. The architecture in Fig. 2 shows interactions between the database, OGC services exported via Geoserver, and final users. GeoInt is an Enterprise Application, developed with Java and deployed in a Serverlet Container (Tomcat). The scope of this framework provides an infrastructure that centralizes data persistence, processes, services creation, processes control over geographic information, and geographic data storage management. It provides an AJAX web user interface in order to access features provided by the framework. The web interface of GeoInt was developed with ZK [25] in order to improve user friendliness and usability. ZK enables a declarative approach for web application and it can be very useful in order to develop complex web systems oriented towards data visualization. ZK is a Web Framework that allows for developing an AJAX interface without the direct use of Javascript. Fig. 4 shows a screenshot of GeoInt during the selection of a DataSource. In the following section we describe each component used in building GeoInt.
A. Geoint Data Storage Management As we described above, geographic data are stored in a Postgis database (see Section III). This database is managed through GeoInt by means of Data Access Objects (DAOs). DAOs are patterns used in Software Engineering to decouple storage systems from software layers. In our case, there are DAOs objects that manage any given instance of data storage. The DAO interface designed in GeoInt is the GContainerDAO. Few methods of the DAO interface are listed in the UML Class Diagram in Fig. 3. GContainerDAO exports the CRUD (Create, Retrieve, Upload, Delete) operation on geographic objects stored in a vectorial storage device. DAO for raster data are in the development phase. In the next version of GeoInt, DAO interfaces for raster will be tested and deployed. GeoInt, without a DAO for raster, cannot handle this data directly. To date, raster data are stored in the File System and handled by Geoserver. In the case of vectorial data, Postgis is the de facto opensource standard for geographical DBMS. By using DAOs in GeoInt, we allow for the possibility of a switch from Postgis to a different storage system. In GeoInt, each vectorial data storage system can be activated by the implementation of a corresponding GContainerDAO. A user/developer that wants to enable a different storage strategy must provide the specific implementation of GContainerDAO to obtain any selected strategy.
D’AMORE et al.: ICT METHODOLOGIES AND SPATIAL DATA INFRASTRUCTURE FOR AIR QUALITY INFORMATION MANAGEMENT
1769
Fig. 6. Integration of the Air Quality SDI within GIIDA domain.
In addition, in GeoInt a specific DAO is used to perform user management and functional tasks, namely GeoIntDAO. GeoIntDAO defines a set of methods for user-notification, user’s roles, credentials on datasets and other functional tasks. The design of the DAO system is described using UML (Fig. 3). In each instance, the Postgis database, which is used and managed by GeoInt, is wrapped by an instance of PostgisContainerDAOImpl that implements the GContainerDAO in order to plug different Postgis Databases into GeoInt. Developers with different user requirements will provide specific implementations of GContainerDAO, such as OracleContainerDAOImpl, MySqlContainerDAOImpl, and others, depending on the storage devices being used. The GContainerDAO and GeoIntDAO are collected in a Façade. Often used in Software Engineering, The Façade pattern is a very useful strategy for offering a direct interface into a complex system. In this case, components in the second layer of Fig. 2 can manage any object by means of the method provided by the Façade. This approach demonstrates a more robust Software Architecture and a more flexible use of the underlying resources. For example, to switch from one Postgis database to another, a user must provide the Façade with the appropriate instance of PostgisContainerDAOImpl, even at run time. This is possible through the GeoInt web interface (Fig. 4), once the current user has the appropriate credentials to use the selected database. The Business Logic Component and other Software Layers that use the Façade can use the method without gaining awareness of the type and location of the new data storage. Furthermore, the Façade is used by components hosted in the higher-level layer of the GeoInt architecture, in order to manage different data sources. Spring [23] is used as IoC framework in GeoInt. IoC is a pattern that enables a flexible setup of complex enterprise
applications, which are used as Application Context in order to setup any component (and the relationship between components). Spring is used to manage not only DAO components, but also Connections Pools (C3PO), JDBC Data Sources, Logging components (Log4j), and services like mail systems and application utilities. All components are linked together by means of the Spring framework, at startup in GeoInt.
B. OGC Service Creation With GeoInt: Geoserver Integration Fig. 2 shows the Architecture wherein there is a layer that contains the business logic to perform data process and services. This layer, where appropriate, is stored and by the Façade. This BLL can also contain services used to integrate GeoInt with additional software components. The communication component between GeoInt and Geoserver is fundamental to exporting data stored in the geographic databases through OGC Web Services (OWS). For this we used the RESTfull endpoint provided by Geoserver, which helps to manage the map server thereby making it possible to add a new WMS/WFS service programmatically by means of a RESTfull operation. A UML sequence diagram showing the process is reported in Fig. 5. Through GeoInt, users can select a Geodatabase and finally a georesource. They can create a OWS Service by means of GeoInt, which will send a command to Geoserver and get a return end point of the service created. This end point is managed directly by GeoInt. This simple scenario shows how GeoInt can hide the complexity of resource management to the final users of an SDI, as GeoInt can manage the creation of a resource and the creation of Geo Services compliant with OGC standards through a single interface.
1770
IEEE JOURNAL OF SELECTED TOPICS IN APPLIED EARTH OBSERVATIONS AND REMOTE SENSING, VOL. 5, NO. 6, DECEMBER 2012
V. SYSTEM INTEGRATION The Air Quality SDI is federated in the GIIDA domain that acts as System of Systems (SoS). The Air Quality SDI, like all GIIDA SDIs, exports information by means of CS-W protocol or other standard protocols by means of a brokering catalog, namely GiCat. The central node of GIIDA acts as a Brokering Service by utilizing GiCat. Data coming from different partners are then collected and processed in the central node. This Brokering Service allows final users to exploit data and services provided by multiple nodes as if they were coming from a unique data source. Therefore, the top-level GIIDA domain offers integrated services to end users or to a more complex SoS (E.g. GEOSS), as if it were a collection of data owned by GIIDA partners. Fig. 6 shows the integration schema adopted by the Air Quality SDI within the GIIDA framework. Concurrent partners of GIIDA can implement different SDI architectures, but all of them interact with the central node by means of well-known data protocols managed by a GiCat instance installed in the central node. This service interface standardization enables the decoupling of the SDI implementation from the external world: the local architecture can be modified in some component without affecting interaction with final users. To this end, final users do not see internal changes and their approach to the SDI remains unaffected in terms of complexity. This allows for a high level of flexibility, which is essential when the SDI must be integrated into the SoS. VI. CONCLUSION When developing tools and scenarios for air quality information management, some of the most limiting factors are discrepancies among monitoring systems, particularly in terms of spatial and temporal differences and data availability. Fostered by European directives (e.g., INSPIRE, Air Quality Directive) and international programs (i.e., GEOSS) that have pushed the scientific community toward developing advanced interoperable systems, CNR-IIA developed a framework based on opensource tools compliant with standards and oriented towards developing an integrated system that facilitates data management. These interoperable systems can be helpful in assuring real time data analysis and dissemination within the scientific community, as well as offering the information to other stakeholders and policymakers. This paper suggests a solution to design and implement a complex Spatial Data Infrastructure based on open-source components. It describes the development of an Information Infrastructure to provide end-users with a friendly interface for data creation and harmonization. This tool manages the SDI through DAOs and enables service-creation through RESTfull endpoints. The Air Quality SDI holds information on concentration of contaminants measured at permanent sites, as well as in dedicated monitoring campaigns. It also incorporates meteorological parameters and outputs of meteorological models. The tools developed de-couple storage systems from the software layers, helping to manage both vector and raster information, though the latter is still under development and will be provided in the next GeoInt version.
This SDI can support both modelling activities and environmental assessments for different case studies that aim to evaluate the impact of atmospheric pollution on terrestrial and aquatic ecosystems, and on human health. Additional work will focus on improving GeoInt processes and data management. In the SDI described in Fig. 1, metadata are still managed by Geonetwork. Developers are currently working to define procedures that permit it to manage metadata through the GeoInt Web Interface. GeoInt will then be able to export an ISO19139 document by means of CS-W 2.0.2 without any interaction with Geonetwork. This will allow us to remove a complex component from the SDI (and it will address a related issue regarding upgrading and maintenance). Additional areas of focus include improving raster data (as described in Section IV.A) and implementing changes in Geoserver (where in the next version of GeoInt, the existing software will be able to manage multiple Geoservers ). REFERENCES [1] K. Katsouyanni, D. Zmirou, C. Spix, J. Sunyer, J. P. Schouten, A. Ponka, H. R. Anderson, Y. L. Moullec, B. Wojtyniak, and M. A. Vigotti, “Short-term effects of air pollution on health: A European approach using epidemiological time-series data,” The APHEA Protocol. J. Epidemiol. Community Health, vol. 50, no. 1, pp. S12–S18, Apr. 1996. [2] A. Seaton, D. Godden, W. MacNee, and K. Donaldson, “Particulate air pollution and acute health effects,” Lancet, vol. 345, pp. 176–178, 1995. [3] J. Roca, E. Padilla, M. Farré, and V. Galletto, “Economic growth and atmospheric pollution in Spain: Discussing the environmental Kuznets curve hypothesis,” Ecological Economics, vol. 39, pp. 85–99, 2001. [4] O. Gunther, “Environmental information systems,” ACM SIGMOD Record, vol. 26, no. 1, Mar. 1997. [5] C. Gouveia, A. Fonseca, A. Câmara, and F. Ferreira, “Promoting the use of environmental data collected by concerned citizens through information and communication technologies,” Journal of Environmental Management, vol. 71, no. 2, pp. 135–54, Jun. 2004. [6] D. D. Nebert, GSDI.Developing Spatial Data Infrastructures: The SDI Cookbook Technical Working Group Chair, 2004. [7] CGDI.Canadian Geospatial Data Infrastructure, , 2009 [Online]. Available: http://www.geoconnections.org/en/aboutcgdi.html [8] EC. Directive 2007/2/EC Establishing an Infrastructure for Spatial Information in the European Community (INSPIRE), , 2007 [Online]. Available: http://eur-lex.europa.eu/en/index.htm [9] EC,. Directive 2003/4/EC on Public Access to Environmental Information, , 2003 [Online]. Available: http://eur-lex.europa.eu/en/index.htm [10] GEOSS. The Global Earth Observation System of Systems (GEOSS) 10-Year Implementation Plan, , 2009 [Online]. Available: http://www. earthobservations.org [11] D. Vandenbroucke and P. Beusen, Spatial Data Infrastructures in Italy: State of Play 2007 K.U.LEUVEN RESEARCH & DEVELOPMENT, SPATIAL APPLICATIONS DIVISION, LEUVEN, 2007. [12] S. Nativi, “The GIIDA (Management of the CNR Environmental Data for Interoperability) project,” in EGU General Assembly 2009, Vienna, Austria, Apr. 19–24, 2009, 3425. [13] M. Botts, G. Percivall, C. Reed, and J. Davidson, “OGC sensor web enablement: Overview and high level architecture,” in OGC White Paper, 2007, pp. 07–165. [14] P. Schut and A. Whiteside, OpenGIS ® Web Processing Service 2005, OGC 05-007r4. [15] N. Pirrone and K. R. Mahaffey, “Where we stand on mercury pollution and its health effects on regional and global scales,” in Dynamics of Mercury Pollution on Regional and Global Scale, N. Pirrone and K. Mahaffey, Eds. Norwell, MA, USA: Springer Verlag Publischers, 2005, ch. 1, pp. 1–21. [16] Z. Nedović-Budić and N. R. Budhathoki, “Technological and institutional interdependences and SDI – The Bermuda Square?,” International Journal of Spatial Data Infrastructures Research, vol. 1, pp. 36–50, 2006.
D’AMORE et al.: ICT METHODOLOGIES AND SPATIAL DATA INFRASTRUCTURE FOR AIR QUALITY INFORMATION MANAGEMENT
[17] A. Naumenko, A. Wegmann, G. Genilloud, and W. F. Frank, J. Cordeiro and H. Kilov, Eds., “Proposal for a formal foundation of RM-ODP concepts,” in Proceedings of ICEIS 2001, WOODPECKER’2001, Setúbal, Portugal, Jul. 2001. [18] A. Naumenko, A. Wegmann, G. Genilloud, and W. F. Frank, J. Cordeiro and H. Kilov, Eds., “Proposal for a formal foundation of RM-ODP concepts,” in Proceedings of ICEIS 2001, WOODPECKER’2001, Setúbal, Portugal, Jul. 2001. [19] P. Plini and F. Mazzocchi, “EARTh environmental applications reference thesaurus,” in A Proposal for a New Environmental Thesaurus Model, UNEP Thesaurus/Terminology Workshop, Ginevra, 14-15-IV2004. [20] F. D’Amore, S. Cinnirella, and N. Pirrone, “Architecture solution for air quality management through a dedicated SDI,” Geophysical Research Abstracts, vol. 13, no. EGU2011-7113. [21] R. T. Fielding, “Architectural Styles and the Design of Network-Based Software Architectures,” PhD, University of California, Information and Computer Science, Irvine, 2000. [22] 52North. SOS Interface Implementation, , 2012 [Online]. Available: http://52north.org/communities/sensorweb/sos/index.html [23] SPRING. Application Development Framework for Enterprise Java, , 2012 [Online]. Available: http://www.springsource.org/ [24] SKOS, Common Data Model for Sharing and Linking Knowledge Organization Systems via the Semantic Web, , 2012 [Online]. Available: http://www.w3.org/TR/skos-reference/ [25] ZK. Web Framework, , 2012 [Online]. Available: http://www.zkoss. org/ [26] GWT. Web Framework, , 2012 [Online]. Available: http://code.google. com/webtoolkit/ [27] OL. Web Framework, , 2012 [Online]. Available: http://openlayers.org/ [28] RM-ODP. Recommendations and International Standards Defines Essential Concepts Necessary to Specify Open Distributed Processing Systems, , 2012 [Online]. Available: http://www.rm-odp.net/ Francesco D’Amore is research fellow at CNR-IIA Division of Rende (www. iia.cnr.it). He worked in several Software Houses on design and development of ICT Systems oriented to data and process management. His expertises are on GIS and SDI architectures, designing new approaches to develop of geographic systems. Dr. D’Amore works as Software Architect within GEO-Lab
1771
developing approaches and methodologies for the CNR-IIA Spatial Data Infrastructure and contributing to several national and international project, namely GIIDA, GMOS and EGIDA. Main fields of interest are: i) GIS and SDI Systems; ii) Data Mining; iii) Software Engineer and Distributed systems.
Sergio Cinnirella is research scientist at CNR-IIA Division of Rende (www. iia.cnr.it), with 20 years of experience being involved in several national and international projects (EUROCAT, MERCYMS, ELME) as leader of tasks related to GIS and database development, statistical analysis of environmental data, remote sensing techniques and assessment of environmental strategies for the implementation of European policies. He leads workpackages on EU funded projects, which are aimed to define a methodological approach to marine Directives implementation in the Mediterranean (KnowSeas, www.knowseas.com) and establish an interoperable system for a global mercury monitoring network (GMOS, www.gmos.eu). Dr. Cinnirella is responsible of the GEO-Lab oriented to develop methodologies and tools to link Science and Technology through user-friendly products. GEO-Lab maintains the institute’s Spatial Data Infrastructure (sdi.iia.cnr.it). Main field of interest are: i) assessment of global mercury emissions with specific reference to natural source emissions; ii) multi-disciplinary systems for pollution analyses; and iii) user-friendly tools for interoperable systems. He is peer reviewer for international scientific journals (e.g., ATMEN, ENVPOL, EMAS) and projects (FCT Portugal; FWF Austria; PRIN Italy. He has published over 115 articles in peer reviewed journals, proceedings of international conferences, books and technical reports.
Nicola Pirrone, is Director of the CNR-Institute of Atmospheric Pollution Research in Rome, Italy and Adjunct Professor at the University of Michigan. Dr. Pirrone is Chair of several WGs within international programs (i.e., UNEP F&T, GEO/GEOSS) and conventions (i.e., UNECE-LRTAP-EMEP, TF HTAP) and coordinated research projects funded by leading international funding agencies in Europe and abroad. He has published over 250 research articles in peer-reviewed literature, international proceedings and books on different aspects related to air pollution in urban and industrial areas, cycling of pollutants and their fate on regional and global scales, and environmental policy.