Article
Identifying Promising Research Frontiers of Pattern Recognition through Bibliometric Analysis Inchae Park and Byungun Yoon * Department of Industrial & Systems Engineering, School of Engineering, Dongguk University, 26, Pil-dong 3ga, Chung-gu, Seoul 100-715, Korea;
[email protected] *Correspondence:
[email protected]; Tel.: +82-2-2260-8659 Received: 6 October 2018; Accepted: 1 November 2018; Published: 5 November 2018
Abstract: This paper aims at proposing a quantitative methodology to identify promising research frontiers (RFs) based on bibliographic information of scientific papers and patents. To achieve this, core technological documents are identified by suggesting several indices which measure paper impact, research impact, patent novelty, impact, marketability, and the right range to evaluate technological documents and which measure the research capability of research organizations (ROs) such as a RO’s activity, productivity, market competitiveness, and publication impact. The RFs can be identified by clustering core technological documents, and promising indices of each RF which are from the perspectives of growth, impact, marketability, and science-based effect, are calculated to promising RFs. As an illustration, this paper selects the case of pattern recognition technology among various technologies in the information and communication technology sector. To validate the proposed method, emerging technologies on the hype cycle are utilized, allowing analysts to compare the results. Comparing the results derived from scientific papers and patents, the results from scientific papers are proper to suggest themes for research (R) in relatively long-term perspective, whereas the results from patents are appropriate for providing themes for development (D) in terms of relatively short-term view. This approach can assist research organizations and companies in devising a technology strategy for a future direction of research and development. Keywords: promising technology; research frontier; bibliometric analysis; hype cycle
1. Introduction As it is crucial to raise the competitiveness of scientific technology as a strategy for the future, the detection of promising technologies in an early stage is one of the most important challenges. If companies and countries cannot respond to rapidly changing technological trends in time and seize promising technological opportunities at an early stage, it is difficult for them to gain a competitive advantage in the market, and to lead technological innovation and social change. Thus, many developed countries recognize the importance of a promising technology discovery. Several research programs supporting the discovery of future technologies are conducted by Horizon 2020 of the European Union (EU), the Defense Advanced Research Projects Agency (DARPA) of the United States of America (US), and New Energy and Industrial Technology Development (NEDO) of Japan. In addition, many major companies and research institutes have attempted to explore promising technologies in diverse ways, in accordance with their own situations. Consequently, predicted promising technologies have been unveiled, such as the 10 breakthrough technologies from the Massachusetts Institute of Technology (MIT), the next 5 in 5 from International Business Machines Corporation (IBM), and the top 10 strategic technology trends from Gartner group. In the previous studies related to promising technologies, relevant terms such as promising, emerging technologies, research front, frontier and so on have been utilized interchangeably. Many Sustainability 2018, 10, 4055; doi:10.3390/su10114055
www.mdpi.com/journal/sustainability
Sustainability 2018, 10, 4055
2 of 33
studies for detecting emerging technologies took a qualitative approach such as relevance-tree, Delphi method, and questionnaire survey analysis, which are based on domain expertise. These expert-based approaches have the advantage of easy validation; however, they also have the disadvantages of being expensive and time-consuming [1,2]. In contrast, quantitative approaches, such as computer-based methods and bibliometrics, can provide a complementary approach to handle massive data for exploring promising technologies [3]. In particular, bibliometrics has been widely utilized as a powerful tool for monitoring research trends [4] or technological trajectories [5– 9] or analyzing technological changes [10,11] using various data, such as academic literature, patents, and other publications. Most of the previous studies on emerging technology using bibliometrics focused on the concept of fast growth among many perspectives on emerging technologies such as fast growth, radical novelty, prominent impact and so on. Moreover, the previous approaches also focused on the emerging research field using scientific publications and emerging technologies using patents, respectively. The background studies are summarized in Section 2. Under this theoretical background, two research propositions are suggested as follows: Proposition 1. Promising research frontiers (RFs) can be forecasted through a quantitative bibliometric approach using both scientific papers and patents by reflecting comprehensive views. Proposition 2. The predicted results using scientific papers and patents can be shown to be different because of their characteristics. This paper proposes a data-driven model designed to identify promising RFs with comprehensive perspectives, which are technological growth, marketability, and the science-based effect. Several metrics are developed in this model to measure the quality of the technological documents, to evaluate research organizations (ROs), and to identify promising RFs quantitatively. Furthermore, the Girvan and Newman clustering algorithm and modularity concept are utilized in the model for grouping technological documents to identify RFs with quantitative approaches. It enables us to overcome the limitation of selecting the appropriate number of clusters through a qualitative approach because the algorithm can recommend the proper number of clusters automatically in conjunction with the modularity. In terms of data sourcing and collection, scientific paper and patent data are collected as technological document data from the Web of Science (WoS) and the United States Patents and Trademark Office (USPTO) database, respectively. The results derived from the proposed model are compared to the results of hype cycle in order to confirm the Proposition 1, and the results derived from scientific papers and patents are compared to observe the difference between them in order to confirm Proposition 2. The Information and Communication Technology (ICT) industry has a complex and rapidly changing nature as technological convergence occurs and the technologies progress radically. ICT covers a wide spectrum of computing environments (e.g., laptop computers and smartphones) that carry out a broad range of communication and information functions. This connectivity is able to provide new opportunities that are changing the way that firms do business and transforming public service delivery. ICT has proven to be a key driver of economic growth through widespread diffusion of the Internet, mobile telephony, and broadband networks [12]. Due to this nature and environment of ICT, promising technology discovery is crucial in the ICT sector. Thus, the proposed methodology is applied to a pattern recognition technology field of the ICT sector because the pattern recognition technology area has experienced major growth due to the technological innovation of artificial intelligence and big data. The results applied to pattern recognition technology are well-matched to the hype cycle [13] using both scientific papers and patents. The main finding is that the results from scientific papers are proper for suggesting themes for research (R) in a relatively long-term perspective while the results from patents are appropriate for providing themes for development (D) in terms of a relatively short-term view. It is partially supported by an R&D linear model that explains the seeds of innovation created by a research lab at the science level and companies develop technologies and products at technology and industry level [14]. From the results and implications, this research
Sustainability 2018, 10, 4055
3 of 33
provides a brief guideline to differentiate the roles of scientific paper and patent data for strategic R&D planning by proposing priorities to utilize the proposed model in the discussion. This research contributes in several ways. First, from the perspective of data utilization, promising technology is suggested by utilizing both scientific articles and patents. It is able to provide implications to a research organization for technology planning. Second, from the perspective of methodology, several indices are proposed using bibliographic information in respective steps to evaluate technological documents and research capability of the research organization, and measure comprehensive views of promising property. Finally, from the perspective of the utilization of the results, the results are well matched to hype cycle and provide distinctive implications derived from scientific papers and patent database. The remainder of this paper is structured as follows. Section 2 introduces relevant previous literature. Section 3 describes the overall research concept of this study, database, data collection and quantitative methodology. Section 4 presents the results of the case study using the proposed methodology, which considers the pattern recognition technology field. Section 5 discusses the implications of the results. Lastly, Section 6 provides the contribution, limitation, and applications of the research. 2. Literature Review 2.1. Concept of Promising Technology Promising technology can be defined differently from diverse viewpoints. Technical excellence can be considered as a factor for promising technology from the perspective of technology development. On the other hand, from the viewpoint of the market, the technology that is likely to make a great economic outcome after commercialization can be recognized as a promising technology. From the patent perspective, the technology that possesses core relevant patents can be regarded as a promising technology, as a patent is a legal means to protect the right of use of a technology. The term “promising technology” [1,15–17] is used interchangeably with other similar terms such as “emerging technology” [18–24], “research front” [2,25–28], and “research frontier” [1,29,30] etc. without it being defined clearly. Among the various related terms, Cozzens et al. [31] summarized the major concept of emerging technology by reviewing its definition in the literature: (i) fast recent growth [18,21]; (ii) transition or change to something new [19,20]; (iii) market or economic potential [19–21]; and (iv) science-based innovation [19]. Similarly, Rotolo et al. [32] identified five attributes of emerging technologies: (i) radical novelty [19,33]; (ii) relatively fast growth [31,34]; (iii) coherence [19,34–36]; (iv) prominent impact [18–21,31,34–37]; and (v) uncertainty and ambiguity [19–21,31,35,38,39]. However, Noh et al. [15] included four major concepts for promising technology in a broad sense: (i) technological vacancy; (ii) convergent technology; (iii) recent appearance and rapid growth of a technology regarding emerging technology; and (iv) customer-based technology. These perspectives on promising technology were not constructed to be mutually exclusive or collectively exhaustive, as they are affected by the purpose of the research, and the characteristics of technologies, respectively. To develop the conceptual model by reflecting comprehensive perspectives of the promising technology regarding Proposition 1, in this paper, the promising technology is identified as a highly growing, impactful and profitable technology, reflecting the major concepts of emerging technology from the works of Cozzens et al. [31] and Rotolo et al. [32], but the concepts of coherence and uncertainty from Rotolo et al. [32] are excluded, because it is difficult to measure and reflect them. The other concepts, such as technological vacancy, convergent technology, and customer-based technology, were also not considered, because they were too broad to deal with. 2.2. Detecting Promising Technology Using Bibliometrics Bibliometrics is a method for analyzing publication data such as academic literature, patents, and other publications [40]. It can describe the research interests or the quantity of research, evaluate the impact of a technology or effectiveness of a research organization, and monitor research trends
Sustainability 2018, 10, 4055
4 of 33
[41]. The approach can be used not only to understand the past by tracing the citation relation but also to forecast the future [42] because it is able to identify “hidden patterns” from large amounts of historical data [43]. Bibliometric analysis has been widely used to detect promising or emerging research areas or technologies as a quantitative approach. It can be exploited to provide an informative reference for forecasting promising technologies or research areas as the results are derived from the objective data-driven quantitative analysis. Table 1 shows the previous bibliometrics studies for promising technology from prior literature [31,32]. The previous researchers mostly focused on fast growth, among the several attributes of emerging technology. Other attributes, such as radical novelty, market impact, and science impact, were not reflected when detecting promising technologies. Terminologies such as research front, field, and frontier were utilized when they were using bibliographic information from scientific publications, whereas the studies using patent information utilized the term “emerging technology”. Furthermore, a few studies utilized information from both patents and publications. To identify promising technologies using bibliometrics, various analysis techniques were employed such as co-citation analysis using bibliographic data, co-word analysis and text mining based on text information, network analysis for data visualization [44]. This summary shows a similar propensity to the summary suggested in Rotolo et al. [32] that effectively summarized the operational definitions, data, and methods of the previous literature. Many studies on emerging technology utilized publication and patent data respectively. Although some studies [22,30] utilized both forms of bibliographic data, they focused on the concept of fast growth. This research proposes promising research frontiers using both scientific papers and patents and the results are compared with regard to Proposition 2. Additionally, although there is an attempt [1] to identify promising research frontiers with consideration for not only fast growth but also market impact, it did not utilize scientific papers and consider science-based innovation perspective. Thus, this paper suggests promising research frontiers with comprehensive perspectives with both scientific papers and patents. The conceptual model of the present research is related to the prior studies [1,30,45] in that the model derives core technological documents by the screening process and identifies research frontiers through a clustering method. The promising indices are updated based on the indices of prior research [1] and several indices are added because data source is extended and some analytic steps are added. To include newly emerging impactful technological documents, the model includes the step to evaluate leading research organizations and collects the technological documents of them. This conceptual model also proposes promising research frontiers by suggesting outliers as several previous studies [46–48] suggested technological opportunities as a weak signal. Table 1. Summary of previous studies on detection for promising technology using bibliometrics. Concept of Emerging Technology from Rotolo et al. from Cozzens et al. (2015) [32] (2010) [31]
Literature
Lee (2008) [16] Shibata et al. (2011) [2]
Relatively fast growth
Fast recent growth
Terminology Promising/emer ging research field Emerging research front
Data
Method
Publications
Co-word analysis
Publications
Iwami et al. (2014) [17]
Promising field
Toivanen (2014) [29] Corrocher et al. (2003) [18]
Research frontier Emerging technology
Breitzman and Thomas (2015) [23]
Emerging technology
Patents
Noh et al. (2016) [15]
Emerging technology
Patents
Publications
Citation network; Clustering Citation network; Time transition analysis
Publications
Bibliometrics
Patents
Co-word analysis Co-citation analysis; Clustering; Scoring Network analysis; Textmining
Sustainability 2018, 10, 4055
Radical novelty
Prominent impact Coherence Uncertainty and ambiguity
5 of 33
Transition/change to something new Market/economic potential Science-based innovation -
Park et al. (2016) [1] Park et al. (2015) [30] Visessonchok et al. (2014) [22] Érdi et al. (2013) [24] Park et al. (2016) [1]
Promising research frontier Promising research frontier Emerging technology Emerging technology Promising research frontier
-
-
-
-
-
-
-
-
-
-
-
-
-
Patents Patents and publications Patents and publications Patents Patents
Network analysis; Clustering; Index Network analysis; Clustering Citation network; Clustering Citation network; Clustering Network analysis; Clustering; Index
3. Methodology 3.1. Research Concept and Overall Process Figure 1 shows the overall research concept to detect promising technologies. In this research, data from both scientific papers and patents are firstly utilized as technological documents to identify promising technologies using bibliometrics. Second, the core technological documents are selected from the set of collected technological documents through the proposed screening methodology. Several quantitative indices are proposed by evaluating technological documents and the capacity of research organizations in the screening process. In particular, this paper considers the research capability of research organizations to include technological documents that need to be considered despite low scores in the suggested indices because top research organizations can lead the direction of technology development. Third, the finalized core documents are grouped into research frontiers (RFs) using clustering algorithm, or are otherwise determined as outlier documents. Finally, promising research frontiers and outlier documents are identified by calculating the proposed promising indices. The promising technologies are suggested with several types, and compared between those derived from scientific papers and patents.
Figure 1. Research concept.
Sustainability 2018, 10, 4055
6 of 33
Figure 2 shows the detailed research process to identify the promising technologies. The promising technologies are identified with two perspectives, which are academic and technological, using scientific papers and patents. In the first step, scientific paper and patent data as technological document data are collected from the Web of Science (WoS) database and the United States Patents and Trademark Office (USPTO) database, respectively. In the second step, first of all, core technological documents are screened by evaluating the technological documents. An evaluation index is proposed in this research by reflecting the characteristics of the documents. Scientific papers are evaluated in terms of paper impact and academic research impact, whereas patents are evaluated from the viewpoints of novelty, impact, marketability, and the right range of patent, in order to derive core technological documents. Second, leading research organizations (ROs) are selected in the target technology area by evaluating the capacity of the RO. The RO capacity is evaluated in terms of the RO’s activity for publications, RO’s productivity for core publications, and impact of papers published from the ROs from the perspective of scientific paper. Meanwhile, the RO capacity in respect of patents is evaluated from the RO’s activity for patent application, competitiveness of the patents registered from the RO, and the effect of patents registered from the RO. Third, the core technological document dataset is finally constructed by adding technological documents for the leading research organizations. This step is to include the technological documents that were underestimated using the evaluation index, because some recent technologies that have little chance to get high scores in the indices can be promising in the future. There is a presumption that the technological results from leading research groups had more potential to be promising technologies. In the third step, the research frontiers (RFs) are identified by clustering the core technological documents. In this step, RFs that have more than two documents, and outlier documents that are not grouped are extracted. In the final step, promising research frontiers for the academic perspective and the technology perspective are identified by calculating the promising indices. The promising indices for scientific papers and patents are proposed by considering the growth, impact, and sciencebased effects.
Figure 2. Research process.
Sustainability 2018, 10, 4055
7 of 33
3.2. Database, Data Collection, and Quantitative Methodology 3.2.1. Technological Documents Collection In this step, the common process for both scientific papers and patents should be conducted: (1) target technology selection; (2) technology tree construction for the target technology; (3) searching keyword selection; (4) searching query construction; (5) data collection; and (6) noise removal. Data, including scientific journal papers and conference proceeding papers that had been published for 10 years, were collected from the WoS database. In addition, the registered patents for the first eight years, and the publicized and registered patents for the most recent two years were collected from the USPTO database. The proceeding papers and the publicized patents were collected to include more recent technological documents that would reflect the attribute of emerging technology, as those data represent more recent research themes. We selected the technology field of pattern recognition as an illustration of the proposed method in this research. The technologies on pattern recognition have been widely utilized in character recognition, biometric recognition, human behavior pattern analysis, and medical image analysis. Furthermore, the technologies are fundamental to deep learning technology, which has recently received close attention. Thus, it is necessary to identify promising technologies in the relevant technologies in terms of academic and technological perspectives. Then, we built a technology tree for the pattern recognition technology and selected searching keywords and searching queries as shown in Table A1. The bibliographic data on scientific papers, including core articles, journal and proceeding papers published between 2005 and 2014, were collected by searching in ‘title’ field of the WoS database using the searching queries of Table A1. Technology tree, which is a hierarchical structure of technology and structured as upper, middle, and lower classification in Table A1, and searching queries were constructed based on the literature survey and experts’ opinion from a leading research institute of ICT field in Korea. The collected data includes bibliographic information on scientific papers on pattern recognition such as title, author, abstract, reference, citing reference and so on. After data collection and noise removal, 2421 scientific papers were collected, and 740 core scientific papers, which was the number of the papers published in Q1 journal, were extracted by the annual rate of total collected papers in a descending order, based on the criterion of the evaluated value. The noise data that are not relevant to pattern recognition technology were deleted by investigating the title and abstract of papers. The top 20 research organizations were extracted as leading ROs, using the proposed evaluation indices for ROs. The 76 scientific papers were those that had been published by the 20 leading ROs during the recent three years, and evaluated in the top 50% of the average value of the indices. Finally, 745 core scientific papers were extracted after adding the 76 papers published by 20 leading ROs, and deduplicating them. Table 2 shows the results of scientific paper data. The data on patents registered from 2005 to 2014 and publicized from 2013 to 2014 in the USPTO database were collected. After data collection and noise removal, 5144 patents, which consisted of 3649 registered patents and 1495 publicized patents, were collected; and 648 patents, which was the number of patents whose family size was more than five, were extracted by the annual rate of the total collected patents in a descending order, based on the criteria of the evaluated value. The top 20 research organizations were extracted as leading ROs, using the proposed evaluation indices for ROs. The 922 patents were those that had been filed by 20 leading ROs during the most recent three years, and evaluated in the top 50% of the average value of the indices. Finally, 993 core patents were extracted after adding 922 patents filed by 20 leading ROs, and deduplicating them. Table 3 shows the results of patent data collection.
Sustainability 2018, 10, 4055
8 of 33
Table 2. Results of data collection on scientific paper. Upper Classification
Middle Classification
Biometric recognition
Biometric recognition
Image recognition
Human recognition
Voice recognition
Voice recognition Total
Lower Classification DNA recognition Vein recognition Fingerprint recognition Iris recognition Face recognition Action and gesture recognition Voice recognition
Collected Scientific Papers 172 92 233 189 361
Core Scientific Papers 95 26 81 47 120
459
170
915 2421
206 745
Table 3. Results of data collection on patent. Upper Classification
Middle Classification
Biometric recognition
Biometric recognition Object recognition
Image recognition
Voice recognition
Human recognition
Utterance recognition Speaker recognition Total
Lower Classification DNA recognition Vein recognition Fingerprint recognition Iris recognition Object recognition Human detection and trace Face recognition Action and gesture recognition Isolated language recognition Continuous speech recognition Speaker recognition
Collected Patents 141 141 298 172 414 561 1390
Core Patents 20 19 65 14 87 93 334
1203
237
416
76
44
6
264 5144
42 993
3.2.2. Core Technological Documents Selection by Evaluating Technological Documents In this step, the common process for both scientific papers and patents should be conducted: Core technological documents are selected using the indices for each scientific paper and patent, as the two types of documents have different bibliographic information. The evaluation indices for each technological document are proposed that reflect their own characteristics. The number of core scientific papers is decided as the number of papers that are published in Q1 journal, which denotes the top 25% of the journal impact factors (JIFs), which are the yearly rankings of science and social science journals provided by Journal Citation Reports (JCR), published by Clarivate Analytics. The core scientific papers are selected based on the evaluation indices for scientific papers by the annual rate of total collected papers. The evaluation indices consist of the perspectives of paper impact and research impact. The paper impact index is proposed based on the number of forward citations for scientific paper as Dahlin and Behrens [49] utilized forward citations from the perspective of impact. The research impact index is suggested based on the JIFs and the number of forward citations because it would be potentially more impactful in terms of research impact perspective if the paper is published in journals with a high JIF. Both paper impact and research impact indices are transformed to a normalized value that is the value less the minimum value divided by the maximum value less the minimum value, as shown in (1) and (3). The research impact value is calculated by multiplying the journal impact factor for a scientific paper by the number of forward citations for the scientific paper, as shown in (2), and the calculated value is normalized as (3). The core scientific papers are extracted based on the average value of the two evaluation indices for scientific papers—paper
Sustainability 2018, 10, 4055
9 of 33
impact, and research impact index—in a descending order, for as many as the calculated number by the annual rate of the total collected papers. Paper(Patent) Impact =
. max(
− ( . ) − min(
.
) .
)
(2)
Research Impact = JIF × No. of forward citation Norm. Research Impact =
(1)
Research Impact − (Research Impact) max(Research Impact) − min(Research Impact)
(3)
Next, the number of core patents is decided as the number of patents that have more than five patent family countries. We utilized five patent families as standard to extract core patents, because the five patent offices—the United States of America (US), the European Union (EU), Japan (JP), China (CN), and Korea (KR)—are regarded as major patent offices. The core patents are selected based on the evaluation indices for patents by the annual rate of the total collected patents. The evaluation indices consist of the perspectives of patent novelty, impact, marketability, and right range. The novelty and impact indices are derived from the perspective of patent innovativeness, and these are developed as (4) and (1), simplifying the concept suggested in Dahlin and Behrens [49]. The patent that includes a lesser number of backward citations can be regarded as a novel patent, because the patent is dissimilar to past patents. That is, the patent that has a lesser number of references can be regarded as novel, in terms of the basis for innovation. Thus, the value is normalized and subtracted from one as (4). The patent impact index is proposed based on the number of forward citations as (1). Patent novelty = 1 −
. max(
.
− ( . ) − min(
) .
)
(4)
The patent marketability index is proposed based on the patent family size as (5), because the number of family patents can be perceived as the technology’s potential market size [1]. The patent right range index is proposed based on the number of independent claims as (6). The number of independent claims in a patent can be considered as the right range of the patent, because each invention should be divided into claims, when a patent that includes more than two inventions is filed as one application [1]. The weighted sum of each value from the indices is calculated by deciding the weight using the analytic hierarchy process (AHP). Table 4 shows the evaluation indices for technological documents of both scientific papers and patents. Patent Marketability = Patent Right range =
max(
. max(
.
− ( ) − min( − ( . ) − min(
)
(5)
) ) .
)
(6)
Table 4. Evaluation indices for technological documents.
Source
Scientific paper
Perspective
Bibliographic Information
Paper impact
Forward citation
Research impact
Journal impact factor (JIF), Forward citation
Patent novelty
Backward citation
Patent impact
Forward citation
Patent
Operational Definition The normalized number of forward citations for scientific papers The normalized value that multiplies journal impact factor for the scientific paper by the number of forward citations for scientific papers The normalized number of backward citations for the patent that is subtracted from one The normalized number of forward citations for patents
Sustainability 2018, 10, 4055
10 of 33
Patent marketability Patent right range
Patent family
The normalized patent family size
Claim
The normalized number of independent claims
3.2.3. Core Technological Documents Selection by Evaluating Research Organization Although the core technological documents are selected by extracting those that have high values in the scoring model by year, there can be some potential core documents, because some indices are developed based on bibliographic information, such as the number of forward citations. For example, the number of forward citations can be increased as time goes by. Thus, the process of core document selection is redeemed by adding the leading research organization’s documents in order to complement the recent research results by leading ROs, as the technological results from leading research groups have more potential to be promising technologies. To this end, the indices to evaluate ROs in the technology field are proposed in this research, reflecting the characteristics of respective technological documents. The leading ROs for a scientific paper are selected based on the evaluation indices for the leading ROs for scientific papers. The evaluation indices consist of the perspectives of RO’s activity for publication, productivity for core publication, and impact of RO’s publication. The index of RO’s activity for publication is proposed based on the number of RO’s scientific papers because the greater the number of publication by RO is, the more active the RO is in the technology field. The RO’s activity is evaluated using (7) and it is normalized using (8). .
RO s activity index (AI) = Norm. AI =
(
)
.
(
(7)
)
AI − (AI) max(AI) − min(AI)
(8)
The index of the RO’s productivity for core publication is proposed based on the number of RO’s scientific papers, and journal impact factor (JIF) of the scientific paper. To this end, core journals in the technology field are defined as the journals whose JIF value is greater than the average JIF in the target technology area. The RO’s productivity index (PI) is calculated as shown in (9), and normalized using (10), because the greater the number of the RO’s scientific papers published in core journal is, the higher the RO’s research productivity. RO s productivity index (PI) =
.
ℎ
× 100
.
Norm. PI =
PI − (PI) max(PI) − min(PI)
(9) (10)
The index for impact of RO’s publication is proposed based on the number of RO’s scientific papers, and forward citation of the scientific paper. The impact of RO’s publication index (II) is calculated as shown (11) and normalized using (12). Impact of RO’s publication index (II) =
.
Norm. II =
ℎ II − (II) max(II) − min(II)
(11) .
(12)
The top 20 leading ROs are extracted based on the average value of three evaluation indices for the RO using scientific papers. After domain experts reviewed the list of companies, the number of leading ROs was concluded to include most of influential and active ROs. The core scientific paper dataset is finalized by adding the scientific papers that are published by the top 20 leading ROs within the most recent three years, and positioned in the top 50%, based on the average score of three evaluation indices. Since the time duration of technology development is generally 2–3 years, we limited the time frame to the last three years to add recent papers. In addition, the criterion of scores
Sustainability 2018, 10, 4055
11 of 33
in the indices (50%) was selected because the papers published in the Q1 and Q2 journals can be normally regarded as good quality papers. Although papers in Q2 journals might be not a highquality paper, those that are published by leading ROs can have great potential for promising technology. The leading ROs for patents are selected based on the evaluation indices for leading ROs for patents. The evaluation indices consist of the perspectives of RO’s activity for patent application, market competitiveness of RO’s patents, and effect of RO’s patents. The index of RO’s activity for patent application is calculated in the same way using (7), and it is normalized using (8). The index of market competitiveness of RO’s patents is calculated in the same way using (5) but patent family size should be substituted by the value of RO’s market competitiveness index (MCI) calculated by (13). Moreover, the index for the effect of RO’s patents is calculated in the same way using (11) and it is normalized using (12); but forward citation of papers should be substituted by forward citation of patents. The top 20 leading ROs are extracted based on the average value of the three evaluation indices for ROs using patents. The core patent dataset is finalized by adding the patents that are publicized and registered by the top 20 leading ROs within the most recent three years, and positioned in the top 50%, based on the average score of the three evaluation indices. Table 5 shows the evaluation indices for research organizations from the perspective of scientific papers and patents. RO s market competitiveness index (MCI) =
the average patent family size
(13)
Table 5. Evaluation indices for research organizations.
Source
Perspective
Operational Definition
* RO’s activity for publication
Frequency
RO’s productivity for core publication
Frequency, Journal impact factor
Impact of RO’s publication
Frequency, Forward citation
RO’s activity for patent application
Frequency
Market competitiveness of RO’s patents
Patent family
The normalized value of RO’s patent family size divided by the average patent family size
Forward citation
The normalized value of the number of forward citations for RO’s patents divided by the number of forward citations for total patents
Scientific paper
Patent
Bibliographic Information
Effect of RO’s patents
The normalized value of the number of RO’s papers divided by the total number of papers The normalized value of the percentage of the number of RO’s papers published in the core journal among the number of RO’s papers The normalized value of the percentage of the number of forward citations for RO’s papers among the number of forward citations for total papers divided by the percentage of the number of RO’s papers among the number of total papers The normalized value of the number of RO’s patents divided by the total number of patents
* RO: Research Organization.
3.2.4. Research Frontiers Extraction by Clustering The core technological documents are grouped by a Girvan and Newman clustering algorithm [50], which is a hierarchical method to detect communities by removing edges from the original network. In this research, the original network is developed based on the normalized bibliographic
Sustainability 2018, 10, 4055
12 of 33
coupling relation [51] that represents the degree of sharing references between technological documents. The normalized bibliographic coupling strength (NBCS) is defined as NBCS =
(14)
where NBCS is the normalized coupling strength between technological document i and j, is the number of sharing references between i and j, and ( ) is the number of references in the reference list of document i(j). The NBCS value is zero to one. After developing network based on normalized bibliographic coupling relation between documents, the edge betweenness centrality in the network, which is an extended concept of the vertex betweenness centrality [52], is calculated as [53] ( )
( )=
(15)
∈
where ( ) is the edge betweenness centrality of edge e, is the number of shortest paths connecting node s to t, and ( ) is the number of shortest paths connecting node s to t passing through the edge e. Based on edge betweenness centrality value, Girvan and Newman clustering algorithm for discovering community structure in network were conducted. In the algorithm, the edge with the highest edge betweenness centrality is progressively removed. The edge betweenness is recalculated after removal of the edge with the highest value. The removal and calculation processes are repeated, until the modularity(Q) [50] is the highest, which means that the clustering process can provide the best set of groups in a way that maximizes the modularity. The modularity is defined as Q=
(
−
)=
e−‖ ‖
(16)
where is the fraction of all edges in the network that link vertices in community i to vertices in community j, the trace of the matric =∑ gives the fraction of edges in the network that ∑ connect vertices in the same community, = is the fraction of edges that connect to vertices in community i, and ‖ ‖ is the sum of the elements of the matrix x. The research frontiers (RFs) are identified by conducting this clustering process because the clusters are derived from the core technological documents. Moreover, the names of research frontiers are identified by reviewing the title and abstract of core technological documents. 3.2.5. Promising Research Frontiers Identification by Calculating Promising Indices Promising research frontiers (RFs) are identified by using the promising indices, which are developed from the perspectives of growth, impact, marketability, and science-based effect. Those indices reflect the perspectives of rapid growth, market or economic potential, and scientific or technological change as attributes of promising technology introduced in the literature review section. The indices of growth and impact are common in scientific papers and patents, whereas the science-based effect index is for scientific papers, and the marketability index is for patents, because a paper includes rather academic and scientific information, whereas a patent includes technological information, which is likely to be commercialized. The growth and impact are defined as the growing potential of the RF and the applicability to other technologies, respectively, and the common indices—growth index (GI) and impact index (II)—are calculated using Equations (17) and (18), respectively. Growth Index (GI) =
∑( ×(
− −1
) × 100)
(17)
where, Ai = the number of technological documents in RF i, Pt = the number of technological documents in RF i at time t, N = the total number of technological documents, and n = the data collection period.
Sustainability 2018, 10, 4055
13 of 33
Impact Index (II) =
(18)
where, Ci = the number of forward citations in RF i, and Pi = the number of technological documents in RF i. The science-based effect is defined as the effect of knowledge on science and technology. It is calculated with the journal impact factor using (19). The marketability index is defined as the potential for utilization as a product or service. It is calculated with the patent family size using (20). Table 6 shows the promising indices and the average score of the promising value from the three perspectives. However, the technological documents that are not grouped as RFs are considered as outliers, and the outlier documents are also evaluated by using impact, marketability, the sciencebased effect, and recentness, instead of growth, as the number of documents is just one, and the document does not belong to an RF. Sci − based Effect Index (SEI) =
(19)
where, IFi = sum of the impact factor of papers in RF i, and Pi = the number of technological documents in RF i. Marketability Index (MI) =
(20)
where, Fi = sum of the patent family size in RF i, and Pi = the number of technological documents in RF i. The equations for all indices in this paper are summarized in Table A2. Table 6. Promising indices for promising research frontiers.
Source
Scientific paper
Patent
Perspective
Bibliographic Information
Growth
Frequency
Impact
Forward citation
Science-based effect
Journal impact factor
Growth
Frequency
Marketability
Patent family
Impact
Forward citation
Operational Definition ● Growing potential of research frontier (RF) ● The value that multiplies the percentage of the papers in the RF among the total papers by the growth rate of papers in the RF ● Applicability to other technologies ● The sum of forward citations of papers in the RF divided by the number of papers in the RF ● Effect of knowledge on science and technology ● The sum of JIFs of papers in the RF divided by the number of papers in the RF ● Growing potential of the research frontier ● The value that multiplies the percentage of the papers in the RF among the total patents by growth rate of patents in the RF ● Potential for utilization as product and service ● The family size of patents in the RF divided by the number of patents in the RF ● Applicability to other technologies ● The sum of forward citation of patents in the RF divided by the number of patents in the RF
The promising RFs are classified into four categories (recently emerging RFs, persistently emerging RFs, neutral RFs, and recently emerging outliers), by considering the level of technology development and the recentness of technological knowledge, based on the distribution of the
Sustainability 2018, 10, 4055
14 of 33
publication year of technological documents in the RF, in order to suggest comprehensive interpretation of the results from scientific papers and patents. The recently emerging RF is defined as the cluster in which the technological documents published within the most recent three years account for more than 80 percent of all documents. The persistently emerging RF is defined as the cluster that includes technological documents that have emerged in more than five years among the total ten years. The neutral RF is defined as the cluster that includes technological documents that have emerged in less than five years among the total ten years, and in which the technological documents published within the most recent three years account for less than 80 percent of all documents. The recently emerging outlier is defined as the technological document itself that is not clustered, and that is published within the most recent three years. In addition, technological contents of promising research frontiers are presented to provide the practical information for technology development by conducting text mining. 4. Results 4.1. Results of the Analysis Using Scientific Papers The research frontiers (RFs) shown in Table 7 were extracted by conducting Girvan and Newman clustering from the network based on the bibliographic coupling relation between the papers. The Girvan-Newman clustering was conducted at the upper classification level to derive the best clustering results using NetMiner, which is an application software for the visualization of large networks based on social network analysis. The modularity values were 28.85, 360.22, and 165.67 for each biometric, image, and voice recognition. As a result, 35 clusters that included at least two papers and 384 outliers were extracted. The clusters consisted of two recently emerging RFs, 22 neutral RFs, and 11 persistently emerging RFs. The promising RFs were extracted as the top 10 RFs in each type of cluster. Table 8 shows the title of the promising RF, the calculated values using the promising indices, and keywords derived through text mining. Vein and fingerprint recognition were included in recently emerging RF, biometric recognition, such as DNA and RNA recognition, was included in neutral RF, and gesture, RNA, and voice recognition were included in persistently emerging RF. Table 9 shows the title of the recently emerging outliers, the calculated values using promising indices, and keywords derived through text mining. The papers in the recently emerging outlier group can be considered as weak signals for promising research areas. Table 7. Results of RFs on scientific papers.
Type Cluster Outlier
Title Recently emerging RF Neutral RF Persistently emerging RF Recently emerging outlier outlier
No. of Scientific Papers (%) 4 (1.11%) 86 (23.82%) 271 (75.07%) 157 (40.89%) 227 (59.11%)
No. of Clusters (%) 2 (5.71%) 22 (62.86%) 11 (31.43%) -
Sustainability 2018, 10, 4055
15 of 33
Table 8. Promising RF identification from scientific papers. Type of Cluster Recently emerging RF
RF No. RF 33 RF 35
RF 20 RF 410 RF 10 RF 272 RF 416
The pattern of distribution of amino groups for RNA recognition DNA microarray-based detection Detection of actionable genomic alterations RNA sequencing Study on voice recognition Face recognition method under lighting or color condition
RF 13
Nanoscale DNA-polymer micelles
0.042
0.026
0.280
0.116
RF 31 RF 29
RNA recognition motif protein HPV DNA detection
0 0.009
0.066 0.168
0.260 0.112
0.108 0.096
RF 92
Human action and gesture recognition
1
0.236
0.071
0.436
RF 1
RNA pattern recognition
0.339
0.335
0.601
0.425
RF 2 RF 415
Fingerprint recognition using model-based density map Analytic techniques for face recognition
0.970 0.283
0.118 0.336
0.055 0.094
0.381 0.238
RF 93
Cognition, action, and object manipulation
0.101
0.308
0.206
0.205
RF 254
Robust speech recognition algorithm
0.409
0.110
0.049
0.189
RF 257
Speech recognition by bilateral cochlear implant users Patterns of feature space, correlation, classification for face recognition
0.339
0.126
0.030
0.165
Keywords Iris, recognition, sclera, vein Extraction, spectrometry, determination DNA, mixture, synthetic, nanotube, recognition DNA, antibiotics, RNA, cleavage, molecular, genome DNA, detection, cell, microarray Clinic, tumor, cancer, target, detection RNA, gene, RNA-seq, cell, DNA, identify Voice, recognition, face, individual, speech Recognition, face, pattern, represent DNA, surfaces, micelles, individual, pattern, recognition RBM, RBP, MMA, transcription, pattern HPV, carcinoma, cervical, detect, DNA Action, recognition, motion, gesture, human, feature RNA, immune, response, dsRNA, DNA, recognition, protein Iris, recognition, detect, extract Face, recognition, discriminative, detect Action, activation, cognitive, recognition, inferior, demonstrate Speech, recognition, recognition, feature, signal, vector Speech, recognition, cochlear, hear, listen
0.152
0.220
0.0821
0.151
Face, recognition, match, extract
RF 17
DNA methylation patterns
0.057
0.099
0.258
0.138
RF 6
Detection of latent fingerprints
0.179
0.088
0.107
0.124
RF 30 RF 16
Neutral RF
Persistently emerging RF
RF 417
Title of Promising RF Sclera vein recognition Optimal extraction and fingerprint analysis
GI 0.056 0
II 0 0.015
SEI 0.143 0.068
Mean 0.066 0.027
DNA Sequencing, and cancerous DNA recognition
0.011
1
1
0.670
0.029
0.283
0.527
0.280
0.010 0.028 0.215 0.040 0.065
0.336 0.357 0.089 0.145 0.242
0.429 0.328 0.247 0.230 0.044
0.258 0.238 0.184 0.138 0.117
Methylation, DNA, detect, cancer, hypermethylation Fingerprint, detect, latent, contaminate, fluorescence, surfaces
Sustainability 2018, 10, 4055
16 of 33
Table 9. Recently emerging outlier identification from scientific papers.
Title of Recently Emerging Outlier (Paper) In-Situ Generation of Differential Sensors that Fingerprint Kinases and the Cellular Response to Their Expression Fully Printed Flexible Fingerprint-like Three-Axis Tactile and Slip Force and Temperature Sensors for Artificial Skin Direct recognition of homology between double helices of DNA in Neurospora crassa Fooling the Kickers but not the Goalkeepers: Behavioral and Neurophysiological Correlates of Fake Action Detection in Soccer The Negative Association of Childhood Obesity to Cognitive Control of Action Monitoring Human Parietofrontal Networks Related to Action Observation Detected at Rest Detecting bacterial lung infections: in vivo evaluation of in vitro volatile fingerprints Detection of a transient mitochondrial DNA heteroplasmy in the progeny of crossed genetically divergent isolates of arbuscular mycorrhizal fungi In Vivo Magnetization Transfer and Diffusion-Weighted Magnetic Resonance Imaging Detects Thrombus Composition in a Mouse Model of Deep Vein Thrombosis Interactions Between Visual and Motor Areas During the Recognition of Plausible Actions as Revealed by Magnetoencephalography
II
SEI
Mean
Keywords
0.044
0.359
0.202
Kinases, protein, vitro
0.013
0.378
0.195
Tactile, skin, temperature, detect
0.013
0.337
0.175
DNA, homology, identical, recognition
0.053
0.259
0.156
Action, predict, observe
0.049
0.259
0.154
Children, condition, amplitude, action
0.008
0.259
0.134
Observation, action, identified, correspondence
0.129
0.108
0.119
Vitro, vivo, fingerprint, aeruginosa
0.031
0.197
0.114
Isolates, progeny, heteroplasmy, divergent
0.017
0.209
0.113
Thrombus, histological, vein, detect
0
0.215
0.107
Action, activity, interact, recognition
Sustainability 2018, 10, 4055
17 of 33
4.2. Results of the Analysis Using Patents The research frontiers (RFs) shown in Table 10 were extracted by conducting Girvan and Newman clustering from the network, based on the bibliographic coupling relation between patents. The Girvan-Newman clustering was conducted at the upper classification level using NetMiner, when the modularity values were 84.85, 28.71, and 13.81 for each biometric, image, and voice recognition. As a result, 64 clusters that included at least two papers, and 651 patents were extracted. The clusters consisted of 20 recently emerging RFs, 43 neutral RFs, and one persistently emerging RF. The promising RFs were extracted as the top 10 RFs in each type of cluster. Table 11 shows the title of the promising RF, the calculated values using promising indices, and keywords derived through text mining. Vein, face, and voice recognition were included in the recently emerging RFs, face, fingerprint, and biometric recognition were included in the neutral RFs, and vein recognition was included in the persistently emerging RF. Table 12 presents the title of the recently emerging outlier, the calculated values using the promising indices, and keywords derived through text-mining. Table 10. Results of RFs on patents.
Type Cluster Outlier
Title Recently emerging RF Neutral RF Persistently emerging RF Recently emerging outlier outlier
No. of Patents (%) 51 (14.91%) 257 (72.15%) 34 (9.94%) 317 (48.69%) 334 (51.30%)
No. of Clusters (%) 20 (31.25%) 43 (67.19%) 1 (1.56%) -
4.3. Comparisons Results of the Analysis Using between Scientific Papers and Patents Although there were several RFs that commonly emerged in both scientific paper and patent areas, the RFs for each technological document are classified into different categories and have different research themes. First, the fingerprint recognition-related research theme represented in the persistently emerging RF group and the recently emerging RF group were common in the scientific paper and patent areas. The RFs on the model for fingerprint recognition were distributed in terms of scientific papers (RF 35, RF 2, RF 6 in Table 8), whereas the RFs on fingerprint recognition using sensor in neutral RFs (RF 2 in Table 11), and RFs related to biometric sensor for fingerprint in recently emerging RFs (RF 12 in Table 11) were distributed in terms of patents. Second, the face detection research fields emerged in neutral and persistently emerging RFs for scientific papers, and in recently emerging and neutral RFs for patents. The research themes related to method and pattern for face detection were persistently emerged from the perspective of scientific papers (RF 415, RF 417 in Table 8), whereas the research themes on facial image processing and acquisition emerged in the neutral RFs group (RF 49, RF 51, RF 48, RF 87 in Table 11), and the themes on diverse methods were distributed in the recently emerging RFs group (RF 45, RF 90, RF 175 in Table 11) from the perspective of patents. Third, the gesture recognition research fields emerged in the persistently emerging RFs for scientific papers (RF 92 in Table 8), and in the neutral (RF 52, RF 56 in Table 11) and recently emerging RFs (RF 237 in Table 11) for patents. Fourth, the voice recognition research fields emerged in the persistently emerging and neutral RFs for scientific papers, and in the recently emerging and neutral RFs for patents. The research themes related to recognition algorithm persistently emerged from the perspective of scientific papers (RF 272, RF 254, RF 257 in Table 8), whereas the research themes on voice control method emerged in the recently emerging RF group from the perspective of patents (RF 699 in Table 11). Fifth, the DNA/RNA recognition research fields emerged in the persistently emerging, neutral, and recently emerging RFs for scientific papers, and in the recently emerging RFs for patents. The research themes related to DNA/RNA pattern recognition and sequencing were distributed from the perspective of scientific papers (RF 30, RF 16, RF 20, RF 410, RF 10, RF 13, RF 31, RF 29, RF 1, RF 17 in Table 8), whereas the research themes on DNA detection emerged in the recently emerging RFs group from the perspective of patents (RF 1 in Table 11).
Sustainability 2018, 10, 4055
18 of 33
Finally, the vein recognition research fields emerged in the recently emerging RFs for both scientific papers and patents. From the perspective of scientific papers, the research theme was specified as sclera vein recognition (RF 33 in Table 8), whereas the research themes were rather general from the perspective of patents (RF 8, RF 20 in Table 11). In addition, the RFs of image recognition emerged in the neutral and recently emerging RFs groups from the perspective of only patents (RF 49, RF 154 in Table 11).
Sustainability 2018, 10, 4055
19 of 33
Table 11. Promising RF identification from patent. Type of Cluster
Recently emerging RF
Neutral RF
Persistently emerging RF
RF No.
Title of Promising RF
GI
II
MI
Mean
Keywords Face, detect, measure, confidence, person, gesture Recognition, detect, feature, synchronization Motion, movement, contact, decoding, face, generate Motion, region, detector, hand, gesture Determine, Vein Fistula, vessel, identified, atrium Sensor, encapsulation, biometric, fingerprint Image, determine, voice, predetermine, recognition face, detect, track, determine, facial, head Voice, recognition, receive, language, speech Pressure, peripheral, hemodynamic, venous, vessel, configure Detect, face, image, gesture, eye, section, recognition Detect, magnification, gesture, face Image, detection, face, motion, gesture, capturing, feature Image, detection, face, determine, gesture, feature DNA, detecting, different, determine, molecule Image, detecting, face, feature, configure, apparatus, vector, signal Detecting, finger, gesture, determine, display Fingerprint, sensor, finger, configure, capture Hand, focus, determine, face, track, human, autofocus Search, face, detection, determine, configure, recognition Fingerprint, sensor, substrate, detect, determine, finger
RF 45 RF 63
Automatic face detection Displaying view for recognition
0.148 0.021
0.724 0.004
0.375 0.541
0.415 0.189
RF 90
Facial decoding method
0.021
0.057
0.416
0.165
RF 237 RF 8 RF 12 RF 154 RF 175 RF 699
Recursive motion recognition Vein pattern detection Biometric sensor device for fingerprint Image discriminating method Multi angle face recognition Voice control method
0 0 0.028 0 0.084 0.084
0.139 0 0 0.059 0.013 0
0.333 0.291 0.25 0.208 0.166 0.166
0.157 0.097 0.092 0.089 0.088 0.083
RF 20
Blood vessel recognition for treat
0.080
0
0.166
0.082
RF 99
Human image recognition
1
0.075
0.791
0.622
RF 49
Image acquisition devices using face detection
0.009
1
0.708
0.572
RF 52
Gesture image processing
0.309
0.149
0.708
0.389
RF 51 RF 1
Facial image processing Detecting DNA
0.222 0.034
0.112 0.006
0.75 1
0.361 0.346
RF 74
Biometric authentication method
0.393
0.048
0.541
0.327
RF 48 RF 2
Image acquisition devices using face detection Fingerprint recognition using sensors
0.014 0.007
0.238 0.357
0.708 0.416
0.320 0.260
RF 56
Automatic recognition by tracking method
0
0.304
0.416
0.240
RF 87
Facial feature selection
0.066
0
0.541
0.202
RF 7
Hand characteristic information
0.251
0.013
0.5
0.255
Sustainability 2018, 10, 4055
20 of 33
Table 12. Recently emerging outlier identification from patents.
Title of Recently Emerging Outlier (Patent)
II
MI
Mean
Deletion gestures on a portable multifunction device
0.007
1
0.503
Architecture for controlling a computer using hand gestures Illumination detection using classifier chains
1 0.363
0 0.529
0.5 0.446
Image processing method using sensed eye position
0.003
0.823
0.413
Fixed codebook searching apparatus and fixed codebook searching method Event recognition Real-time face tracking with reference images Synchronization system and method for audiovisual programmes associated devices and methods Multi-dimensional disambiguation of voice commands Systems and methods for interactively accessing hosted services using voice communications
0 0.146 0.169
0.823 0.588 0.529
0.411 0.367 0.349
0.007
0.588
0.298
0.272
0.294
0.283
Keywords Deletable, gesture, detection, touch sensitive, multifunction Gesture, image, control, recognition, hand Face, illumination, condition, correct Capture, detection, eye, face, graphic, capture Impulse, codebook, processor, apparatus Recognizes, gesture, determination Face, determination, relative, movement Recognition, synchronization, audiovisual, detection Action, audio, select, identifying
0.003
0.529
0.266
Voice, convert, identified, recognition
Sustainability 2018, 10, 4055
21 of 33
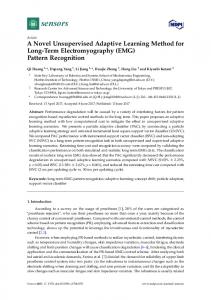
5. Discussion 5.1. Promising Research Frontiers with the Proposed Model and the Gartner’s Hype Cycle In terms of Proposition 1 on identifying promising research frontiers through a quantitative approach using technological documents, the predicted results based on data from 2005 to 2014 by the proposed model are compared to the results derived from the hype cycle for emerging technologies in 2015 [13], which is a graphical presentation developed by Gartner, the American IT research and advisory firm. The hype cycle provides five phases to present the maturity of emerging technologies, which are innovation trigger, peak of inflated expectations, trough of disillusionment, slope of enlightenment, and plateau of productivity. We matched the technologies related to facial expression recognition to affective computing technology on the hype cycle, biometric recognition relevant technologies to brain-computer interface (BCI) and biochips technology on the hype cycle, the voice recognition relevant technologies to speech-to-speech translation and natural language question answering on the hype cycle, and image recognition on human action to gesture control technology on the hype cycle. Tables 13 and 14 show the matched results. Both Tables suggested five phases of the hype cycle, matched technologies on the hype cycle, years to mainstream adoption that was proposed in the hype cycle, RF title, type of RF, and RF rank based on promising score among the total RFs. The promising research frontiers predicted through the proposed method using data from 2005 to 2014 were well-matched to the emerging technologies for 2015 that were provided by Gartner’s hype cycle, which can be considered as an expert-based quantitative approach, in both papers and patent perspectives. The 18 promising RFs were matched to technologies on the hype cycle among 22 promising RFs in terms of scientific papers. The four RFs that were not matched were the fingerprint and vein relevant research themes. The 13 promising RFs were matched to technologies on the hype cycle among 21 promising RFs in terms of patents. The eight RFs that were not matched included high ranked and neutral or persistently emerging RFs, such as fingerprint and hand characteristic recognition, and low ranked but recently emerging RFs, such as vein recognition and biometric sensor research themes. From the scientific paper perspective, the predicted 9 RFs among the top 10 RFs based on the promising score were matched, and from the patent perspective, 7 RFs among the top 10 RFs were matched. All matched RFs based on scientific papers were ranked in the top 20 promising score, whereas 11 RFs based on patents, which excepted 2 RFs among the 13 matched RFs, were ranked in the top 20. Most of the high ranked RFs had a tendency to be matched in the innovation trigger phase, DNA and RNA pattern recognition technology relevant RFs were matched to BCI and biochips, whose years to mainstream adoption were more than 10 year or 5 to 10 years from the scientific paper perspective, whereas the RFs related to affective computing technology whose years to mainstream adoption were 5 to 10 years were relatively more located in the innovation trigger phase from the patent perspective. However, they differed in that the RFs from scientific papers tend to be located in the innovation trigger and peak of the inflated expectation phases, whereas the RFs from patents tend to be located in the innovation trigger and slope of the enlightenment phases. Figure 3 compares the results of the predominant technologies in terms of the perspectives of papers and patent. The proposed promising research frontiers suggest the micro-level of research topics than the emerging technologies in Gartner’s hype cycle shown in Tables 13 and 14. For example, there are many RFs with specific titles that are related to DNA or RNA sequencing and pattern recognition (relatively micro-level topics) are suggested in regard to BCI and biochips (macrolevel topic) in the hype cycle. It can offer more micro-level information for strategic R&D planning for future promising technology because the suggested method is a bottom-up approach based on core technological documents.
Sustainability 2018, 10, 4055
22 of 33
Figure 3. Pattern recognition relevant technologies on Gartner’s hype cycle (Source: Burton and Walker, 2015).
Sustainability 2018, 10, 4055
23 of 33
Table 13. Results of matched promising RFs from scientific papers in Gartner’s hype cycle. 5 Phases in Gartner’s Hype Cycle
Matched Technologies
Years to Mainstream Adoption
RF No. RF 415
Affective computing
5 to 10 years
RF 417 RF 416 RF 30 RF 1
More than 10 years/5 to 10 years
Speech-to-speech translation/Natural-language question answering
2 to 5 years/5 to 10 years
RNA pattern recognition
RF 17
DNA methylation patterns
RF 13 RF 31 RF 29
Nanoscale DNA-polymer micelles RNA recognition motif protein HPV DNA detection
RF 254
Robust speech recognition algorithm
RF 410 RF 93
Peak of inflated expectation/Trough of disillusionment
Patterns of feature space, correlation, classification for face recognition Face recognition method under lighting or color condition DNA Sequencing, and cancerous DNA Recognition
RF 10
RF 20 Brain computer interface/Biochips
Analytic techniques for face recognition
The pattern of distribution of amino groups for RNA recognition DNA microarray-based detection Detection of actionable genomic alterations Cognition, action, and object manipulation RNA sequencing
RF 16
Innovation trigger
RF Title
RF 272
Speech recognition by bilateral cochlear implant users Study on voice recognition
RF 257
Slope of enlightenment
Gesture control
2 to 5 years
RF 92
Human action and gesture recognition
-
-
-
RF 2
Fingerprint recognition using modelbased density map
-
-
-
RF 6
Detection of latent fingerprints
-
-
-
RF 33
Sclera Vein Recognition
-
-
-
RF 35
Optimal extraction and fingerprint analysis
Type of RF Persistently emerging RF Persistently emerging RF
Rank 7 13
Neutral RF
17
Neutral RF
1
Persistently emerging RF
3
Neutral RF
5
Neutral RF
6
Neutral RF
8
Persistently emerging RF Neutral RF Persistently emerging RF Neutral RF Neutral RF Neutral RF Persistently emerging RF Persistently emerging RF Neutral RF Persistently emerging RF Persistently emerging RF Persistently emerging RF Recently emerging RF Recently emerging RF
9 11 15 18 19 20 10 12 14 2 4 16 27 34
Sustainability 2018, 10, 4055
24 of 33
Table 14. Results of matched promising RFs from patents in Gartner’s hype cycle. 5 Phases in Gartner’s Hype Cycle
Matched Technologies
Affective computing
Years to Mainstream Adoption
5 to 10 years
Innovation trigger
Peak of inflated expectation/Trough of disillusionment
Slope of enlightenment
RF No.
RF title
RF 49
Image acquisition devices using face detection
RF 45
Automatic face detection
RF 51
RF 87
Facial image processing Image acquisition devices using face detection Facial feature selection
RF 90
Facial decoding method
RF 175
Multi angle face recognition
RF 48
RF 1
Detecting DNA Biometric authentication method
Brain computer interface/Biochips
More than 10 years/5 to 10 years
RF 74
Speech-to-speech translation/Naturallanguage question answering
2 to 5 years/5 to 10 years
RF 699
Voice control method
RF 52
Gesture image processing Automatic recognition by tracking method
Gesture control
2 to 5 years
RF 56 RF 237
Recursive motion recognition Human image recognition Fingerprint recognition using sensors
-
-
-
RF 99
-
-
-
RF 2
-
-
-
RF 7
Hand characteristic information
-
-
-
RF 63
Displaying view for recognition
-
-
-
RF 8
Vein pattern detection
-
-
-
RF 12
Biometric sensor device for fingerprint
-
-
-
RF 154
Image discriminating method
-
-
-
RF 20
Blood vessel recognition for treat
Type of RF Neutral RF Recently emerging RF Neutral RF
Rank 2 3 5
Neutral RF
8
Neutral RF Recently emerging RF Recently emerging RF Neutral RF
12
Neutral RF
7
Recently emerging RF
42
Neutral RF
4
Neutral RF
11
Recently emerging RF Neutral RF Neutral RF Persistently emerging RF Recently emerging RF Recently emerging RF Recently emerging RF Recently emerging RF Recently emerging RF
18 39 6
19 1 9 10 14 33 36 37 43
Sustainability 2018, 10, 4055
25 of 33
5.2. Comparison of the Promising Research Frontiers from Scientific Papers and Patents
Regarding Proposition 2 on the difference between the results of promising research frontiers derived from scientific papers and patents, the academic papers account for high proportion in the order of persistently emerging RF, neutral RF, and recently emerging RF; whereas from the technological perspective, patents account for high proportion in the order of neutral RF, recently emerging RF, and persistently emerging RF shown in Tables 7 and 10. The rate of persistently emerging RFs from the results of scientific papers was 7.5 times higher than that from the results of patents, whereas the rate of recently emerging RFs from the results of patents was 15 times higher than that from the results of scientific papers. The differences can be interpreted by referring to the nature of scientific research and patents. Academic research has the characteristics of persistent momentum because collective efforts are invested to build a theoretical foundation for future research. However, since a new trial is critical in patents to develop a leading-edge technology and avoid the legal right of existing patents, the recently emerging RFs should be emphasized. It is consistent with the results of the previous research that analyzed scientific papers and patents in solar cell technology field in that scientific articles tended to include more basic research, whereas patents focused on applied and industrial technology [30,54]. For the comprehensive understanding with the results matched to Gartner’s hype cycle, the results from scientific papers propose promising RFs that have relatively long years to mainstream adoption periods. The proposed method using scientific papers is appropriate to propose the promising research themes of research and development (R&D) with a long-term perspective. However, the results from patents suggest promising RFs that have relatively short years to mainstream adoption periods. Thus, the proposed method using patents is proper to suggest promising themes for the R&D with a short-term perspective. The fact that scientific knowledge provides a fundamental basis for technology-oriented innovation, which consists of three main layers such as science, technology, and industry, is widely accepted [54]. This linear model explains that scientists and engineers in the research lab create the seeds of innovation, companies take up these seeds, develop technologies, and introduce them into production although this linear model is often criticized because there are many attempts to flexible technological collaborations between universities and firms in order to reduce uncertainty and risk of the R&D project [14]. The results of this research are partially supported by the linear model in that the RFs from scientific papers tend to play seeds of innovation with a long-term perspective of R&D whereas RFs from patents are related to applied technology in the short-term perspective. However, it is also partially supported by a flexible innovation model because the results are shown in results from both technological documents. Several implications on the RFs of scientific papers and patents can be discussed in order to utilize the results. First, considerable RFs such as fingerprint recognition and face detection-related technology appear in both academic and practical worlds. Such commonly emerging areas should be regarded as a definitely promising technology category. Second, most RFs identified from the scientific papers are prior to RFs through patent analysis. However, an RF from the analysis of papers has not been realized by active patenting activities. Thus, a list of RFs which are in a persistently emerging RF for papers and simultaneously recently emerging RF for patents can be useful for research organizations to plan their technology investment. Third, a unique group of RFs that do not appear in the analysis for scientific papers but are involved in the recently emerging RFs category must be interesting to companies. Such RFs can be regarded as an emerging technology area that the academic papers related to the technology are not new. Thus, these implications can assist in implementing an effective technology strategy based on the analysis of both papers and patents. To apply the proposed method to strategic R&D planning, the process using scientific papers should be considered in advance, rather than using patents. The process based on scientific papers is proper to propose the impactful emerging technology henceforth, because the promising RFs from papers are the technologies that have a time lag to be commercialized, whereas the promising RFs from patents are the technologies that actively are applied to a product, and have high technological
Sustainability 2018, 10, 4055
26 of 33
maturity. Therefore, we suggest brief guidelines for using the method for strategic R&D planning in terms of priority. First, the promising area derived from scientific papers should be considered as the first priority. Second, recently emerging RFs should be preferentially taken into account, rather than neutral RFs and persistently emerging RFs. Finally, the promising area derived from patents can be considered when the RF is in the recently emerging RF group, and commonly emerged in the areas from the analysis of scientific papers. 6. Conclusions A quantitative methodology for detecting promising research areas is proposed in this research, using bibliometric analysis based on both scientific papers and patents. The indices for evaluating technological documents, research organizations, and research frontiers are suggested using bibliographic information, by reflecting the characteristics of both scientific papers and patents. The proposed indices were developed by considering the attributes of promising technologies, such as fast recent growth, change to something new, market potential, and science-based innovation. The research frontiers are suggested by the Girvan and Newman clustering algorithm. The proposed method was applied to pattern recognition technology for illustration. The results of the proposed promising research frontiers are compared to the results of the hype cycle proposed by Gartner in order to confirm the Proposition 1 while the results of scientific papers and patents are compared in regard to the Proposition 2. There are several findings from the results applying the model. First, the results derived from scientific papers can be utilized for suggesting themes for the research (R) of R&D, whereas the results derived from patents are proper to provide themes for the development (D) of R&D. Second, the rate of recently emerging RFs derived from patents is much higher than that derived from scientific papers, whereas the rate of persistently emerging RFs derived from scientific papers is much higher than that derived from patents. Third, the predicted promising RFs were well-matched to technologies on the Gartner’s hype cycle. The RFs from scientific papers have a tendency to locate in the innovation trigger and peak of the inflated expectation phases, whereas the RFs from patents tend to be located in the innovation trigger and slope of the enlightenment phases. The proposed method and results can be utilized in various ways. First, the results and method can be utilized to build strategies for collaborative R&D between universities and firms because it is the method considering both academic and industrial sides. Second, an R&D policy maker can utilize it as an objective reference data and a supporting tool for decision making on a policy of promising technology. Third, this method can be appropriate for small and medium-sized enterprises which have relatively lower capability to discover new technological opportunities by domain experts compared to large companies. Overall, this study makes the following contributions. First, in the perspective of data utilization, a quantitative approach is suggested by using both scientific papers and patents as data for an academic and technology perspective respectively. In the process of data collection, several limitations were overcome. First, data was extracted by the annual rate of total data to prevent biased extraction of data. Second, the recent results of research by leading research groups are added to the extracted core technological document data, in order to include recent core documents. Second, from the perspective of methodology, several indices are proposed based on comprehensive understanding of the property of promising technology using bibliographic information in respective steps to evaluate technological documents and research capability of research organization, and to measure how promising the technology is. It is advantageous in that it is relatively simple to apply them to practice compared to using complicated data analytic methods such as citation-based analysis and network analysis. However, it has a limitation that the correlation check among indices was not thoroughly conducted, although the indices are developed based on different perspectives using different bibliographic information. In addition, in terms of clustering technological documents, the ambiguity of the number of clusters can be solved by using the modularity of GirvanNewman clustering. Finally, in the perspective of the utilization of the results, the results show
Sustainability 2018, 10, 4055
27 of 33
reliability because it was well matched to the hype cycle and consistency with the results and findings of the previous studies. Although this research proposed a new approach to identifying promising technology, this paper has limitations. First, this paper briefly mentioned that recently emerging outlier documents can be considered as a weak signal for promising research themes in terms of novelty. However, although they can be a candidate for promising technology, we did not investigate the contents of outliers in detail. Second, in the process of adding technological documents of leading research organizations, the criteria to select the number of leading organizations and the cut-off value of paper quality are dependent on the domain experts. Even though this paper provided a rationale for the criteria, more robust criteria need to be suggested. Thus, future research can explore promising research themes based on outliers by extending the in-depth analysis. Furthermore, more sophisticated analysis such as sensitivity analysis on the criteria for the analysis on leading research organizations can improve the validity of the proposed approach. Author Contributions: Research design, I.P. and B.Y.; Methodology, I.P. and B.Y.; Data analysis, I.P.; Investigation, I.P.; Funding acquisition, B.Y.; Writing–original draft, I.P.; Writing–review & editing, I.P. and B.Y. Funding: This work was supported by Global Research Network program through the Ministry of Education of the Republic of Korea and the National Research Foundation of Korea (NRF-2016S1A2A2916222). Conflicts of Interest: The authors declare no conflicts of interest.
Sustainability 2018, 10, 4055
28 of 33
Appendix A Table A1. Searching queries for scientific paper and patent on pattern recognition. Upper Classification
Middle Classification
Lower Classification DNA recognition
Biometric recognition
Biometric recognition
Vein recognition Fingerprint recognition Iris recognition
Object recognition
Image recognition
Object recognition Human detection and trace
Human recognition
Face recognition Action and gesture recognition
Voice recognition
Utterance recognition
Isolated language recognition
Patent Searching Query TI = (Recogni* or Cogni* or Realiz* or Perce* or Sens* or detect*) and (DNA* or RNA*)) and AB = ((Recogni* or Cogni* or Realiz* or Perce* or Sens* or detect*) and (DNA* or RNA*)) and (RD >= 20050101 and RD = 20050101 and RD = 20050101 and RD = 20050101 and RD = 20050101 and RD = 20050101 and RD = 20050101 and RD = 20050101 and RD = 20050101 and RD = 20050101 and RD = 20050101 and RD