Defence Science Journal, Vol. 61, No. 5, September 2011, pp. 479-484 2011, DESIDOC
Image Fusion Technique using Multi-resolution Singular Value Decomposition V.P.S. Naidu National Aerospace Laboratories, Bengaluru- 560 017 E-mail:
[email protected] Abstract A novel image fusion technique based on multi-resolution singular value decomposition (MSVD) has been presented and evaluated. The performance of this algorithm is compared with that of well known image fusion technique using wavelets. It is observed that image fusion by MSVD perform almost similar to that of wavelets. It is computationally very simple and it could be well suited for real time applications. Moreover, MSVD does not have a fixed set of basis vectors like FFT, DCT and wavelet etc. and its basis vectors depend on the data set. Keywords: Multi-sensor image fusion, multi-resolution SVD, image fusion performance evaluation metrics
1. Introduction Multi-sensor image fusion (MIF) is a technique to merge the information content from several images (or acquired from different imaging sensors) taken from the same scene in order to accomplish a combined image that contains the finest information coming from the different original source images1. Hence, the fused image would provide superior quality image than any of the original source images. Recently, MIF has become as a new and promising research area for image processing community. The benefiting fields from MIF are viz. surveillance, military, remote sensing, machine vision, computer vision, robotic and medical imaging etc. Depending on the merging stage, MIF could be performed at three different levels viz. pixel level, feature level and decision level2,3. In this paper, a novel pixel-level MIF is presented that represents a fusion process generating a single combined image containing an additional description than individual source image. The basic MIF is to take the mean of the grey level registered images pixel by pixel. This technique produces several undesired effects and reduced feature contrast. To overcome these problems, multi-resolution techniques such as wavelets1,4-12, multi-scale transforms like image pyramids3,13-16, signal processing techniques like spatial frequency17, statistical signal processing18,19 and fuzzy set theory20 have been proposed and studied extensively. Discrete wavelet transform would provide directional information in decomposition levels and contain unique information at different resolutions and hence it is used for image fusion by many scholars4,5. In this paper, a novel MIF technique based on multi-resolution singular value decomposition (MSVD) is presented to fuse the source images. The results obtained with MSVD are compared with wavelet based image fusion. The wavelet used in this is Daubechies 2 (db2). One of the important prerequisites to be able to apply fusion technique is the image registration i.e., the information in the source images needed to be adequately aligned and
registered prior to fusion of the images. In this paper, it is assumed that the images to be fused are already registered. 2. Multi-resolution Singular Value Decomposition Multi-resolution singular value decomposition is very similar to wavelets transform, where signal is filtered separately by low pass and high pass finite impulse response (FIR) filters and the output of each filter is decimated by a factor of two to achieve first level of decomposition. The decimated low pass filtered output is filtered separately by low pass and high pass filter followed by decimation by a factor of two provides second level of decomposition. The successive levels of decomposition can be achieved by repeating this procedure. The idea behind the MSVD is to replace the FIR filters with singular value decomposition (SVD)21. 2.1 1D Multi-resolution Singular Value Decomposition Let X = [x(1), x(2),..., x( N ) ] represent a 1D signal of length N and it is assumed that N is divisible by 2K for K ≥ 1 21-26 . Rearrange the samples in such a way that the top row contains the odd number indexed samples and the bottom row contains the even number indexed samples. Let the resultant matrix called data matrix is: x(1) x(3) x( N − 1) X1 = x( N ) x(2) x(4) Denote the scatter matrix
(1)
T1 = X 1 X 1T
(2)
Let U1 be the eigenvector matrix that brings T1 into diagonal matrix as: 2 U1T TU 1 1 = S1
(3)
Received 11 November 2010, Revised 10 June 2011, published online 2 September 2011
479
Def SCI J, Vol. 61, No. 5, SEPTEMBER 2011
s (1) 2 S12 = 1 0 The diagonal matrix
0 s2 (1) 2 contains the
T1=X 1 X 1T =U 1 S12U 1T (12) where the singular values are arranged in decreasing
squares of the singular values, with s1 (1) > s2 (2) . Let Xˆ 1 = U1T X 1 so that X 1 = U1 Xˆ 1 (4) The top row of Xˆ 1 , denoted Xˆ 1 (1,:) contains approximation component that corresponds to the largest eigenvalue. The bottom row of Xˆ 1 , denoted Xˆ 1 (2,:) contains detail component that corresponds to the smallest eigenvalue. Let Φ1 = Xˆ 1 (1,:) and Ψ1 = Xˆ 1 (2,:) represent the approximation and detail components respectively. The successive levels of decomposition repeats the procedure described above by placing the approximation component Φ1 in place of X. The above outlined procedure can be described formally. This procedure can be repeated recursively K times. Let Φ 0 (1,:) = X so that the initial approximation component is the original signal. For each level l, the approximation component vector Φ l has N l = N / 2l elements that are represented as: Ö l = [ö l (1), ϕl (2),...,ö l (N l ) ]
(5)
The K level MSVD for l = 1, 2,..., K − 1 as follows: ϕ (1) ϕl −1 (3) ϕl −1 (2 N l − 1) X l = l −1 ϕl −1 (2) ϕl −1 (4) ϕl −1 (2 N l )
scan manner or in other words proceeding downwards first and then to right. The eigen-decomposition of the 4 × 4 scatter matrix is:
order as s1 (1) ≥ s2 (2) ≥ s3 (3) ≥ s4 (4) Let Xˆ 1=U 1T X 1 . The first row of Xˆ 1 corresponds to the largest eigenvalue and considered as approximation component. The remaining rows contain the detail component that may correspond to edges or texture in an image. The elements in each row may be rearranged to form M / 2 × N / 2 matrix. Before proceeding to next level of decomposition, let Φ1 denote M / 2 × N / 2 matrix formed by rearranging the row Xˆ 1 (1,:) into matrix by first filling in the columns and then rows. Similarly, each of the three rows Xˆ 1 (2,:) , Xˆ 1 (3,:) and Xˆ 1 (4,:) may be arranged into M / 2 × N / 2 matrices that are denoted as Ψ1V , Ψ1H and Ψ1D respectively. The next level of decomposition proceeds as above where X is replaced by Φ1 . The complete L level decompositions may be represented as:
{
{
X → Φ L , ΨVl , Ψ lH , Ψ lD
}
L
L
, {U l }l =1
}
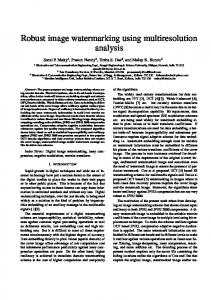
(13) The original image Xcan be reconstructed from the right hand side, since the steps are reversible. Figure1 shows the 2D structures of the MSVD with three decomposition levels. l =1
(6)
Tl = X l X lT = U l Sl2U lT , where singular values to be arranged as sl (1) ≥ sl (2)
(7)
Xˆ l = U lT X l
(8)
Φ l = Xˆ l (1,:)
(9)
Ψ l = Xˆ l (2,:) (10) In general, it is sufficient to store the lowest resolution approximation component vector Φ L , the details component vectors Ψ l for l = 1, 2,..., L and the eigenvector matrices U l for l = 1, 2,..., L . Hence the MSVD can be written as:
{
X → ΦL ,
{Ψ l }l =1 , {U l }l =1} L
L
(11) The original signal X can be reconstructed from the right hand side, since the steps are reversible. 2.2 2D Multi-resolution Singular Value Decomposition 1D multi-resolution singular value decomposition (MSVD) described in section 2.1 can be easily extended to 2D MSVD and even for higher dimensions. The first level decomposition of the image proceeds as follows. Divide the M × N image X into non-overlapping 2 × 2 blocks and arrange each block into a 4 × 1 vector by stacking columns to form the data matrix X 1 . The blocks may be taken in transpose raster480
Figure 1. Multi-resolution decomposition structures.
3. Fusion The schematic diagram for the MSVD image fusion scheme is shown in Fig. 2. One can observe that the modification of the present scheme is the use MSVD instead of wavelets or pyramids. The images to be fused I1 and I2 are decomposed into L (l = 1, 2,..., L) levels using MSVD. At each decomposition level (l = 1, 2,..., L) , the fusion rule will select
Naidu: Image Fusion Technique using Multi-resolution Singular Value Decomposition
Figure 2. Schematic diagram for the MSVD image fusion scheme.
the larger absolute value of the two MSVD detailed coeficients, since the detailed coefficients correspond to sharper brightness changes in the images such as edges and object boundaries etc. These coefficients are fluctuating around zero. At the coarest level (l = L) , the fusion rule take average of the MSVD approximation coefficients since the approximation coefficents at coarser level are the smoothed and subsampled verion of the original image. Similalrly, at each decomposition level (l = 1, 2,..., L) , the fusion rule take the average of the two MSVD eigen matrices. The fused image If can be obtained using : If ←
{Φ ,{ Ψ , f
L
f
V l
f
Ψ lH , f Ψ lD
} , {U } L
L
f
l
l =1
l =1
}
(14)
4. Performance Evaluation The performance of image fusion algorithms can be evaluated when the reference image is available using the following metrics: 4.1 Root Mean Square Error It is computed as the root mean square error (RMSE) of the corresponding pixels in the reference image Ir and the fused image If . It will be nearly zero when the reference and fused images are alike and it will increase when the dissimilarity increases27. RMSE =
1 M N ∑∑ I r ( x, y) − I f ( x, y) MN x =1 y =1
(
)
2
(15)
4.2 Peak Signal to Noise Ratio 2 L PSNR = 20log10 1 M N 2 ∑∑ (I r ( x, y) − I f ( x, y) ) MN x =1 y =1 (16) where, L in the number of gray levels in the image This value will be high when the fused and reference images are alike and higher value implies better fusion28,29. 4.3 Spectral Information Divergence The spectral information divergence (SID) can be computed as
SID( I t , I f ) = D( I t || I f ) + D( I f || I t )
(18)
where, D( I t || I f ) = I t log( I t / I f ) , the values of I t and I f should be in between 0 and 1 D( I f || I t ) = I f log( I f / I t ) The ideal value is zero and it will increase when there is a spectral divergence. The following metrics could be used when the reference image is not available to test the performance of the fused algorithms. 4.4 Standard Deviation (SD) Standard deviation is composed of the signal and noise parts28,30. This metric is more efficient in the absence of noise. It measures the contrast in the fused image. Fused image with high contrast would have a high standard deviation. σ=
L
∑ (i - i )2 hI i =0
f
(i ) ,
L
i = ∑ ihI f
(19)
i =0
where, hI f (i ) is the normalised histogram of the fused image I f ( x, y ) . 4.5 Spatial Frequency (SF) Spatial frequency can be computed as28,31,32: SF= RF 2 +CF 2 where, row frequency (RF) RF =
(20)
1 M N [ I f ( x, y ) - I f ( x, y -1)]2 ∑∑ MN x =1 y =2
column frequency (CF) 1 N M ∑∑ [I f (x,y)-I f (x-1,y)] 2 MN y=1 x=2 It indicates the overall activity level in the fused image. The fused image with high activity level would have high spatial frequency. CF=
5. Results and Discussion National Aerospace Laboratories (NAL) indigenous aircraft (SARAS), shown in Fig. 3(a), is considered as a 481
Def SCI J, Vol. 61, No. 5, SEPTEMBER 2011
reference image I r to evaluate the performance of the proposed fusion algorithm. The complementary pair (data set1) input images I1 and I 2 are taken to evaluate the fusion algorithm and these images are shown in Fig. 3(b) and 3(c). The first column in Figs. 4-7 shows fused images and the second column shows the error images. The error is computed as I e ( x, y ) = I r ( x, y ) − I f ( x, y ) . The fused and error images by one level of decomposition using MSVD and wavelet fusion algorithms are shown in Figs. 4 and 5, respectively.
Similarly the fused and error images by two levels of decomposition using MSVD and wavelet are shown in Figs. 6 and 7, respectively. It is observed that the fused images of both MSVD and wavelet are almost similar for these images. The reason could be because of taking the complementary pairs. One can see that the fused image preserves all useful information from the source images. The performance metrics for evaluating the image fusion algorithms are shown in Table 1. The metrics showed in tables in bold font are better among
Figure 3. Reference and source images–data set1. (a) reference image Ir; (b) first source image I1; (c)second source image I2.
Figure 4. Fused and error image with one level (L=1) of decomposition using MSVD.
Figure 6. Fused and error image with two levels (L=2) of decomposition using MSVD.
482
Figure 5. Fused and error image with one level (L=1) of decomposition using wavelets.
Figure 7. Fused and error image with two levels (L=2) of decomposition using wavelets.
Naidu: Image Fusion Technique using Multi-resolution Singular Value Decomposition
others. From the tables it is observed that MSVD with higher level of decomposition performed well. Spectral information divergence (SID) shows that fusion wavelet with one level of decomposition gives good results and it is contradictory with other fusion quality evaluation metrics. The execution time of each algorithm is also shown in Table 1. Fusion with wavelet takes less time than MSVD since the former algorithm was developed using Matlab inbuilt functions. In second data set, forward looking infrared (FLIR) image (left) and low light television (LLTV) image (right) are considered for evaluation of the fusion algorithms (data set2)33 and are shown in Fig. 8. Roads appear very clear in FLIR
image since the roads are high thermal contrast. Trees and light spots appear in LLTV image. The fused images by MSVD (left) and wavelets (right) with one level of decomposition and second levels of decomposition are shown in Fig. 9 and Fig. 10 respectively. The fused image preserves all the useful information from the LLTV and FLIR images. Performance metrics are shown in Table 2. It is observed that fusion by MSVD shows better performance than wavelets. 6. Conclusion A novel image fusion algorithm by MSVD has been presented and evaluated. The performance of this algorithm
Table 1. Performance evaluation metrics–data set1. Levels of L=1 L=2
Algorithm
with reference image
without reference image PSNR
SD
SF
Execution time (s)
RMSE
SID
MSVD
10.1336
6.8 x 10⁻⁴
38.1072
52.4543
15.1229
1.141
wavelets
10.3674
0
38.0081
52.2394
14.2421
0.539
MSVD
8.5844
0.0399
38.8277
53.5597
18.0584
1.421
wavelets
8.8212
0.0269
38.7095
53.1383
17.2342
0.625
Figure 8. (a) FLIR and (b) LLTV source images to be fused – data set 2.
Figure 9. Fused images with one level (L=1) of decomposition using (a) MSVD and (b) wavelets. Table 2. Performance evaluation metrics – data set2. Levels of decomposition L=1 L=2
Figure 10. Fused images with two levels (L=2) of decomposition using (a) MSVD and (b) wavelets.
Algorithm
without reference image SD
SF
48.10
16.21
wavelets
47.82
14.95
MSVD
49.15
18.52
wavelets
48.54
17.08
MSVD
is compared with well known image fusion technique by wavelets. It is concluded that image fusion by MSVD perform almost similar to wavelets. It is computationally very simple and it could be well suited for real time applications. Moreover, MSVD does not have a fixed set of basis vectors like FFT, DCT and wavelet etc. and its basis vectors depend on the data set. 483
Def SCI J, Vol. 61, No. 5, SEPTEMBER 2011
References 1. Pajares, Gonzalo & Manuel, Jesus de la Cruz, A waveletbased image fusion tutorial, Pattern Recognition, 2007, 37, 1855-872. 2. Varsheny, P.K., Multisensor data fusion, Elec. Comm. Engg., Journal, 1997, 9(12), 245-53. 3. Burt, P.J. & Lolczynski, R.J. Enhanced image capture through fusion, In Proc. of 4th International Conference on Computer Vision, Berlin, Germany, 1993, 173-82. 4. Mallet, S.G. A theory for multiresolution signal decomposition: The wavelet representation. IEEE Trans. Pattern Anal. Mach. Intel., 1989, 11(7), 674-93, 1989. 5. Wang, H.; Peng, J. & W. Wu. Fusion algorithm for multisensor image based on discrete multiwavelet transform, IEE Pro. Vis. Image Signal Process, 2002, 149(5). 6. Li, H.; Manjunath, B.S. & Mitra, S.K. Multisensor image fusion using wavelet transform, graph. models image process, 1995, 57(3), 235-45. 7. Pu. T. & Ni, G. Contrast-based image fusion using discrete wavelet transform. Optical Engineering, 2000, 39(8), 2075-2082. 8. Yocky, D.A. Image merging and data fusion by means of the discrete two-dimensional wavelet transform. J. Opt. Soc. Am. A, 1995, 12(9), 1834-841. 9. Nunez, J.; Otazu, X.; Fors, O.; Prades, A.; Pala, V. & Arbiol, R. Image fusion with additive multiresolution wavelet decomposition: applications to spot1 landsat images. J. Opt. Soc. Am. A, 1999, 16, 467-74. 10. Rockinger, O. Image sequence fusion using a shift invariant wavelet transform. In Proceedings of IEEE Int. Conf. on Image Processing, 1997, 13, 288-91. 11. Qu, G.H.; Zang, D.L. & Yan P.F. Medical image fusion by wavelet transform modulus maxima. J. of the Opt. Soc. of America, 2001, 9, 184-90. 12. Chipman, L.J.; Orr, T.M. & Graham, L.N. Wavelets and Image fusion. In Proceedings SPIE, 1995, 2529, 208-19. 13. Jahard, F.; Fish, D.A.; Rio, A.A. & Thompson, C.P. Far/near infrared adapted pyramid-based fusion for automotive night vision. In IEEE Proc. 6th Int. Conf. on Image Processing and its Applications (IPA97). 1997, 886-90. 14. Ajazzi, B.; Alparone, L.; Baronti, S. & Carla, R. Assessment pyramid-based multisensor image data fusion. In Proceedings SPIE, 1998, 3500, 237-48. 15. Akerman, A. Pyramid techniques for multisensory fusion. In Proc. SPIE, 1992, 2828, 124-31. 16. Toet, A.; Van Ruyven, L.J. & Valeton, J.M. Merging thermal and visual images by a contrast pyramid. Optical Engineering, 1989, 28(7), 789-92. 17. Shutao Li; Kwok, James T. & Wang, Yaonan. Combination of images with diverse focuses using the spatial frequency. Information fusion, 2001, 2(3), 167-76. 18. Blum, Rick S. Robust image fusion using a statistical signal processing approach. Information Fusion, 2005, 6, 119-28. 19. Yang, J. & Blum, Rick S. A statistical signal processing approach to image fusion for concealed weapon detection. In IEEE Int. Conf. on Image Processing, Rochester, NY, 2002, 513-16.
484
20. Nejatali, Abdilhossein & Ciric, L.R. Novel image fusion methodology using fuzzy set theory. Optical Engineering, 1998, 37(2), 485-91. 21. Kakarla, R. & Ogunbona, P.O. Signal analysis using a multiresolution form of the singular value decomposition. IEEE Trans. on Image Processing, 2001, 10(5), 724-35. 22. Gerbrands, J.J. On the relationships between SVD, KLT and PCA. Pattern Recognition, 1981, 14, 375-81. 23. Lung, Shung-Yung. Multi-resolution form of SVD for textindependent speaker recognition. Pattern Recognition, 2002, 35, 1637-639. 24. Ashino, R.; Morimoto, A.; Nagase, M. & Vaillancourt R. Image compression with multiresolution singular value decomposition and other methods. Mathematical and Computer Modeling, 2005, 41, 773-90. 25. Yoshikawa, M.; Ashino, R. & Vaillancourt, R. Case study on SVD multiresolution analysis. Scientific Proceedings of Riga Technical University. Boundary Field Problems and Computer Simulation, 2004, 46, 65-79. 26. Ashino, R.; Morimoto, A. Nagase, M. & Vaillancourt, R. Image compression with multiresolution singular value decomposition and other methods. CRM-2939, ibid. 01/2004. 27. Naidu, V.P.S.; Girija, G. & Raol, J.R. Evaluation of data association and fusion algorithms for tracking in the presence of measurement loss. AIAA Conference on Navigation, Guidance and Control, Austin, USA, 11-14, August 2003. 28. Naidu, V.P.S. Discrete Cosine Transform-based Image Fusion. Def. Sci. J., 2010, 60(1), 48-54. 29. Arce, Gonzalo R. Nonlinear Signal Processing – A statistical approach. Wiley-Interscience Inc., Publication, USA, 2005. 30. Blum, Rick S. & Liu, Zheng. Multi-sensor image fusion and its applications. CRC Press, Taylor & Francis Group, NW, 2006. 31. Eskicioglu, A.S. & Fisher, P.S. Image quality measures and their performance. IEEE Trans. Commu., 1995, 43(12), 2959-965. 32. Shutao Li; Kwok, James T. & Yaonan Wang. Combination of images with diverse focuses using the spatial frequency. Information Fusion, 2001, 2, 169-76. 33. http://www.imagefusion.org
Contributor Dr V.P.S. Naidu obtained M.E in Medical electronics from Anna University Chennai and PhD from University of Mysore. Presently, He is working at multi-sensor data fusion lab, National Aerospace Laboratories, Bengaluru as scientist since December 2001. His areas of interest are: multi sensor data fusion and enhanced flight vision system.