Part of the Communications in Computer and Information Science book series (CCIS, volume 192). Cite this paper as: Madhusudhan M., Malay N., Nirmala S.R., ...
Image Processing Techniques for Glaucoma Detection Mishra Madhusudhan, Nath Malay, S.R. Nirmala, and Dandapat Samerendra Indian Institute of Technology Guwahati, Department of Electronics and Electrical Engineering, Guwahati, India {m.mishra,malaya,nirmala,samaren}@iitg.ernet.in
Abstract. Glaucoma is a disease caused due to neurodegeneration of the optic nerve which leads to blindness. It can be evaluated by monitoring intra ocular pressure (IOP), visual field and the optic disc appearance (cup-to-disc ratio). Glaucoma increases the cup to disc ratio (CDR), affecting the peripheral vision loss. This paper addresses the various image processing techniques to diagnose the glaucoma based on the CDR evaluation of preprocessed fundus images. These algorithms are tested on publicly available fundus images and the results are compared. The accuracy of these algorithms is evaluated by sensitivity and specificity. The sensitivity and specificity for these algorithms are found to be very favorable. Keywords: Glaucoma risk index, cup to disc ratio, multi-thresholding, active contours, region growing segmentation.
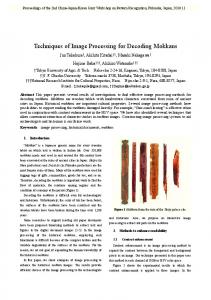
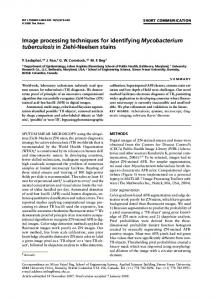
1 Introduction Glaucoma is a progressive optic neuropathy leading to visual field changes due to the damage retinal ganglion cells and axons [1]. From the survey it is found that nearly 1million Indians, age 40 and over, have glaucoma [2].With disease progression the interconnection between the photo receptors and the visual cortex is reduced. This reduces the functional capabilities of the retina and changes the size of the cup. So cup-to-disc ratio (CDR) is used for measuring glaucoma progression. Fig.1 shows how the objects are perceived by normal vision and a patient having glaucoma. Raised intra-ocular pressure (IOP) is classified as a risk factor but is not part of the definition. However it causes typical structural changes of the optic nerve head (ONH) and the nerve fiber layer affecting the visual field of the subject [3]. The structural changes are the outcome of the slowly diminishing neuroretinal rim manifesting a degeneration of axons and astrocytes of the optic nerve resulting in expansion of cup size of the optic disc, as shown in fig. 2. However blood vessels are least affected. The CDR expresses the proportion of the disc occupied by the cup and it is widely accepted index for the assessment of glaucoma [3]. For Normal eye it is found to be 0.3 to 0.5 [14] .The CDR value increases with the increase in neuro-retinal degeneration and the vision is lost completely at the CDR value of 0.8. Several methods of feature extraction from fundus images are reported in the literature [1, 3, 5, 6, 9, 10, and 11]. Techniques described in the literature for optic disk localization are A. Abraham et al. (Eds.): ACC 2011, Part III, CCIS 192, pp. 365–373, 2011. © Springer-Verlag Berlin Heidelberg 2011
366
M. Madhusudhan et al.
Fig. 1. Normal vision vs. patient having glaucoma where peripheral vision is lost.[7]
Fig. 2. Major Structures of the ONH visible in color fundus image
typically aimed at either identifying the approximate center of the optic disk or placing the disk within a specific region such as a circle or square. Lalonde et al., uses canny edge detector and Ghafar et al., uses Circular Hough-transform to detect the optic disc(OD)[5][6]. By analyzing the various local maxima in the Hough space, one can find the best fitting circular approximation of the optic disk. Walter and Klein uses color space transformation and morphological filtering for optic disk localization. Here luminance channel of hue-luminance-saturation color space is used for localizing optic disk. Then thresholding is applied to locate locus of optic disk. Precise contour is determined using green channel of RGB color space via watershed transformation. In this method slight distortion occurs due to outgoing vessels or low contrast. Youssif et al., detects OD by using the blood vessel's direction matched filter where a mask is generated [1]. The mask labels the pixels belonging to the region of interest and excludes the background for further processing. Then opening, closing and erosion are applied respectively using small kernel to obtain final ROI. These methods are based on exploiting the edge characteristics. These papers do not discuss about the glaucoma progression or classification. Bock et al., uses the concept of principal component analysis (PCA), bitsplines and fourier analysis for feature extraction and support vector machine (SVM) classifier for glaucoma predication[3]. This method attains an accuracy of 88 %. However different methods for features extraction and use of classifiers make this system more complex. Our proposed methods for glaucoma detection are simple, easy to implement and give favorable results. In this paper three different image processing techniques namely multithresholding, active contour model and region based segmentation methods are proposed for detection of glaucoma. The comparative study of these proposed techniques are done with respect to their approaches and results. The rest of this paper is organized as follows. Section 2 introduces all the three methods for glaucoma detection. Experimental results are shown in Section 3 and conclusions are presented in Section 4.
2 Proposed Methods for Glaucoma Detection In this section, we discuss our work on retinal image analysis for glaucoma detection. We have developed a scheme for automated processing and classification of the acquired images based on the usual practice in the clinic. Fig. 3 shows our proposed
Image Processing Techniques for Glaucoma Detection
367
system which follows a standard 3-step image analysis pipeline consisting of (i) preprocessing; (ii) segmentation of preprocessed image and (iii) classification based on evaluation of CDR. Three different techniques i.e. multi thresholding, active contours and region growing methods are applied for the segmentation of preprocessed fundus image in order to detect the disease by computing CDR.
Fig. 3. Processing pipeline in detail: glaucoma risk calculation comprises of steps: (i) Preprocessing of input images for eliminating disease independent variations, (ii) Segmentation of preprocessed image and (iii) Classification based on CDR for generating Glaucoma Risk Index (GRI)
2.1 Pre Processing The variations not related to the glaucoma disease are excluded from the images in a preprocessing step for emphasizing the desired characteristics. This includes variations due to image acquisition, such as inhomogeneous illumination and the blood vessels which are not directly linked to glaucoma. The main objective of preprocessing is to attenuate image variation by normalizing the original retinal image against a reference model or data set for subsequent viewing, processing or analysis [12]. The preprocessing retinal images may be classified in terms of the correction for non-uniform illumination, contrast enhancement and color normalization. 2.1.1 Illumination Correction The peripheral part of the retina often appears darker than the central region because of the curved retinal surface and the geometrical configuration of the light source and camera. These interferences affect the illumination of the ONH and would have an influence to the subsequent statistical analysis, though they are not originated through glaucoma [3]. Homogeneously illuminated fundus image is obtained by subtracting the estimated retinal background from the original image. Various techniques for illumination correction like morphological operations, homomorphic filtering and median filtering have been published in the literature [13]. We implemented a correction method based on morphological operations as it has certain advantages over other techniques. The benefits of this technique over linear approaches include direct geometric interpretation, simplicity and efficiency in hardware implementation [14]. Uniformly illuminated image is obtained by subtracting the estimated background image from original image. Morphological opening is used to estimate the background illumination. Fig.4 shows the different steps needed to obtain an illumination corrected image. Original fundus image (i) is first converted into grey image (ii) and then background is estimated (iii). Image obtained from subtracting (iii) from (ii) is added with fixed dc level to get the final illumination corrected image shown in (v).
368
M. Madhusudhan et al.
(i)
(ii)
(iii)
(iv)
(v)
Fig. 4. Result of illumination correction using morphological operations
2.1.2 Blood Vessels Removal Blood vessels are minimally affected by glaucoma disease; hence blood vessels need to be removed from the fundus images [15]. Blood vessel removal consists of two steps: (i) extraction of blood vessels and after that (ii) inpainting of extracted blood vessels. Image inpainting is the technique of filling in a region of an image based on the information outside the region [16]. The major blood vessel branches rising from the ONH hide large portions of the rim and their existence makes analysis of the visible parts of the ONH more difficult [3]. This can hinder the accurate segmentation of OD. Therefore, inpainting technique is applied to remove these blood vessel structures after the extraction blood vessels before further processing. The extracted blood vessels act as a mask and the region covered by the mask is inpainted. In this implementation, the vessel regions are filled iteratively layer by layer from outside inwards while the missing pixels get a weighted average of the already known neighboring values [17] [18]. Morphological operations are also used for removal of blood vessels from fundus image. Morphological closing consisting of dilation followed by erosion is applied to remove the blood vessels. Fig.5 shows the result of morphological operations for blood vessels removal.
(a) Fundus image
(b) Illumination corrected
(c) Blood vessels removed
Fig. 5. Result of morphological operations for blood vessels removal
Inpainting technique gives better results in comparison to morphological operations for blood vessels removal. However the major drawback of inpainting technique lies in the fact that it requires extracted vessels as the mask and iterations process increases the computational time. 2.1.3 Normalization of the ONH Region Papilla (ONH) is the most important structure for observing changes in order to detect glaucoma. It appears as an extremely bright, mostly circular region in fundus images. The image obtained after blood vessels removal is normalized for better analysis.
Image Processing Techniques for Glaucoma Detection
369
2.2 Segmentation from the Preprocessed Image The preprocessed images are used for the segmentation of optic disc and cup which helps in classification of glaucoma. In this subsection, the three different techniques for glaucoma detection are discussed. 2.2.1 Multi-thresholding Technique Multi-thresholding technique is one of the simplest methods and natural way to segment cup and disc of preprocessed fundus image. The preprocessed image containing the optic disc is converted to binary image and than multi-thresholding technique is applied. This technique allows the detection of cup, the brighter region of the optic disc with higher threshold value and the whole disc with lower threshold value. Fig.6 shows the detection of optic disc and cup from preprocessed image for glaucoma classification.
(a) Blood vessels removed
(b) Optic disc detection
(c) Cup detection
Fig. 6. Result of multi-thresholding for disc and cup detection
It has shown correct segmentation for 19 images out of 25 set of images. The accurate segmentation was not possible for rest of 6 images as the optic disc and some portions of background image have similar illumination level. The quality of original images was also one of the reasons for improper segmentation. The major demerit of the method is the manual thresholding based on the pixel intensity values. Hence other techniques like active counter method based on adaptive thresholding and region growing segmentation methods are applied for cup and disc segmentations from the preprocessed fundus image for glaucoma classification. 2.2.2 Snakes: Active Contours Method A snake is an energy minimizing spline guided by external forces and influenced by image forces that pull it toward features such as lines and edges in order to localize the object accurately [19]. Contours stops at nearby edges detecting the desired boundary, where the external energy is the minimum. Classical snakes and active contour models, uses an edge-detector, based on the gradient of the image, to stop the evolving curve on the boundary of the desired object. However in practical situations, the discrete gradients are bounded hence the stopping function is never zero on the edges, and the curve may cross the desired boundary. Therefore, we have used a different active contour model which is not based on the gradient of the image like classical methods for the stopping process but is instead related to a particular
370
M. Madhusudhan et al.
segmentation of the image [20]. Fig.7 shows the results of successful implementation of this technique, used in detecting cup and disc of fundus images for evaluation of CDR, a measure for glaucoma detection.
Fig. 7. Results of Active contour methods for cup and disc detection
2.2.3 Region Growing Segmentation Region growing is a an approach to image segmentation based on selecting initial seed points and adding neighboring pixels to the region depending on certain feature such as intensity value, color similarity[8]. In our proposed method the maximum value in the green channel image serves as the seed for the region growing algorithm to be employed in the cup identification. The neighborhood pixels are iteratively connected if they fall below a certain threshold value. The centroid of the resulting region is calculated and a disk is estimated that can circumscribe the entire region. The radius of this estimated disk is noted as the radius of the cup. The area of the cup is hence known. The disk is further grown outwards till the point when a sharp intensity change is observed. This change marks the periphery of the disk and the radius at this juncture is noted as the radius for the disk. Thus we have a disk whose area is known. The ratio of area of cup to disk is evaluated and checked and if it falls below the value of 0.5 the eye can be concluded as a healthy one. If however, the value exceeds the limit, it is concluded to be defected with glaucoma. Experimental results on a 25 number of images demonstrate the effectiveness of the technique.
3 Results and Discussions of Glaucoma Detection Techniques Based on CDR Evaluation The above discussed methods are applied to the publicly available Optic-disc databases, which consist of normal and pathological fundus images. The criteria that CDR for normal fundus images lies between 0.3-0.5 and is higher for glaucomous fundus images are used for the classification. In this section we mainly focus on the comparative approaches and results of the all three proposed systems namely multithresholding, active contour methods and region based segmentation techniques used for glaucoma classification. 3.1 Glaucoma Detection Based on Multi-thresholding The processed image obtained as discussed earlier is used to determine the CDR by finding the number of ones present in the cup region to that of number of ones in disc
Image Processing Techniques for Glaucoma Detection
371
region of binary image. CDR of 25 fundus images downloaded from www.opticdisc.org (7 normal and 18 abnormal images) is determined in order to detect glaucoma. Efficiency of the proposed method in identifying true positive and true negative is shown the column-I of the table-1. The performance measure of this method with sensitivity (classify abnormal fundus images as abnormal) of 80% and specificity (classify normal fundus image as normal) of 60 % is summarized in column-I of table-2. Table 1. Shows the comparative results of three methods namely (i) Multi-thresholding; (ii) Active contours and (iii) Region growing segmentation
SL. No. 1 2 3 4
Performance parameter True Positive True Negative False Positive False Negative
Efficiency (percentage) Method I Method II Method III 88.89 94.44 100 42.85 57.17 85.71 11.11 5.56 0 57.17 42.85 14.29
Table 2. Shows the comparative accuracy of three methods namely (i) Multi-thresholding; (ii) Active contours and (iii) Region growing segmentation
SL. No. 1 2
Accuracy parameter Sensitivity Specificity
Efficiency (percentage) Method I Method II Method III 80 89.47 94.73 60 83.33 100
3.2 Glaucoma Detection Based on Active Contour Method Active contour method is applied for detecting the cup and disc from the preprocessed fundus images as discussed in the subsection 2.2.2. Their effective radii are calculated for evaluation of CDR needed for the classification. The obtained results are found to be better in-comparison to multi thresholding technique as it is based on adaptive thresholding. Efficiency of this method in identifying true positive and true negative is shown the column-II of the table-I. The accuracy measure of this second proposed method with sensitivity and specificity of 89.47 and 83.33 % respectively is summarized in column-II of table-II. 3.3 Glaucoma Detection Based on Region Growing Segmentation Technique Region growing segmentation technique is applied to estimate radius of cup and disc from the pre processed fundus image as discussed in subsection 2.2.3. Like the other two methods, CDR evaluation was the criteria for the classification of the disease. The results obtained by this third proposed method are better compared to other two mentioned techniques as it is based on clustering of homogeneous regions. It is able to classify all eighteen abnormal images as abnormal but two images were misclassified out of seven normal images. Efficiency of this method in identifying true positive and
372
M. Madhusudhan et al.
true negative is shown the column-III of the table-I. The performance measure of this method with sensitivity and specificity of 94.73% and 100% respectively is summarized in column-III of table-II.
4 Conclusion In this paper, an efficient framework for early detection of glaucoma has been developed. The CDR, an important glaucoma parameter of fundus images publically available from messidor and optic data bases were evaluated using three different methods namely morphological operations based on multi-thresholding techniques, active contour models and region growing segmentation techniques. As a comparative study to these methods for glaucoma classification, we observed that region growing segmentation technique gives better result in comparisons to other two methods. The proposed methods are simple and easy to implement. The results obtained can be used as an initial investigation step in the automated diagnosis of glaucoma especially in the screening programs. These proposed methods may further be combined with some other techniques for achieving better results with large databases.
References 1. Youssif, A.A.-H.A.-R., Ghalwash, A.Z., Ghoneim, A.A.S.A.-R.: Optic disc detection from normalized digital fundus images by means of a vessels’ direction matched filter. IEEE Transactions on Medical Imaging 27, 11–18 (2008) 2. http://www.medindia.net/patients/patientinfo/Glaucoma.htm 3. Bock, R., Meier, J., Nyúl, L.G., Hornegger, J., Michelson, G.: Glaucoma risk index: Automated glaucoma detection from color fundus images. Medical Image Analysis 14, 471–481 (2010) 4. http://www.optic-disc.org 5. Lalonde, M., Beaulieu, M., Gagnon, L.: Fast and robust optic disc detection using pyramidal decomposition and haussdroff based template matching. IEEE Transactions on Medical Imaging 11, 1193–1200 (2001) 6. Ghafar, R.A.A., Morris, T., Ritchings, T., Wood, I.: Detection and characterization of the optic disc in glaucoma and diabetic retinopathy. In: Medical Image Understand Annual Conference, London, UK, pp. 23–24 (September 2004) 7. http://www.nei.nih.gov/ 8. Banerjee, B., Bhattacharjee, T., Chowdhury, N.: Color Image Segmentation Technique Using Natural Grouping of Pixels. International Journal of Image Processing (IJIP) 4(4), 320–328 (2010) 9. Hoover, A., Kouznetsova, V., Goldbaum, M.: Locating blood vessels in retinal images by piecewise threshold probing of a matched filter response. IEEE Transaction on Medical Imaging 19, 203–210 (2000) 10. Rangayyan, R.M., Zhu, X., Ells, A.L.: Detection of the optic nerve head in fundus images of the retina using the Hough transform for circles. Journal of Digital Imaging, 132–140 (February 2009) 11. Mendonca, A.M., Campilho, A.: Segmentation of retinal blood vessels by combining the detection of centerlines and morphological reconstruction. IEEE Transaction on Medical Imaging 25, 1200–1213 (2006)
Image Processing Techniques for Glaucoma Detection
373
12. Salvatelli, A., Bizai, G., Barbosa, G., Drozdowicz, B., Delrieux, C.: A comparative analysis of pre-processing techniques in color retinal Images. In: 16th Argentine Bioengineering Congress and the 5th Conference of Clinical Engineering. IOP Publishing Journal of Physics: Conference series, vol. 90 (2007) 13. Kubecka, L., Jan, J., Kolar, R.: Retrospective Illumination Correction of Retinal Images. International Journal of Biomedical Imaging 2010, Article ID 780262, 10 pages (2010) 14. Vanajakshi, B., Sujatha, B., Srirama, K.: A Study on Implementation of Advanced Morphological Operations. IJCSNS International Journal of Computer Science and Network Security 10(3), 6–9 (2010) 15. http://www.optic-disc.org/tutorials/glaucoma evaluation basics/page13.html 16. Criminisi, A., Pérez, P., Toyama, K.: Region Filling and Object Removal by ExemplarBased Image Inpainting. IEEE Transactions on Image Processing 13(9) (2004) 17. Bertalmio, M., Sapiro, G., Caselles, V., Ballester, C.: Image inpainting. In: Proceedings of the 27th Annual Conference on Computer Graphics and Interactive Techniques, SIGGRAPH, New Orleans, USA, pp. 417–424 (2000) 18. Meier, J., Bock, R., Michelson, G., Nyúl, L.G., Hornegger, J.: Effects of Preprocessing Eye Fundus Images on Appearance Based Glaucoma Classification. In: Kropatsch, W.G., Kampel, M., Hanbury, A. (eds.) CAIP 2007. LNCS, vol. 4673, pp. 165–172. Springer, Heidelberg (2007) 19. Kass, M., Witkin, A., Terzopoulos, D.: Snakes: Active contour models. International Journal of Computer Vision 1, 321–331 (1988) 20. Chan, T.F., Vese, L.A.: Active Contours Without Edges. IEEE Transaction on Image Processing 10(2) (February 2001)