International Journal of Automotive Technology, Vol. 8, No. 4, pp. 513 520 (2007)
Copyright © 2007 KSAE 1229 9138/2007/035 14
IMAGE PROCESSING TECHNIQUES FOR LANE-RELATED INFORMATION EXTRACTION AND MULTI-VEHICLE DETECTION IN INTELLIGENT HIGHWAY VEHICLES Y.-J. WU1), F.-L. LIAN2)*, C.-P. HUANG2) and T.-H. CHANG1) 1) Department of Civil Engineering, National Taiwan University, Taipei 10617, Taiwan, Republic of China Department of Electrical Engineering, National Taiwan University, Taipei 10617, Taiwan, Republic of China
2)
(Received 17 January 2007; Revised 5 July 2007)
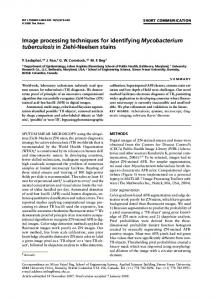
ABSTRACT In this paper, we propose an approach to identify the driving environment for intelligent highway vehicles by means of image processing and computer vision techniques. The proposed approach mainly consists of two consecutive computational steps. The first step is the lane marking detection, which is used to identify the location of the host vehicle and road geometry. In this step, related standard image processing techniques are adapted for lane-related information. In the second step, by using the output from the first step, a four-stage algorithm for vehicle detection is proposed to provide information on the relative position and speed between the host vehicle and each preceding vehicle. The proposed approach has been validated in several real-world scenarios. Herein, experimental results indicate low false alarm and low false dismissal and have demonstrated the robustness of the proposed detection approach. KEY WORDS : Driving environment identification, Image processing, Computer vision, Lane-related information, Vehicle detection and tracking
1. INTRODUCTION
2005; Yi and Lee, 2005). Meanwhile, the vehicle detection procedure not only detects the number of vehicles ahead but also acquires the relative position and speed of the preceding vehicle. In several research projects (Park et al., 2003; Tzomakas and von Seelen, 1998; Betke et al., 2000; van Leeuwen, and Groen, 2005), the authors have employed complex algorithms to comply with the objectives of driving environment identification. In this paper, the lane marking detection (in Section II) and the multiple vehicle detection (in Section III) are integrated in the framework discussed in the paper, with different image processing techniques proposed to detect target objects in these two areas. Previously, many researchers have focused on the lane marking detection and only a few on multiple vehicle detection. In this paper, the first step, that of the lane marking detection, is considered as a pre-processing step for the multiple vehicle detection. That is, the real-time information obtained in the lane marking detection is fed into the multiple vehicle detection system. In the multiple vehicle detection, a four-stage procedure is developed to identify correctly and robustly the moving objects (i.e., other vehicles) in front of the host vehicle. For experimental tests, in order to collect in real-time the situation in front of the host vehicle, a CCD camera is installed on top of the central dashboard. All the input
Transportation plays an important role in modern society. In the field of the Advanced Vehicle Control and Safety Systems (AVCSS), a subsystem of the Intelligent Transportation System (ITS), many efforts have been devoted to preventing accidents by using computer vision techniques (Srinivasa, 2002; Chang et al., 2003; Fang, 2003; Yen, 2003). As a result, computer vision can be used as a tool to assist the driver in identifying the driving environment around the host vehicle. Therefore, developing lane marking detection and multiple vehicle detection techniques on a vehicle can provide more information for a driver assistance system, autonomous highway vehicle system, or even collision warning system for decisionmaking. For the purpose of identifying the driving environment, it is necessary to first know the precise position of the host vehicle moving on the highway by means of a vision-based lane marking detection system. The threedimensional geometry and the road layout can be easily modeled. Previously, several research projects have been done in this area (Bertozzi et al., 2002; Jeong et al., 2001; Bertozzi and Broggi, 1998; Park et al., 2003; Yi et al., *Corresponding author. e-mail:
[email protected] 513
514
Y.-J. WU, F.-L. LIAN, C.-P. HUANG and T.-H. CHANG
data and computerized modules are processed in a standard computer system. Moreover, the method proposed can complement any safety decision-making systems, such as lane departure systems or collision warning systems, or simply provide the driver with instantaneous and correct information.
2. LANE MARKING DETECTION In designing an automated driving environment in an intelligent highway system, the first task is to identify the geometric location of the host vehicle and its relative position with respect to other vehicles or objects along the highway. One way to determine the location of the host vehicle is to identify the relative position between the host vehicle and the lane markings. By continuously identifying this relative position, the trajectory of the host vehicle and other related state variables can be constructed or estimated. 2.1. Defining a Searching Range A single image taken by the camera contains too much information. If the image sequence is processed directly in real time, the accuracy and efficiency requirements will not be satisfied. Hence, it is impossible for a computational unit to process all the images simultaneously. To overcome this drawback, a searching region of the original image, called region of interest (ROI) (Jeong et al., 2001), is defined. The ROI is an adjustable range determined according to the orientation of the camera mounted on the vehicle. All the image-processing techniques are then applied only within this ROI. One sample image with the search region, ROI, is shown in Figure 1. 2.2. Making Discrete Lane Markings Continuous After defining a searching region, the lane markings are identified by the image processing technique. However, the lane markings are discrete in nature; hence, for the purpose of generating one continuous vehicle trajectory, these lane markings should be further processed to form a
Figure 2. The Continuation of discrete lane markings. continuous lane marking. Referring to a lane detection method proposed by Fang (2003), the technique used in the study is first to analyze the position of the possible discrete lane markings distributed all over the ROI. The high-color image H(t) and low-color image L(t) of any three consecutive images along the ROI are computed and illustrated in Figure 2. The proposed high-color image and low-color image are defined by the following equations: H ! t " =max ! R ih, j ! t " , G ih, j ! t " , B ih, j ! t " " L ! t " =max ! R il , j ! t " , G il , j ! t " , B il , j ! t " "
(1) (2)
where R ih, j ! t " =max ! R i , j ! t " , R i , j ! t – 1 " , R i , j ! t – 2 " " G hi , j ! t " =max ! G i , j ! t " , G i , j ! t – 1 " , G i , j ! t – 2 " " B ih, j ! t " =max ! B i , j ! t " , B i , j ! t – 1 " , B i , j ! t – 2 " " R il , j ! t " =max ! R i , j ! t " , R i , j ! t – 1 " , R i , j ! t – 2 " " G li , j ! t " =max ! G i , j ! t " , G i , j ! t – 1 " , G i , j ! t – 2 " " B il , j ! t " =max ! B i , j ! t " , B i , j ! t – 1 " , B i , j ! t – 2 " " t denotes the time when the system captures the image. i and j denote the pixel coordinates (i, j) on the captured image. R h! i , j " ! t " , G h! i , j " ! t " , B h! i , j " ! t " , and R l! i , j " ! t " , Gl! i , j" ! t " , B l! i , j " ! t " , respectively, are the maximum and minimum
values of the red, green, and blue colors of the three consecutive images at coordinates (i, j). Continuation of the discrete lane markings is achieved by differentiating between the pairs of the images, the accumulated high-color and low-color images. After segmentation, the continuous lane markings are more obvious. The segmentation method will be elaborated in Section 2.3. Figure 1. Sample ROI in one grabbed image.
2.3. Segmentation In order to segment the lane and road, a technique called
IMAGE PROCESSING TECHNIQUES FOR LANE-RELATED INFORMATION EXTRACTION
515
equations for Lr and Ll could then be determined by using the information of the left- and right-line coordinates.
Figure 3. P-tile method. P-tile (Blackman, 1986) is used to determine a suitable threshold value for the lane markings. The threshold value is the mean value after adding one standard deviation of the difference image. Hence, if a normal distribution is assumed, the 67th-percentile value in the gray-level histogram of the ROI is used as the threshold. Figure 3 illustrates the gray-level histogram of the difference image in the ROI as shown in Figure 2. A threshold value of 53 is determined by the P-tile method. After the segmentation process, noisy images could appear in the searching region and might affect the correctness of recognizing lane markings. The noisy images could be further removed by the standard opening operation (Jain et al., 1995). 2.4. Line Fitting The equations of the two lines, Lr and Ll , shown in Figure 4, near the host vehicle can then be determined by the information obtained in the segmentation step. The equations are used to find the position of the geographical vanishing point. The equation of the central line, Lc, shown in Figure 4, is set as the starting point for every horizontal image. The image is scanned both to the left and to the right as far as the possible locations of the left and right lane markings, respectively, within the ROI. After marking the coordinates of the left and right lines, the least-squares method is used to construct linear models for the right- and left-line markings. That is, the least-squares method (Shapiro and Stockman, 2001) is used to fit a linear model, L(x)=ax+b. The two linear
Figure 4. The geometric diagram of the host vehicle environment.
2.5. Building the Environment for the Host Vehicle From the equations of these two lines, their intersection point, V, also called the vanishing point, can be determined. Theoretically, extending all the lines on the highway will pass through the vanishing point. In the study, the widths of all the lanes on the highway are assumed to be the same, as shown in Figure 4. The information in the point V, line Ll, and line Lr can be used to find the width, Rw. Furthermore, the equations of all other nearby line markings can be determined by extending Ll and Lr, as shown in Figure 4. Therefore, the geometry of the host vehicle environment can be built completely. Moreover, there are several important positions as shown in Figure 4 and described as follows. P is the central position of the host vehicle, Pc is the central position of the lane, Pl and Pr are the closest positions between the host vehicle and the two lines, and Lc is the equation representing the central line of the lane. 2.6. Identification of the Lateral Distance and Speed of the Host Vehicle After the host vehicle environment is built, the relationship between the host vehicle position and the center of the lane can be measured by calculating the deviation between the center points P and Pc. The lateral displacement and speed relative to the central line can be further computed. On the other hand, due to the dynamic movement of the host vehicle, unpredictable vibrations might introduce further uncertainty into the identification of the lateral displacement and speed. To resolve this situation, an # -$ filter (Blackman, 1986) is adopted to predict the lateral distance and speed for the next instant. This can be used to decrease the unstable phenomena which are caused by the vehicle vibration and to smooth the measured information. The equation of the # -$ filter for predicting information is described as follows: (3) ds ! k " = dˆ ! k | k " = d p ! k " + # d % d o ! k " d p ! k " & $ d(4) v sd ! k " = dˆ· ! k | k " = v sd ! k – 1 " + ------% do ! k " dp ! k " & qd T
Figure 5. The lateral displacement and speed to the central line of the host lane.
516
Y.-J. WU, F.-L. LIAN, C.-P. HUANG and T.-H. CHANG
d p ! k + 1 " = dˆ ! k + 1 | k " = d s ! k " + T ) v sd ! k " (5) where do ! k " is the observed relative distance at the kth scan, dp ! k " is the predicted relative distance at the kth scan, d s ! k " is the smoothed relative distance at the kth scan, v sd ! k " is the smoothed relative velocity at the kth scan, T is the sampling interval, qd is the number of scans
3.1. Pre-processing Step The raw images captured by the camera usually contain undesired noisy information. Hence, it is necessary to preprocess the images by applying a Gaussian filter to reduce the influence of undesired factors on the input images. The Sobel filter is then utilized to extract the horizontal edge of the features or objects on the images (Shapiro and Stockman, 2001). The outcome of the Sobel filter with a low threshold value forms a binary “Horizontal Edge Map” where the locations of any horizontal lines can be identified by the algorithms in next subsection.
3. MULTIPLE VEHICLE DETECTION
3.2. Primary Search Step In order to increase the processing efficiency and speed, possible locations of the vehicles in front of the host vehicle are first determined by identifying regions of possible shadows underneath the vehicles (Tzomakas and Von Seelen, 1998; Van Leeuwen, and Groen, 2005). The shape of the shadows can be assumed to be the lines perpendicular to the lane markers. Since the image viewed from the host vehicle is centered in the driving lane, these shadow lines are considered to be horizontal lines on the image. By using the lane marking information and the vanishing point property mentioned in the previous section, the image region to be processed is within the free-driving space (van Leeuwen, and Groen, 2005), a triangular area formed from these two lane markings and the bottom edge on the image. In order to segment the road and shadow underneath the vehicles in the image, an upper bound on the threshold value for the shadow regions, Thshadow, should be decided first. The threshold value is calculated based on statistics of the data within the free-driving space and the histogram of pixels within this region. The data is assumed to be Gaussian in distribution, with a mean ' and a variance (2. Furthermore, due to the variation in illumination, the threshold is modified by the following equation: Thshadow=' B*(, where B is the proposed brightness adjustment factor (' / (number of gray levels)). A sample input image is shown in Figure 7(a), where the dark triangular region is the socalled free-driving space. A histogram of the free-driving space is depicted in Figure 7(b). A dark map containing only “0” and “1” can be further constructed, where “1”
since the last measurement, and #d and $d are the filter coefficients. Figure 5 illustrates the lateral displacement (left) and speed (right) estimated by the # -$ filter where the host vehicle executes a lane change maneuver at the 240th step.
In this section, we discuss the procedure of detecting multiple vehicles in front of the host vehicle. The goal is to identify the total number of vehicles in front of the host vehicle and the relative distance and speed of the vehicles with respect to the host vehicle. The proposed procedure should first utilize the lane information obtained by the lane marking detection procedure discussed in previous section, and then apply a heuristic approach to avoid unexpected false alarms in the image-processing part. A flowchart of the multiple vehicle detection procedure is shown in Figure 6. Each step is detailed below.
Figure 6. Flow chart of multiple vehicle detection.
Figure 7. Free-driving-space.
IMAGE PROCESSING TECHNIQUES FOR LANE-RELATED INFORMATION EXTRACTION
Figure 8. Identification of possible locations of vehicles. indicates the grey-level value of the pixel is below Thshadow and the pixel is regarded as shadow. By further analyzing the characteristics of the shadow underneath the vehicle, it can be shown that the shadow is usually horizontal with a transition area from light to dark when scanning the image bottom-up. The horizontal edge map and dark map are fused together by the “AND” operation to generate a new image containing sparse binary horizontal lines that are the possible locations of shadows underneath moving vehicles (Tzomakas and von Seelen, 1998). The dots generated by undesired noise are eliminated by some binary image-processing techniques, e.g. “opening”. Note that all image-processing steps are done below the horizontal and across the vanishing point. This can further reduce the computational complexity of post-processing steps. One example output of these operations is shown in Figure 8(a). After all possible vehicle locations are identified, a rectangular region containing one vehicle can be constructed as shown in Figures 8(b) and 8(c). This region of image will be further processed by the refined search technique discussed in next section to find the contour of the vehicle. Since all the vehicles in the image sequence are moving to the Focus of Expansion, or FOE, the size of each outer rectangular region is defined based both on the geometric location of the shadow line underneath the possible vehicle in the image plane and on the lane parameters corresponding to the real world. The region possibly containing one vehicle is called a “template” and is used for vehicle tracking tasks in the future. 3.3. Refined Search Step Focusing on the possible locations of the vehicles, the next objective is to generate a refined contour inside the aforementioned rectangular region, namely a template,
517
Figure 9. Result of the edge detection. which possibly contains a vehicle. It is assumed that most vehicles in the highway have similar rectangular shapes from the perspective of the host vehicle. Hence, the Sobel edge detector is used to find both the horizontal and vertical edges. As illustrated in Figure 9, two histograms are computed by tallying the number of edges corresponding to the vertical and horizontal edges, respectively. The process of searching for the edges begins at either side of the template and progresses to the middle with the goal of selecting those larger projection values that indicate the boundary of a potential vehicle. The schemes are described as follows. • For the left boundary of the potential vehicle, search from the left to the middle of template and select the projection values above the threshold, Th left = 1--- max Histogram V _ edge ! i " |1 * i * n---
2
2
(6)
• For the right boundary of the potential vehicle, search from the right to the middle of template and select the
Figure 10. Result of the refined search step.
518
Y.-J. WU, F.-L. LIAN, C.-P. HUANG and T.-H. CHANG
projection values above the threshold,
Th right = 1--- max Histogram V _ edge ! i " | n--- * i * n
2
2
(7)
• For the upper boundary of the potential vehicle, search from the top to the middle of template and select the projection values above the threshold, m- Th upper = 1--- max Histogram V _ edge ! i " |1 * i * --
2
2
(8)
• For the lower boundary of the potential vehicle, use the original information obtained from the result in the primary search step. Finally, the position range of the potential vehicle can be determined as shown in Figure 10. 3.4. Verification Step To ensure the robustness of the overall processing system, it is important to further verify that the template actually contains a vehicle after the contour of the potential vehicle is decided. The parameters used for the verification are described as follows. • Aspect ratio: Depending on the configuration of the camera, a threshold is defined for the aspect ratio (the ratio of the width to the height of the inner enclosing rectangle); • Texture: According to information theory, entropy is used as a measure to estimate uncertainty, so as to check whether a vehicle is contained in the enclosed rectangle. If the rectangle contains no vehicle, it contains little information and the entropy is low. The entropy is determined by the following formula (Jain et al., 1995): H ! z " = ∑ P ! a j " log P ! aj " J
j=1
(9)
where P ! a j " is a probability of the jth graylevel of histogram a and J=255 is the gray scale. • Symmetry: The symmetry property of regular vehicles is computed by evaluating the difference between the
Figure 11. Identification of driving environment.
Figure 12. Experimental setup. right- and left-half of the inner, enclosing rectangle. 3.5. Construction of Driving Environment After successfully detecting all the vehicles in front of the host vehicle and with exact calibration performed in advance, the relative position (Dx and Dz) can be calculated based on the information obtained by the lane geometry and the vision system. Furthermore, the position of the host vehicle within the host can be also determined, as shown in Figure 11. Finally, the driving environment of the host vehicle can be completely constructed. 3.6. Experimental Results As shown in Figure 12, the input image sequences are captured by a CCD camera mounted behind the windshield and transferred to a laptop computer at a rate of 30 frames per second. The system is equipped with Intel Pentium Duo 1.66 GHz CPU and 1GB RAM through a USB port. This system is developed by the Borland® C++ Builder based on the Microsoft® Windows operating system. The vehicle detection algorithm has been tested in several scenarios of video clips captured in daytime. Without any optimization for the system, lane marking detection can be performed in real-time (30 frames per second). Lane marking detection combined with multiple vehicle detection can be processed at the rate of 20 frames per second, on average. As shown in Table 1, the method is evaluated by statistics of the error rate. Herein, the error rate consists of the false alarm rate and the false dismissal rate. Of course, the error rate is proportional to the number of vehicles appearing in the image sequences. Generally speaking, the distance information becomes more important when the host vehicle approaches the preceding vehicle. That is, the importance of short-range detection is more significant than that of long-range detection. In this study, two performance measures, false alarms and false dismissals, are adopted to illustrate the
IMAGE PROCESSING TECHNIQUES FOR LANE-RELATED INFORMATION EXTRACTION
Table 1. Experimental results of vehicle detection within the field of view. Video clip (1) (2) (3) Freeway 1 4/293=1.3% 40/293=14% 25/293=8.5% Freeway 2 7/344=2.0% 62/344=18% 20/344=5.8% Freeway 3 5/275=1.8% 55/275=20% 4/275=1.4% Freeway 4 10/452=2.2% 78/452=17.3% 44/452=9.7% Freeway 5 2/221=0.9% 10/221=4.5% 2/221=0.9% Average 1.8% 15.5% 6.0%
(1) False dismissal rate within a range of 30m (Number of false dismissals/Total frames), (2) False dismissal rate within a range of 100m (Number of false dismissals/Total frames), (3) False alarm rate (Number of false alarms/Total frames)
outcome of the proposed system. False alarm denotes the number (or ratio) of the vehicles which are incorrectly detected by the system; false dismissal denotes the number (or ratio) of vehicles which are not correctly detected by the system. As indicated in the first column of Table 1, the false-alarm rate, the vehicle detection algorithm performs well, with a low false-dismissal rate within short range compared with the long-range, shown in the second column. These errors mainly came from the vibration caused by the host vehicle driving on uneven roadway sections. Furthermore, in terms of initializing a tracking process, the proposed algorithm causes few false alarms that would lead the system to spend meaningless time tracking non-vehicle targets.
4. CONCLUSION In this paper, we first presented an effective approach to detect the lane markings correctly and to construct the driving environment of the host vehicle by lane information. This information can be further processed to derive the driving trajectories of the host vehicle, which can be used to reflect the vehicle behavior or even the driver’s behavior on the highway. As for the vehicle detection, we proposed a four-step procedure that effectively integrates lane information and vehicle parameters to minimize the computational complexity and to achieve high detection performance. The experimental results revealed that the average falsedismissal rate within a short range is lower than 2%. Moreover, the proposed method is suitable for identifying the environmental situation and complementing any forward-collision warning system or other safety decisionmaking systems. These procedures are summarized in the flowchart shown in Figure 6. Both the primary search stage and the refined search stage have improved performance compared with related research works in the literature (Srinivasa,
519
2002; van Leeuwen, and Groen, 2005). Technically speaking, these results show a better searching result in the free-driving-space. Furthermore, at the refined search stage, two-dimensional edge detection is applied and provides better performance. In order to guarantee the performance and robustness of the proposed approach, vehicle-tracking techniques should be included in the future post-processing steps. Moreover, these proposed algorithms should be integrated with vehicular and environmental monitoring as well as automatic driving systems to achieve the ultimate goal of fully-autonomous highway systems. To improve the processing capability, all the proposed algorithms should be implemented in real-time processing hardware, such as the on-board system presented by Yi and Lee (2005).
ACKNOWLEDGEMENT This research was supported in
part by the National Science Council, Taiwan, ROC, under the grants: NSC 95-2218-E-002-031 and NSC 95-2218-E-002039, and DOIT/TDPA: 95-EC-17-A-04-S1-054.
REFERENCES Bertozzi, M. and Broggi, A. (1998). GOLD: a parallel real-time stereo vision system for generic obstacle and lane detection. IEEE Trans. Image Processing 7, 1, 62 81. Bertozzi, M. Broggi, A. Fascioli, A. and Tibaldi, A. (2002). An evolutionary approach to lane markings detection in road environments. Atti del 6 Convegno dell'Associazione Italiana per l'Intelligenza Artificiale. 627-636, Siena, Italy. Betke, M., Haritaoglu, E. and Davis, L. S. (2000). Realtime multiple vehicle detection and tracking from a moving vehicle. Int. J. Machine Vision and Applications 12, 2, 69 83. Blackman, S. S. (1986). Multiple-Target Tracking with Radar Applications. Artech House. Norwood, MA. Chang, T.-H., Lin, C.-H., Hsu, C.-S. and Wu, Y.-J. (2003). A vision-based vehicle behavior monitoring and warning system. Proc. IEEE 6th Int. Conf. Intelligent Transportation Systems, Shanghai, China, 448 453. Fang, C.-Y. (2003). A Vision-Based Driver Assistance System Based on Dynamic Visual Model. Ph. D. Dissertation. Department of Computer Science and Information Engineering. National Taiwan University. Jain, R., Kasturi, R. and Schunck, B. G. (1995). Machine Vision McGRAW-Hill Int. Edn. Jeong, S. G., Kim, C. S., Lee, D. Y., Ha, S. K., Lee, D. H., Lee, M. H. and Hashimoto, H. (2001). Real-time lane detection for autonomous vehicle. Proc. IEEE Int. Symp. Industrial Electronics, 3, Pusan, Korea, 1466– 1471.
520
Y.-J. WU, F.-L. LIAN, C.-P. HUANG and T.-H. CHANG
Van Leeuwen, M. B. and Groen, F. C. A. (2005). Vehicle detection with a mobile camera: Spotting midrange, distant and passing cars. IEEE Robotics & Automation Magazine 12, 1, 37 43. Park, J. W., Lee, J. W. and Jhang, K. Y. (2003). A lanecurve detection based on LCF. Pattern Recognition Letters, 24, 2301 2313. Shapiro, L. G. and Stockman, G. C. (2001). Computer Vision. Prentice Hall. New Jersey. Srinivasa, N. (2002). Vision-based vehicle detection and tracking method for forward collision warning in automobiles. Proc. IEEE Intelligent Vehicle Symp. 2, 626 631. Tzomakas, C. and von Seelen, W. (1998). Vehicle Detection in Traffic Scenes Using Shadows. Internal
Report IR-INI 98-06. Institut fur Neuroinformatik. Ruhr-Universitat. Bochum. Germany. Yen, P.-S. (2003). Motion Analysis of Nearby Vehicles on a Freeway. Master Thesis. Department of Information & Computer Education. National Taiwan Normal University. Yi, U.-K. Lee, J. W. and Baek, K. R. (2005). A fuzzy neural network-based decision of road image quality for the extraction of lane-related information. Int. J. Automotive Technology 6, 1, 53 63. Yi, U.-K. and Lee, J. W. (2005). Extraction of lanerelated information and a real-time image processing onboard system. Int. J. Automotive Technology 6, 2, 171 181.