Image Recognition Traffic Patterns for Wireless Multimedia Sensor Networks R. Zilan1 , J. M. Barcel´o-Ordinas1 , B. Tavli2 1
Univ. Politecnica de Catalunya (UPC) Computer Architecture Department Barcelona, Spain {rzilan,joseb}@ac.upc.edu
2
Abstract—
The objective of this work is to identify some of the traffic characteristics that may be found in Wireless Multimedia Sensor Networks (WMSN). Applications such as video surveillance sensor networks make use of new paradigms related with computer vision and image processing techniques. These sensors do not send whole video sequences to the wireless sensor network, but objects of interest detected by the camera. In order to, may be in further studies, able to design appropriate networking protocols, a better understanding of the traffic characteristics of these multimedia sensors is needed. In this work1 , we analyze the traffic differences between cameras that send whole coding images and those that first process and recognize objects of interest using Object Recognition techniques. I. I NTRODUCTION Wireless Multimedia Sensor Networks (WMSN) are gaining research interest due to the availability of low-cost cameras and CMOS image sensors, also due to the broad application requirements. Applications of such networks can be listed as: Multimedia surveillance sensor networks, advance health care delivery, personal locator services, traffic avoidance, enforcement and control systems, etc, see [1]. WMSN may include the transmission of snapshots in which event triggered observations are obtained and multimedia streaming in which long multimedia data is sent requiring high data rates and low-power consumption transmission techniques. For example, we can 1 This work was supported by EuroNGI Network of Excellence and CICYT TEC2004-06437-C05-05
TOBB Univ. of Economics and Technology Computer Engineering Department Ankara, Turkey
[email protected]
imagine a surveillance application in which several cameras are deployed to control habitat monitoring. When a movement sensor detects an animal, the camera sensor takes images and send the data to a sink using a multihop network. In order to minimize the power consumption and network lifetime, it would be interesting to first detect whether the image captures a phenomena of interest (e.g. a particular animal) and second send the minimum data to represent that object. Furthermore, it would be interesting to describe the phenomena from multiple views and on multiple resolutions. In Wireless Sensor Networks, the traffic sent into the network consists of a few bytes of data. Most of the works consider that sensors react to events or to queries. As an example of typical paramaters, in Directed Diffusion, see [2], the authors consider that each source generates two events per second and each event was modeled as a 64-byte packet while interests were modeled as 36-byte packets at a periodic rate of one interest every 5 seconds with a interest duration of 15 seconds. Another example is T-MAC, see [3], in which the authors use as a data model based on periodic packets of 50 bytes every second to the sink, packets of 30 bytes every 4 seconds in the neighborhood of the event (and event is produced every 10 seconds) and local packets every 20 seconds. As can be seen, in general traffic in sensor networks is modeled as periodic sources. In Wireless Multimedia Sensor Networks traffic sources produce snapshots or multimedia streaming. In any case, if we take a camera and produce frames at a rate that may range between 5 and 30 fps (frame per second) the traffic produced will not be periodic. For instance, it is well known that video streams (e.g. MPEG codification) exhibit heavy-tailed probability
distributions and autocorrelation functions with a mixture of Short Range Dependence (SRD) and Long Range Dependence (LRD). This kind of traffic in a sensor network may rapidly consume the sensor batteries and also wil fill the buffers of the sensors. Object Recognition is a scientific discipline that focuses on obtaining specific information from images. This research area includes scene reconstruction, event detection, tracking, object recognition, etc. Given most of the applications present in WMSN, we believe that Object Recognition is a discipline that has to be taken into account in the design of most multimedia sensor networks. There are applications that instead of sending the whole set of frames will send a stream of bytes representing part of the scene,such as the edge of an object of interest in the scene (e.g. a person, a car, etc). That means the sensor will produce a traffic based on the output of software that manipulates the frames taken from the scene. Many works related to traffic characterization on different network architectures may be found in the literature. O. Rose et al, see [4], studied the impact of MPEG1 video traffic in ATM networks with detailed statistical analysis. F. Fitzek et.al. see [5], also presents statistical results from MPEG4 and H.263 encodings for wireline and wireless networks. Related to WMSN, C.F. Chiasserini et al, in [6], investigate the possible tradeoffs between energy consumption and image quality. The authors mention the high complexity in terms of time and power that may result in performing motion estimation when coding frames. Afterthat, the authors study JPEG performance in still images in which only intra-frame (Discrete Cosin Transform mainly) is performed. Power consumption in video sensor technologies are such is also studied in several video platforms proposed. Examples are Panoptes, see [7], Meerkats, see [8], and Cyclops, see [9]. Meerkats, see [8], shows that processing power consumption is no longer negligible and is comparable to the networking components. Meerkats performs object recognition based on background substraction that simply detects motion taken between two snapshots at different short time lag. Cyclops, see [9], performs object recognition using background substraction on images taken periodically. AER, see [10], takes another ap-
proach. AER (Address Event Representation) outputs only a few features of interest of the visual scene by detecting intensity differences (motion) information. However, there is no works able to identify traffic characteristics that these sensor devices may produce. Even more, Meerkats chose DSR (Dynamic Source Routing) as a routing protocol for tests. DSR is not a suitable protocol for sensor networks. We think that in order to design appropriate sensor network protocols for video sensing, then it is necessary to identify the traffic that these devices produce. Therefore, the objective of this work is to identify some of the traffic characteristics that may be found in Wireless Multimedia Sensor Networks (WMSN) that make use of new paradigms related with computer vision and image processing techniques. These sensors do not send whole video sequences to the wireless sensor network, but objects of interest detected by the camera. In order to, may be in further studies, able to design appropriate networking protocols, a better understanding of the traffic characteristics of these multimedia sensors is needed. In this work, we analyze the traffic differences between cameras that send whole coding images and those that first process and recognize objects of interest using Object Recognition techniques. The paper is organized as follows, in section II, Traffic Generation of Framework is explained under three subsections which are General Framework, Video Surveillance in WSN and Experimental Study. In section III, Statistical Analysis are discussed. Finally in section IV, the paper is concluded. II. T RAFFIC G ENERATION F RAMEWORK A. Object Recognition Basics There is a wide application area for object recognition fields like industry (quality control etc.), medical image possessing, military applications for instance, in the explorations of field and autonomous vehicles (cars, robots, etc.). Mainly, identification of an object and determination of its parameters are called Object Recognition. Although there are huge amount of techniques for object recognition depending on the applications, general object recognition methods can be categorized as in Figure 1. There are typical functions that can be found in many object recognition techniques: Image
CAMERA
M fps OBJECT RECOGNITION f1
f2
f3
f4
f 1’
SOFTWARE
fn
ENCODER
S1
Fig. 1.
S2
S3
f 2’
f 3’
f 4’
f n’
OR−FRAMES
VIDEO FRAMES
ENCODER
S4
Sn
S1’
S2’
S3’
S4’
Sn’
Generation Object Recognition Methods Data to be sent (Case I)
Fig. 2.
acquisition (either 2D image, 3D volume or an image sequence), pre-processing (noise reduction, contrast enhancement and scale-space representation), detection/segmentation (one or multiple image regions), feature extraction (lines, edges and ridges, or more complex features such as texture, shape or motion related requirements), high level processing. Further information on object recognition basics can be obtained in [11].
B. General Framework The experimental set-up, see Figure 2, consists of a camera that takes video at a configurable rate of M fps (frames/s). Here, we consider two cases: frames f1 , f2 ,..., fn may be encoded and be sent to the network (Case I). After codification, frames have a size (in bytes) S1 , S2 ,..., Sn that depends on the chosen coding technique. This is the data that should have to be sent to the network if the camera does not implement any detection technique. The second case, considers that frames f1 , f2 ,..., fn are fed to one of the Object Recognition (OR) tools. This output consists of a 0 0 0 set of non-encoded OR-frames f1 , f2 ,..., fm . In general, and depending on what does the Object Recognition (OR) tool, the number of OR-frames may be different from the original set (m 6= s). For instance, some softwares represent changes in light intensity with metadata. On the reception side the software is able to represent detected objects from these metadata packets received. Other tools, substract the background and outputs frames with the envelope of the object detected. Further compression may be obtained using any coding technique. Therefore, after codification, OR0 0 0 frames have a size (in bytes) S1 , S2 ,..., Sm .
Data to be sent (Case II)
Traffic Generation Framework
C. Experimental Framework In this study the chosen OR method is Edge Detection. It is one of the main points in feature extraction, detection and segmentation. Edges could be considered as a boundary between two dissimilar regions in an image. Computation of edges are fairly cheap and recognition of an object is easy since it provides strong visual clues however edges can be affected by the noise in an image. Although there are several different methods to perform edge detection, generally they can be categorized under two subtitles; Gradient and Laplacian. While the first one detects the edges by looking for the maximum and minimum in the first derivative of the image, the second one searches for zero crossings in the second derivative of the image to find edges. For this study, Sobel Edge Detection method which can be categorized as gradient, is chosen. We have used a software called Video OCX, see [12] to capture live video and perform image processing. Although Video OCX and its tools are not designed for sensor networks, they are practical tools for image processing that allows capturing live video, displaying and saving AVI files. It could also helps for applying image processing functions like edge detection based on Sobel filtering, or motion detection of images, see [12]. AER (Address Event Representation), developed by YALE University [10], is an address event sensor that extracts and outputs only a few features of interest from the visual scene. These sensors are sensitive to light and motion so that only pixels that include the brightest one generate the events first and more periodically than others. Thus, only pixels which realize a difference in the light intensity generate
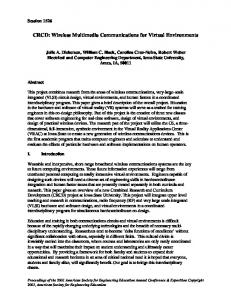
Fig. 3.
Original, Edge Detection and AER snapshots
the events. In ENALAB at YALE University provides AER emulator for research purposes. The AER emulator takes an image from the camera, after some low-level feature detection it produces a frame describing the feature magnitude at each pixel. After that an algorithm converts each pixel’s magnitude into frequency coding, connecting it the other pixels’ own streams to produce a stream of address-events. AER uses the maximum event rate value to produce as many as events per pixels. Since AER is designed for sensor networks, we have used AER Emulator to produce a traffic representative of sensor imagers. See Figure 3 for seeing a snapshot of the original sequence, Edge Detection sequence and AER sequence. After OR, the obtained frames are not optimally encoded in terms of spetial or temporal redundancies. Since, at the moment, no specific encoders are designed for sensor networks, we have used MPEG4. MPEG4 may not be suitable for sensor networks in terms of computation. In Wireless Sensor Networks, the transmission/reception module consumes more power than computation of data. In Wireless Multimedia Sensor Networks, computation of data (e.g. encoding) may be higher than in data-centric sensors. We have not found studies on suitable codification for WMSN. Nevertheless MPEG codification requires high computation (e.g. Discrete Cosine Transform, etc), we think that an encoder which includes spatial and temporal redundancy compression techniques may reduce the amount of data to be sent in a sensor network. The MPEG (Moving Picture Experts Group) coding algorithm was developed mainly for the storage of compressed video on digital storage media. These standards are based on
coding technologies created for video conferencing and other multimedia applications. The MPEG video compression algorithm uses two techniques, see [13]: block-based motion compensation for the reduction of the temporal redundancy and transform domain-(DCT) based on compression for the reduction of spatial redundancy. Motion compensated techniques are applied with both causal (pure predictive coding) and noncausal predictors (interpolative coding). The remaining signal (prediction error) is more compressed with spatial redundancy reduction (DCT). To encode frames, three modes can be used; intraframe (I), predictive (P) and interpolative (B). An I-frame is encoded as a single image, with no reference to any past or future frames. A P-frame is encoded relative to the past reference frame. A reference frame is a P- or I-frame. A B-frame is encoded relative to the past reference frame, the future reference frame, or both frames (I or P). III. E XPERIMENTAL
STUDY
To study the traffic generated by the OR tools we characterize the frame sizes. For this purpose, we analyze three different sets of data: A live captured-video file, a captured and features detected by Edge Detection video file and a video file which is progressed with AER emulator. The environment is considered as a surveillance environment in which a person walks in a room in front of the camera. The video sequence longs around two minutes. The experiment emulates a sensor camera that detects an object of interest (a person) and sends the captured images to a sink. The objective is to analyse the difference kind of traffic this sensor could generate before sending the data to the sink. The uncompressed 16-bit IYUV information
was captured at different frame rates in the QCIF format (176x144 pxl). When using Edge Detection, files are captured in gray scale. Captured files, first encoded by MPEG4 encoder (IMToo Empeg Encoder) and then frame sizes were extracted by the usage of MPEG-4 Parser, see [14], and statistics were taken from these trace files. Table I shows the data sizes generated before and after encoding. At the moment of this work, the capturing software may only work with live video. Therefore, the input of the three methods are different even though they are of similar sequence and time and may not be compared. However, the results still are interesting, since they show the different traffic patterns produced by the three methods. In Table I, the column “Capt. Time” shows in seconds the capturing time of each sequence. We see that the results from different Frame Rates behave in a similar way. If we observe the 25 fps capture, we can see that the Original data to be sent without any compression is 89873 KB and using MPEG4 compression reduces to 4592 KB. Using Edge Detection the data to be sent without compression reduces to 21139, due to the fact that Edge Detection is coding in gray scale using 2 bits/pixel. Further compression using an encoder such as MPEG4 reduces the amount of data to 4585. Although the compression ratio of the original file is higher than the other, the amount of data to be sent is around the same. We note that we can not directly compare both outputs since they correspond to different input files (all around 1 minute) and we only consider the magnitude of the results as a first approximation. However, traffic characteristics, see II, are quite different. Original frames have a higher Peak to Mean Ratio, generally an indication of higher burstiness. Peak frames get to the order of 14000-15000 Bytes while Edge detection have peak frames of no much than 9000 Bytes. Separating, see III, I-frames from Pframes helps to see the different compressions obtained in the traces. After Object Recognition, VideoOCX saves captured video in AVI formats. AER emulator outputs data either as metadata or AVI files. AVI formats use a “one frame in, one frame out” sheme. That means that the Presentation Time Stamp (PTS) and the Decoder Time Stamp (DTS) are the same, not allowing b-
frames, as b-frames are constructed by using two frames at once, the previous and following I/P frame. Then, the encoding data will only present I and P frames. Table IV shows the size of 16 frames taken from two consequtive GoP (the behaviour is the same on other GoPs). As can be seen, Edge Detection I frames are reduced more than 50%. The reason is that after obtaining the edge, the Intra-frame coding performs better since the background is homogeneous. The results show that Intraframe compression is a desired feature in these kind of devices. Original I 11507 P 3996 P 3272 P 3173 P 2976 P 3117 P 4755 P 2567 P 3842 P 2924 P 3770 P 3393 I 11787 P 3110 P 3893 ... ...
Edge Det. I 5867 P 5576 P 103 P 5801 P 130 P 5801 P 111 P 6028 P 102 P 5885 P 113 P 5754 I 6112 P 5594 P 134 ... ...
TABLE IV G O P SEQUENCE AFTER ENCODING
The behaviour of P-frames is totally different. In general, in MPEG encoding, a P-frame is encoded relative to the past reference frame. A reference frame is a P- or I-frame. The past reference frame is the closest preceding reference frame. Each macroblock in a P-frame can be encoded either as an I-macroblock or as a P-macroblock. An I-macroblock is encoded just like a macroblock in an I-frame. A Pmacroblock is encoded as a 16x16 area of the past reference frame, plus an error term. To specify the 16x16 area of the reference frame, a motion vector is included. A motion vector (0,0) means that the 16x16 area is in the same position. This shows that Edge Detection decreases the amount of data to be sent. as the macroblock we are encoding. Other motion vectors are relative to that position. Motion vectors may include half-pixel values, in which case pixels are averaged. The error term is encoded using the DCT, quantization, and runlength encoding. A macroblock may also be
Method
Frame Rate 25 fps 25 fps 20 fps 20 fps 15 fps 15 fps
Original EDGE Original EDGE Original EDGE
Numb. Capt. Frames 1164 1272 1272 1056 1176 804
YUV (KB) 89873 21139 98266 17774 91210 13721
MPEG4 (KB) 4592 4585 5012 4288 4661 3133
Compres. Rate 19,57 4,61 19,61 4,15 4,38 4,38
TABLE I D ATA SIZES AND C OMPRESSION RATES . Method Original EDGE Original EDGE Original EDGE
Frame Rate 25 25 20 20 15 15
fps fps fps fps fps fps
Mean Size (B) 3833 3574 3818 3978 3823 3775
St. Dev.
Coeff. Var.
Peak
Peak/Mean
Min.
2561,6 3042,2 2508,1 3399 2585,6 3240
66,82 85,1 65,69 85,44 67,63 85,83
14529 8009 14027 8820 16093 8788
3,79 2,24 3,67 2,22 4,21 2,33
1307 67 1420 69 1391 70
Peak
Peak/Mean
Min.
14529 5949 7149 8009
1,21 1,92 1,18 2,39
9865 1307 5046 67
TABLE II D ATA F RAME S TATISTICS . Method Original Original EDGE EDGE
Type of Frames I P I P
Num. Frames 97 1067 106 1166
Mean Size (B) 11976 3093 6050 3349
St. Dev. 1191 671 457 3077
Coeff. Var 9,94 21,70 7,55 91,87
TABLE III I-F RAME AND P-F RAME S TATISTICS (25
skipped which is equivalent to a (0,0) vector and an all-zero error term. The search for good motion vector (the one that gives small error term and good compression) is the heart of any MPEG video encoder and it is the primary reason why encoders are slow. We observe that the original trace outputs P-frames of the same order of magnitude. However using Edge Detection, we observe sequences consisting of a high-size P-frame (few thousands of Bytes) followed by a shortsize P-frame (few hundreds of Bytes). We think that the short-size P-frame may be due to small changes in the motion of the edge of the object. The high-size P-frame should encode again the whole edge. In any case, it should be taken into account that motion compensation may be possible if simple algorithms could be used. In AER, see [15], events are signaled when changes in pixel intensity reach a threshold voltage. AER uses 17 bits to codify each event. If Nev is the number of event per frame, then Nev *17 bits/event is the size of the frame. Edge Detection frames before compression
FPS )
have a size of 152064 bits/frame. AER obtain this sizes with 152064/17= 8944 events/frame. After compression, Edge Detection produces I and P frames of different sizes. The mean I and P frames in Edge Detection with 25 fps are 6050 and 3349 bits respectively. AER frames with 350 events/frame will produce frames of 5950 bits/frame. So AER with a number of events in the range of around 350 or 400 events produces the same amount of bits that Edge Detection with a complex coding as MPEG4. However, the advantage of AER imagers is that reduce the high compression overhead produced by encoders as is explained in [15]. IV. C ONCLUSIONS In order to design suitable networking protocols for wireless multimedia sensor networks, traffic should be characterized. These kind of networks are not requiring streaming videos but focusing on tracking phenomena. Since there is no such studies in the literature, it is important to obtain a better understanding of the behaviour of such traffic sources. In this study, ”Object Recognition Techniques”
are considered as key components for reducing the amount of information to be sent to the sink. Moreover, coding techniques are further considered to reduce the temporal and spatial redundancies in frames. Even though MPEG4 is not a suitable technique for sensor networks, it is used to show the effects of coding on object recognized frames. As a future work, we are working on different object recognition techniques together with coding techniques to be able to produce a traffic characterization for wireless multimedia sensor networks. R EFERENCES [1] I. F. Akyldiz, T. Melodia, and K. R. Chowdhury, “A survey on Wireless Multimedia Sensor Networks,” in Computer Networks, 51, pp 921-960, 2007. [2] C. Intanagonwiwat, R. Govindan, D. Estrin, J. Heidemann, and F. Silva, “Directed Diffusion for Wireless Sensor Networking,” in IEEE/ACM Transactions on Networking, Vol 11, No 1, Feb, 2003. [3] T. van Dam and K. Langendoen, “An adaptive energy-efficient MAC protocol for wireless sensor networks,” in 1st international conference on Embedded networked sensor systems (SenSys), pp 171-180, LA, California, USA, 2003. [4] O. Rose, “Statistical properties of MPEG video traffic and their impact on traffic modeling in ATM systems,” in Proceedings of the 20th Annual Conference on Local Computer Networks, October 1995. [5] F. H. P. Fitzek and M. Reisslein, “MPEG-4 and H.263 video traces for network performance evaluation,” in IEEE Network, Vol 15. No 6, pp 40-54, Nov. 2001. [6] C. Chiasserini and E. Magli, “Energy Consumption and Image Quality in Wireless Video-Surveillance Networks,” in The 13th IEEE International Symposium on Personal, Indoor and Mobile Radio Communications (PIMRC 2002), Lisboa, Portugal, Sept. 2002. [7] W. chi Feng, B. Code, M. Shea, W. chang Feng, and L. Bavoil, “Panoptes: Scalable Low-Power Video Sensor Networking Technologies,” in ACM Transactions on Multimedia Computing, Communications, and Applications (TOMCCAP), Volume 1, Issue 2, pp 151-167, May 2005. [8] J. Boice, X. Lu, C. Margi, G. Stanek, G. Zhang, R. Manduchi, and K. Obraczka, “Meerkats: A Power-Aware, Self-Managing Wireless Camera Network for Wide Area Monitoring,” in Workshop on Distributed Smart Cameras (DSC’06), Boulder, CO, Oct. 2006. [9] M. Rahimi, R. Baer, O. Iroezi, J. Garcia, J. Warrior, D. Estrin, and M. B. Srivastava, “Cyclops: in situ image sensing and interpretation in wireless sensor networks,” in 3rd international conference on Embedded networked sensor systems (SenSys’02), San Diego, California, USA, Nov. 2005. [10] S. Teixeira, E. Culurciello, J. H. Park, and D. Lymberopoulos, “Address-Event Imagers for Sensor Networks: Evaluation and Modeling,” in Fifth International Conference on Information Processing in Sensor Networks (IPSN), Nashville, Tennessee, USA, April 2006.
[11] R. Zilan and J. M. Barcelo-Ordinas, “Object Recognition Basics and Visual Surveillance,” in Technical Report: UPC-DAC-RR-XCSD-2008-1, Jan 2008. [12] “Video OCX.” [Online]. Available: http://www.videoocx.de [13] T. Sikora, “MPEG Digital Video Coding Standards,” in IEEE Signal Processing Magazine, Sept. 1997. [14] “MPEG4-Parser, Video Trace Research Group, Arizona State University.” [Online]. Available: http://trace.eas.asu.edu [15] E. Culurciello, J. H. P. S., and A. Savvides, “Address-Event Video Streaming over Wireless Sensor Networks,” in IEEE International Symposium on Circuits and Systems (ISCAS 2007), New Orleans, USA, May 2007.