Pamela Wenzel2, Alain deBruin1, Gustavo Leone2. 1The Ohio State ..... 257â260. [8] S. Petushi, C. Katsinis, C. Coward, A. Tozeren, and F. Garcia, âAu- tomated ...
1
Image Segmentation with Tensor–Based Classification of N–Point Correlation Functions Randall Ridgway1 , M. Okan Irfanoglu1 , Raghu Machiraju1 , Kun Huang1 Pamela Wenzel2 , Alain deBruin1 , Gustavo Leone2 1 The Ohio State University, Columbus, USA 2 Human Cancer Genetics, OSU, Columbus, USA
Abstract— In this paper, we investigate the use of N –Point correlation functions from material science literature, for medical image segmentation, and introduce a classifier suitable for use with these functions. The N –point correlation functions serve as good estimators of component material distributions and their packing in a multi–phase heterogeneous media. We represent these multi–phase properties with tensor structures and employ these functions as features in our tensor decomposition based classification algorithm. We use a variant of Higher Order Singular Value Decomposition (HOSVD) to extract the multi– linear properties of the tensor feature space and reduce the dimensionality with respect to several modes. The preliminary results of segmenting a placenta image with these functions and classifier, are very promising.
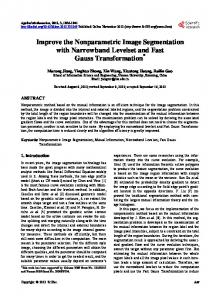
I. I NTRODUCTION Robust segmentation of images requires the proper selection of features and classifier. There has been a systemic effort towards the construction of sophisticated classifiers which are often ensembles of several classifiers themselves. The oftenheld premise is that classifiers with deep innate learning capabilities can successfully analyze images. For large microscopy data (16000x16000x900) the computational cost of these classifiers is prohibitively expensive and the training overhead is often very high. For many large-scale phenotyping studies micro-tomed and stained histological slices when digitized with a light microscope scanner result in at least 900 RGB color images of resolution 16000x16000. This paper’s example requires histological reviews of placenta in both normal and mutant mice. The aim of this work is to seek and even suggest feature descriptors that will work best even with simple classifiers. The intent is to detect and measure the structural changes in the placenta caused by the mutation of the retinoblastoma gene, Rb− . It is suspected that observed miscarriages and cancer [1] are a result of this, genetic change. Consider the images in Figure 1. The images depict 3D renderings of placentas of wild and mutant mice. Note the irregular interface between the labyrinth (bottom) and the spongiotrophoblast (top) leading one to believe that the underlying hypothesis is possibly correct. These images were created after each individual slide image was segmented, the entire stack registered and then rendered. It should be noted that 3D renderings are not enough. An important measure of phenotyping is an estimate of surface area and fractal dimensionality (characterizing roughness and irregularity) of the interface. Robust image segmentation is needed for both rendering and measurements.
Fig. 1. Volume rendering of interface between spongiotrophoblast and labyrinth. On the left is a mutant the right is wild type
The use of many popular classifiers and clustering algorithms [2] were explored for the problem at hand. Bayesian, k-means, and EM -based mixture modeling algorithms were deployed for segmentation. In our previous work, our first choice for a feature set included color and gradient histograms, material counts (red blood cells, vacuoles). We also examined the use of coefficients from the Gabor transform. However, in the case of the placenta the resulting segmentation and ensuing measurements were far from satisfactory. Tissue segmentation of large color histology slides poses many challenges. It should be noted that a tissue region is essentially a heterogeneous material composed of separate components: nuclei, red blood cells, cytoplasm and extraneous white space. These components are distributed within each tissue region in a non-uniform manner. Seeking a pattern is therefore elusive and intractable. Instead, the packing, relative densities and gross ensemble properties of each component discriminates each of the various regions. We believe that by treating tissue as a heterogeneous material it will be possible to employ techniques of material science to characterize microscopic structure. The work of Torquato [3] is of special relevance to us. N point correlation functions (N -pcf) are used to characterize the distribution of component materials in a heterogeneous substrate. In this work, we propose the use of N -point correlation functions for tissue segmentation, with an HOSVD based tensor decomposition based classification algorithm for segmentation. Higher order tensor representation of N -point correlation features, is very suitable for the problem considering the ability to represent multi–phase properties of N -pcf, in different modes. Our segmentation algorithm is essentially four–stage. A color-space segmentation is first completed to determine various material components. In the second stage, we evaluate for the entire image 2-point functions of the component classification. In the third stage, we build a 5–
2
mode tensor representation of the feature space and decompose the space with Higher Order Singular Value Decomposition (HOSVD), to extract multi–linear properties of the spaces. In the last stage, we project a set of the features onto the tensor space to do classification. It should be noted that N -point correlation functions are similar to the co-occurrence matrices of Haralick [4]. There exist the following differences: (i) the computation of the N pcfs and path functions are randomized and does not exploit the pixel grid structure, (ii) these functions are used to compute other physical properties of the tissue substrate (e.g., porosity, etc.)(iii)it is not required to find the appropriate number of gray-levels so essential for the functioning of the Haralick approach, and (iv) the functions capture both the geometry and statistical nature of textural regions. In [5] the authors use an extended Haralick feature set to locate sub-cellular patterns in fluorescence microscopy images. Given the inherent generality of these N -pcfs, we explore their use in segmenting light microscopy images. There exist examples of their use as features in material science literature. In [6] the 2-point, and the 3-point functions are used to classify 2-phase metal substrate images using support vector machines (SVM) in a heirarchical fashion. It should be noted that there exist other reported segmentation methods for histological images. In [7] a comprehensive image analysis system was developed for prostate tissue analysis. Each material component was treated separately and a combination of various classifiers and segmenters. In [8] microstructures were segmented by a hybrid method that combines optimal adaptive thresholding with local morphological opening and closing operations. Similarly in [9], a robust method based on Markov random fields was used towards segmenting nuclei in confocal images of cervical tissue. In the following section we define the N -point correlation functions. In the following section, we describe the tensor math and our HOSVD based classifier. Later, we describe our segmentation methodology, and the methodologies used with standard texture features. Finally we present and discuss the results. II. N -P OINT C ORRELATION F UNCTIONS Correlation functions describe the spatial distributions of materials in a multiple material system. Each class defines a unique phase or material component. Torquato [3] provides a formal definition for N -point correlation functions, but a cursory introduction will be given here. Given a realization ω out of an ensemble Ω of random multiple phase media, one can define an indicator function of the form I (i) (p; ω) where: � 1 if point p is in phase i I (i) (p; ω) = 0 otherwise The average over all realizations ω in the ensemble Ω, and this will reveal the 1-point probability function. S (i) (x) ≡< I i (x) >= P (I i (x) = 1) Similarly, the N -point probability function can be defined as:
� (i) Sn (x1 , x2 ...xn ) ≡ I (i) (x1 )I (i) (x2 )...I (i) (xn ) . The N -point probability function is referred to as the N -point
correlation function, for phase i. Cross material correlations can be given by mixing indicator functions such as (ij) < I i (x1 )I j (x2 ) >≡ Sn (x1 , x2 ). The N -point correlation functions can be thought of as the probability of all N points of a randomly placed line or n-polygon landing in the material components specified in the superscript of the function. These functions provide a description of the mixture and separation of the components in a system. This paper will explore the cases where N = 2. The complexity of the system is reduced by treating the systems as invariant in both rotation and translation. Using this assumption reduces the two point function S2i (x1 , x2 ) to S2i (d) where d = kx2 − x1 k. In the case of N = 3 case the points are constrained to be the corners of an equilateral triangle. This reduces S2i (x1 , x2 , x3 ) to S3i (a) where a is the area of the triangle. A. Feature Extraction Algorithm In this section, we will describe our methods and algorithms to compute the N -point correlation functions. Given the large size of the images and size of the regions needed to retrieve proper spatial information, Monte Carlo methods were used. To estimate the functions, sample and region sizes must be specified. The minimum region size is proportional to the maximum distance that the functions will be evaluated for, and the sample size is chosen to keep the variance of the measured result to a desired range. To evaluate the two point correlation function for separation l and materials a and b in a region, place a number of randomly oriented and positioned lines of length l. Count the number of lines that have an end point in material a and the other in b. Dividing the number of lines matching the above criteria by the number of samples sent out gives the value of the two point correlation function for a and b at separation l. III. T ENSOR M ATH Tensor is a general name for multi–linear mappings over a set of vector spaces, i.e. a vector is a 1–mode tensor, a matrix is a 2–mode tensor. The tensor T ∈ ℜd1 ×d2 ×d3 .....dN is an N mode tensor where the dimensionality of the mode i is di . In the same way as a matrix can be pre–multiplied (mode– 1 multiplication) or post-multiplied (mode–2 multiplication) with another matrix, a matrix can be multiplied with a higher order tensor with respect to different modes. The mode– n multiplication of a matrix M In ×dn with a tensor T ∈ ℜd1 ×d2 ×d3 .....dN is denoted as T ×n M and results in a tensor U ∈ ℜd1 ×d2 ×...In .....dN with the same number of modes. The elements of the tensor U is computed in the following way: X Ud1 ....dn−1 in dn+1 ...dN = td1 ...dN × min dn (1) dn
A. Tensor Decomposition Principal Component Analysis (PCA) is a version of Singular Value Decomposition (SVD) which is a 2–mode tool, commonly used in signal processing to reduce the dimensionality of the space and reduce noise. SVD decomposes a matrix into three other matrices, such that: A = U SV T
(2)
3
where the matrix U spans the row space of A, the matrix V spans the column space of A and S is a diagonal matrix of singular values. The column eigenvectors vectors of matrices U (likewise for V ) are orthonormal to each other, describing a new orthonormal coordinate system for the space spanned by matrix A. N–mode SVD or Higher Order SVD (HOSVD) [10] is a generalization of the matrix SVD to tensors. It decomposes a tensor T , by orthogonolazing its modes, yielding a core tensor and matrices spanning the vector spaces in each mode of the tensor, i.e: T = S ×1 U1 ×2 U2 .... ×n Un (3) The tensor S is called the core tensor and is analogous to the diagonal singular value matrix in the traditional SVD. However, for HOSVD, the tensor S is not a diagonal tensor but coordinates the interaction of matrices to produce the original tensor. Matrices Ui are again orthonormal and the column vectors of Ui spans the space of tensor T , flattened with respect to mode i. The row vectors of Ui are the coefficient sets describing each dimension in mode i. These coefficients can be thought as the coefficients extracted from PCA but there are different sets of coefficients for each mode in HOSVD analysis. Please refer to [11] for details. B. Dimensionality Reduction After decomposing the original data tensor to yield the core tensor and mode matrices, we are able to reduce the dimensionality with respect to the mode we want, unlike PCA where the dimensionality reduction is only based on the variances. By reducing the number of dimensions in one mode and keeping the other intact, we can have more control over the noise reduction, classification accuracies and complexity of the problem. The dimensionality reduction is achieved by deleting the last m–column vectors from the desired mode matrix and deleting the corresponding m hyper–planes from the core tensor. The error after dimensionality reduction is bounded by the Frobenius–norm of the hyper–planes deleted from the core tensor. Unlike PCA and SVD, HOSVD does not produce the optimum vectors spaces after dimensionality reduction and a post– processing step is necessary to optimize and orthogonalize the eigenvectors. In this work, we follow the approach in [11] for this purpose.
the distances used and fourth and fifth mode for correlation matrices. We then decompose this tensor as: cl inst dst cr1 cr2 A = S ×1 UC×C ×2 UN×N ×3 UD×D ×4 U4×4 ×5 U4×4 (4)
In this decomposition, S is the core tensor analogous to the singular value matrix in SVD. Although in standard SVD the singular value matrix is a diagonal matrix, in HOSVD S is a dense tensor. The Frobenious-norm of the sub–tensors of S gives the variance of the corresponding part of the original cl data. The row vectors of UC×C , are the coefficients describing each class and they are the features to be used in classification. Let us first show how to reconstruct an original training instance from class coefficients. Let a be a feature set of size D × 4 × 4 from one training instance. Then by rearranging Equation 4, we get: dst cr1 cr2 cl a = (S ×3 UD×D ×4 U4×4 ×5 U4×4 ×2 uinst 1×N (i)) ×1 u1×C (j) (5) cl where ucl 1×C (j) is the row feature vector U1×C (row = j) describing class j and uinst 1×N (i) is the row vector of the inst instance matrix, U1×N (row = i), describing the space of instance i in the training data. For an unseen test instance, the goal is to find the class space coefficients that will minimize the reconstruction error from the lower dimensional mode–coefficients space to the original space. The aim in this analysis is to extract the representative class vector x1×C for an unseen test instance ZD×4×4 , so that dst cr1 cr2 Z = (S ×3 UD×D ×4 U4×4 ×5 U4×4 ×2 uinst 1×N (i))×1 x1×C (6)
Let us call dst cr1 cr2 Mn = (S×3 UD×D ×4 U4×4 ×5 U4×4 ×2 uinst 1×N (i))
∀n = 1 : N (7)
so that ZD×4×4 = Mn ×1 x1×C To get the best class coefficients x1×C for ZD×4×4 , we have to minimize the following objective function: X XXX Mnl1ijk × xnl ))2 ∀n = 1 : N (Zijk − ( En = i
j
l
k
(8) The solution to this optimization problem turns out to be the solution to the linear system: An xn = bn where
C. Classification In this section, we will describe our classification algorithm considering our experimental setup. Let C be the number of classes, N be the number of training samples for each class, D the number of distances used in the computation of the N –Point correlation functions. As described in the following sections, for each distance used in the 2–pt computation, we extract a 4 × 4 correlation matrix from each region. We pack all these features, into a 5–mode tensor A, where A ∈ ℜC×N×D×4×4 . The first mode in the tensor is for classes, the second mode for training instances for each class, third mode
Anpq =
XXX i
j
(Mnp1ijk × Mnq1ijk )
p, q = 1 : C
(9)
k
and bnp =
XXX i
j
(Mnp1ijk × Zjk ) p = 1 : C
(10)
k
The best coefficient set x1×C is obtained by finding the error for each instance n and picking the feature set minimizing the error.
4
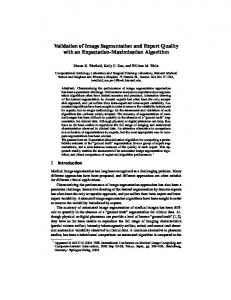
Fig. 2. Cropped placenta image with the boundary between labyrinth and maternal layer outlined in black, the interface between and labyrinth and spongiotropoblast marked as white, and glycogen demarcated by gray
IV. T ISSUE C LASSIFICATION A ND F EATURE C OMPARISON A. The Dataset The histological slides used for this work are from a mouse placenta, which was harvested after 13 days of gestation. It was prepared using a standard protocol. After humanely freeing the placenta from the mother, it was mounted in paraffin, and cut into slices 5 µm thick with a microtome. The slices were stained with hematoxylin and eosin (H + E), and were digitized at 200 times magnification, with a commercially available digital microscope. The images were then shrunk to half the original size, and cropped to only include the region of interest. Mouse placentas are composed of four distinct layers: labyrinth, spongiotrophoblast, trophoblast, and glycogen. The research this work was developed in conjunction with was primarily concerned with the labyrinth and spongiotrophoblast These two regions can be visually identified by the amount and distribution of nuclei, red blood cells, cytoplasm, and empty space in them. The labyrinth is characterized by a large number of densely packed, and a moderate amount of red blood cells, and frequent small patches of background which correspond to drained blood vessels. The spongiotrophoblast layer has a higher percentage of cytoplasm and larger well spaced nuclei.
either correlation functions. The final classification to retrieve tissue layers is then implemented on the spatial features. Classification was done by tiles of 20x20 pixels. The first level of segmentation was to segment the tissue components. These were identified and segmented from the input image by modeling each component as a Gaussian distribution in RGB color space. The modeling was performed by using the pixel data which was gathered by the method described above, and generating a 3 by 3 covariance matrix for each component class. During the classification step each pixel was assigned to the class it had the maximum likelihood of occurring in based on these Gaussian distributions The features were then generated, by evaluating two point correlation functions. The functions were evaluated at distances ranging from 1 to 25, with a 51 by 51 region, and a sample size of 1000. The correlation functions were evaluated to measure the auto correlation and correlation between each possible material. In the training phase, 50 regions for each class, are used to build the tensor and the rest is used for testing, yielding a tensor of dimensions A3×50×25×4×4 After projecting the test instances onto the tensor eigenspace, k-Nearest Neighbor(k– nn) classification algorithm, with k=1, is used to obtain the best matching class coefficients. The number of dimensions is reduced in the instances mode and the distances mode from 50 to 5 and 25 to 5 ,respectively, to observe the behaviour and the sensitivity of the system for the information in these modes. To validate and test the performance of our classifier, we also used k–nn (with k=1 again) directly in the feature space to do classification. We compared our results with k–nn to observe the strengths and weaknesses of our classifier. V. R ESULTS
B. Labeled Data Labeled data of tissue layers was needed for training and testing purposes. The image was to be classified in 20x20 pixel patches, and labeled data for the tissue classification was generated by splitting the images into tiles of the same size and labeling these tiles as either labyrinth, spongiotrophoblast or background. A total of 2200 regions were selected from one image slide as 800 for labyrinth, 800 for spongiotrophoblast and 600 for the background. 150 of these regions were used in training (50 for each region) and the rest is used for testing. The features introduced in this paper required an extra layer of classification to identify the components which are to be analyzed. To gather the data required for this step a randomized approach was taken. For each image 500 random pixels were chosen. Each pixel was then assigned to one of the following classes: red blood cells, nuclei, cytoplasm, and background. C. Classification with Spatial Measures To employ the features introduced in here requires two stages of classification. The first stage classifies pixels into the component classes of the tissues. After these classes in the image are identified, spatial features are generated by using
Fig. 3. Segmentation via two point correlation function. Dark gray-labyrinth, medium gray-glycogen, light gray-spongiotrophoblast.
A. k–Nearest Neighbor Let us first show the confusion matrix of the k-Nearest Neighbor algorithm. labyrinth spongio background
labyrinth 684 24 0
spongio 66 726 0
background 0 0 550
% 91.2% 96.8% 100%
k–nn achieves perfect accuracy for the background with 2 point correlation functions. The classification accuracy is above 90% in both of the other region. k-nn performs very well in Spongio regions and achieves a classification accuracy of 96.8%.
5
B. HOSVD With no dimensionality reduction, HOSVD yields the following confusion matrix: labyrinth spongio background
labyrinth 705 46 0
spongio 45 704 0
background 0 0 550
% 94% 93.9% 100%
Even with no dimensionality reduction, HOSVD classifier performs as good as k-nn. HOSVD improves the results to 94% in the labyrinth region but the accuracy decreases to 93.9% for spongio. The classification accuracy is still 100% for the background. C. HOSVD results after dimensionality reduction We reduced the number of dimension with respect to the instance mode and distance mode, both separately and combined. The following plot shows the classification accuracies for all classes when the dimension is reduced in only the instance mode, with full 25 distances.
Fig. 5. mode
Classification accuracies wrt to dimensionality changes in distance
When we reduce the dimensionality in the distance mode, the classification accuracy for the Labyrinth almost monotonically decreases, whereas spongio doesn’t seem to be effected by this change. The power of this technique is the ability to control the dimensions to improve the classification that we are interested in. A choice that does not discriminate in between the regions would be to reduce the dimensionality by 30 in instances mode and by 2 in distance mode. This setup produces the following confusion matrix: labyrinth spongio background
labyrinth 692 35 0
spongio 58 715 0
background 0 0 550
% 92.3% 95.3% 100%
VI. S UMMARY Fig. 4. mode
Classification accuracies wrt to dimensionality changes in instances
The recognition rate peaks up for labyrinth when we use about 35 examples per class, for labyrinth. On the other hand, spongio wants to have less samples and it peaks up when we reduce the dimensionality to 9. These numbers indicate that the variance of features describing spongio is mostly due to the noise, whereas the variance for the labyrinth is due to the variation in the data. Here are the confusion matrices for both cases (35 and 9 respectively) labyrinth spongio background
labyrinth 717 53 0
spongio 33 697 0
background 0 0 550
% 95.6% 92.93% 100%
labyrinth spongio background
labyrinth 617 30 0
spongio 133 720 0
background 0 0 550
% 82.3% 96.3% 100%
When we repeat the analysis for the distance mode, we obtain the following plot:
In this paper we described the N -point correlation functions and proposed a new classifier to be used with these functions . The preliminary results in segmenting tissue regions of mice a placenta, are promising. The N -point correlation functions are powerful texture descriptors and HOSVD classifier gives much more control to the user. VII. ACKNOWLEDGEMENT The authors would like to thank Human Cancer Genetics, OSU R EFERENCES [1] Mouse Genome Sequencing Consortium, “Initial sequencing and comparative analysis of the mouse genome,” Nature, vol. 420, pp. 520–562, 2002. [2] T. Yoo, Insight Into Images, A. K. Peters, 2004. [3] S. Torquato, Random Hetrogenous Material, Springer Verlag, 2004. [4] R.M. Haralick, K. Shanmugam, and I. Dinstein, “Textural features for image classification,” IEEE Transactions on Systems, Man and Cybernetics, pp. 610–621, 1973. [5] K. Huang and R. F. Murphy, “Automated classification of subcellular patterns in multicell images without segmentation into single cells,” in IEEE Intl Symp Biomend Imaging (ISBI 2004), 2004, pp. 1139–1142.
6
[6] V. Sundararaghavan and Zabaras N, “Classification and reconstruction of threedimensional microstructures using support vector machines,” Computational Materials Science, vol. 32, pp. 223–239, 2005. [7] M. Teverovskiy1, V. Kumar, J. Ma, A. Kotsianti, D. Verbell, A. Tabesh1, H-Y. Pang, Y. Vengrenyuk, S. Fogarasi1, and O. Saidi, “Improved prediction of prostate cancer recurrence based on an automaed tissue image analysis system,” in International Conference of Machine Learning Applications, 2002, pp. 257–260. [8] S. Petushi, C. Katsinis, C. Coward, A. Tozeren, and F. Garcia, “Automated identification of microstructures on histology slides.,” in ISBI, 2004, pp. 424–427. [9] B. L. Luck, K. D. Carlson, A. C. Bovik, and R. R. Richards-Kortum, “An image model and segmentation algorithm for reflectance confocal images of in vivo cervical tissue,” IEEE Transactions on Image Processing, vol. 14, no. 9, pp. 1265–1276, 2005. [10] L. de Lathauwer, B. de Moor, and J. Vandewalle, “A multilinear singular value decomposition,” in SIAM Journal of Matrix Analysis and Applications, 2000, vol. 21(4), pp. 1253–1278. [11] M. A. O. Vasilescu and D. Terzopoulos, “Multilinear subspace analysis for image ensembles,” in Proc. Computer Vision and Pattern Recognition Conf. (CVPR ’03), 200, vol. 2, pp. 93–99.