Optimising the Colour Image Segmentation Primo Zingaretti, Guido Tascini, Luca Regini Istituto di Informatica, University of Ancona
[email protected]
Abstract. The paper describes an image segmentation method based on a genetic algorithm which optimises a pipelined image thresholding module. The process evolves in a sequence of steps; at each step a genetic algorithm evolves previous segmentation results until a satisfactory segmentation is achieved. A main goal of our system is to perform the segmentation without using neither ground-truth information nor human judgement or cues on the context of the task that will use the results.
The system has been tested on various real images by stopping the evolution either when a given fitness threshold is reached or after a fixed number of iterations was performed. Whenever the process stopped because the fitness exceeded the given threshold, apart from the possible different uses of the segmented image, the results show to be consistent with respect to a human segmentation. In the other cases, there is a high probability that the input images are highly textured or too much smoothed, as experimental tests have shown.
1 Introduction The purpose of this paper is to describe the segmentation of colour images by means of a genetic algorithm [5] for the optimisation of image thresholding parameters. Image segmentation is a very important process because it is typically the first task of any automatic image understanding process, and all subsequent steps, such as feature extraction and classification, object detection and recognition, depend heavily on its results. The result of image segmentation is a set of disjoint regions whit similar characteristics (intensity, colour, etc.). Many different segmentation algorithms have been developed [7, 9] as a consequence of two main aspects. First, measures for judging the quality of segmentation results [7, 15] are difficult to define and some authors (e.g., Borra and Sarkar [3]) argue that segmentation performance can be evaluated only in the context of a well established task. Second, most of developed algorithms can be successfully applied only for a given application (i.e., to one class of images) and after a complicated process for the selection of the control parameters (often numerous) that must be adjusted to obtain an optimal performance. Colour image segmentation is typically done with algorithms which rely on Euclidean distance as a colour similarity measure. The introduction of vector angles on a similarity measure and a transformed k-means algorithm constitute a well-known approach [17]. An alternating way of clustering colours is constituted by a Mixture of Principal Components Algorithm. The most important characteristic of our approach is that the segmentation results are obtained without any a priori information on the type of image under processing and without any cues on the context of the task that will use the results (even if we consider this knowledge fundamental for the post-processing steps). As regard the first aspect, while our algorithm performance, at present, can be compared with existing algorithms only by evaluating visually and qualitatively the
segmentation results, nevertheless these results are quantitatively measured by the fitness function of the genetic algorithm used for the optimisation of colour segmentation. As a consequence of the second aspect, image thresholding techniques, which usually are further classified in global, local, region or edge based techniques, can be used successfully only in the processing of those images that present a sufficiently well defined structure (and poor results should be expected for highly textured images or low contrast images). This applies also to our approach, which is mainly based on a histogram thresholding technique. The paper is organised as follows. Section 2 describes the genetic image segmentation process. Experimental results are presented in Section 3, while some conclusions and future improvements in Section 4.
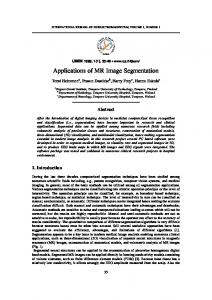
2 GA colour segmentation Our segmentation system is based on the multithresholding of the intensity histogram [13] because histogram-based thresholding is computationally simpler than other existing algorithms and does not need a priori information about the input image. While thresholding is a popular image segmentation method, the selection of optimum thresholds has remained a challenge over decades and many methods for automatic threshold selection have been reported [9]. Most of existing methods are based on histogram analysis using information-theoretic approaches. Only recently the problem of the optimum threshold selection has been faced as an optimisation process of fitness [2, 16] or energy functions [12] that consider both histogram based properties and image morphology. In a previous work [16] we presented a two-layer evolutionary image segmentation system for grey level images. On the contrary, in this paper we describe an unsupervised system for colour images. These images are characterised by much more information and thus they further justify the use of an optimisation technique for threshold selection. Image segmentation is formulated in this paper as an optimisation problem. A genetic algorithm (GA) [5] is used to efficiently search, in the hyperspace of segmentation parameters, the set that maximises the segmentation quality criteria. GAs have been recently applied in machine vision problems (in particular, in image segmentation [2, 4] and edge detection [1]) mainly because they can locate an approximate global maximum in a search space in a way not dependent on the particular application domain and without using detailed knowledge about the processing technique. Starting from an initial random population of N (N=20 in our case) individuals, the system performs N segmentations of the input image according to the parameters of each individual. A fitness is then evaluated for each resulting image and the GA cycles (i.e., genetic operators are applied on the processing parameters of these individuals) until the fitness does not exceed a given threshold or a maximum number of iterations is reached. The multithresholding, summarized in Fig. 1, is a pipelined process. First, the image is converted in HSL colour space due to its known perceptual characteristics. Because color information is meaningless at low saturation, a pixel is assumed to have a valid hue value only if the corresponding saturation is above a threshold. The algorithm starts from the analysis of the saturation histogram. The algorithm separates the input image into chromatic and achromatic regions by introducing a threshold in the saturation histogram. The position of the threshold is codified in the genetic string and can assume a value between 5% and 35%. All pixel with a saturation value under the threshold are classified as achromatic (grey tones), the other ones are classified as chromatic (colour tones). From this points the two components are processed separately. Grey tones are processed by autothresholding the lightness histogram. Colour tones are processed on three layers, one for each chromatic component: respectively hue, saturation and lightness. The regions resulting from each process are saved and resumed in the last stage of the whole process.
In both cases the segmentation algorithm performs an autothresholding on multimodal histograms. In this process every valley of the histogram defines a threshold and two adjacent thresholds identify an interval. As a great number of thresholds causes a too detailed segmentation we set constraints on the results of the autothresholding (e.g., only one threshold is admitted on the global saturation histogram) and we always apply two iterative operations: the histogram smoothing and the selection of the less significant interval to be merged with one of its two neighbours. The parameters for the smoothing operations (i.e., the number of smoothing cycles and the weights of each bin in the smoothing window ) are codified in the genetic string. These processes greatly reduce the number of detected thresholds while preserving ‘dominant’ colours. After the histogram smoothing we analyse the remaining modes using a merge procedure. This procedure first determines the highest difference between a peak and a valley and then eliminates the interval with the minimum difference if this difference is lower than a certain percentage of the highest difference, called "merge factor". For each type of processed histogram the "merge factor" is codified in the genetic string separately. In the processing of colour tones, the algorithm first analyses the hue component and performs the histogram autothresholding. The intervals obtained are processed again: all regions with a size that is lower than a certain percentage of the size of the chromatic region are saved and considered well segmented; the others are passed to the next layer for the processing by another chromatic component (in the order: saturation and lightness). The size used as threshold for separating small and big regions is coded in the genetic string separately: one parameter for each chromatic component. At the end of the process all resulting regions are joined together to obtain the segmented image for which a fitness will be computed. In the next sub-sections we describe in detail the two parts that constitute the knowledge structure of each individual of the GA population: segmentation parameters (processing alternatives) and fitness (used to quantitatively evaluate the segmentation effectiveness).
Figure 1. System architecture.
2.1 Segmentation parameters The main parameters coded in the segmentation parameter part of each individual of the GA are: (pre)processing operations (such as averaging, sharpening and median filtering, noise removal and introduction of local characteristics in the image intensity histogram by using gradient and laplacian operators [14]); number of histogram averaging (to modify the number of thresholds by which the image will be segmented); central band weight in the smoothing window (to modify the rapidity of
smoothing at each iteration); saturation threshold (to separate the chromatic and achromatic regions in the input image); merge factors for hue, saturation and lightness; size threshold for hue and saturation; coefficient of small object removal (to determine the max size of the resulting regions that will be removed from the resulting image). 2.2 Fitness Function The evolution of the segmentation process strictly depends on the chosen fitness function. The fitness function we have adopted exploits both the edge maps resulting from the application of an edge detector and the boundary maps obtained as contours of regions obtained from segmentation. Thus, we perform edge detection to assess the performance of region segmentation and in this sense our method integrates region-based with edge-based segmentation techniques [6, 10]. In this context, segmentation results suffer from three kinds of errors: 1) false boundary - a region boundary is not an edge and there are no edges nearby (for example, if our uniformity criterion is to keep intensity approximately constant over a given area and the light intensity varies linearly within a region then artificial boundaries need to be set even if there is no clear line where a transition occurs); 2) imprecise boundary - a region boundary does not coincide with an edge (for example, highlights may displace the real region boundary, at least in some of its parts); 3) missing boundary - there exist edges in the image with no region boundaries near them. It should be pointed out that if we reduce errors of the last kind by performing an over-segmentation (for example, by allowing small valleys in the histogram or by gathering thresholds according to different criteria) the probability of errors of the first kind will increase. We have chosen as fitness criterion the correspondence between the boundaries (one pixel in thickness) of regions resulting from segmentation (boundary map) and edges obtained from the binarization of Roberts’ edge operator (edge map). This correspondence is difficult to find out in real images even in presence of a good segmentation, so we compute two types of correspondences: F1, an exact correspondence between boundaries and edges, and F2, a correspondence with tolerance. The global fitness is then computed using the following formula:
Ftot =
F1 + F2 N2
where: F1 is the number of pixels resulting from a logical 'and' between boundary and edge maps; N2 is the total number of pixels in the image obtained from the binarization of the edge map at the threshold that minimizes the difference between the total number of pixels in the boundary map and the pixels resulting from the binarization itself; F2 is the number of edge pixels that have a distance 1 from any boundary pixel in the corresponding boundary map.
3 Experimental results The system has been tested on various real images, and compared with human decisions, by stopping the evolution either when a given fitness threshold is reached or after a fixed number of iterations (5000 in our case)was performed. In most of the cases when the second condition occurred the resulting image did not really exhibit a great correspondence with the segmentation performed by a human. That is, the system failed in getting a good segmentation. Anyway, the analysis of the input images led us to conclude that the problem arose from a bad edge map, either for the presence of many textures or images for which the Roberts’ operator was unable to detect
edges (in particular, kernels of higher dimensions were necessary). On the contrary, when the fitness exceeded the given threshold (higher than 0.85), apart from the possible different uses of the segmented image, the results were always consistent with respect to a human segmentation. In order to describe the performance of our pipelined segmentation method, let us discuss the elaborations and the results obtained for the standard colour image "airplane", shown in Fig. 2. The convergence of the genetic algorithm is shown in Fig. 3 where both the maximum fitness value as well as the average of the fitness of the 20 individuals that constituted the genetic population at each iteration are displayed. After the rapid growing during the first iterations, the GA took up to 378 cycles before overcoming the given fitness threshold of 0.9. It should be outlined that we did not adopted any learning technique or training set to select a more suitable initial population, so in many cases the number of necessary iterations could result very lower. The analysis of intermediate results has suggested some interesting clues for future improvements. During the first iterations the fitness rapidly reaches a value higher than 0.5 and, what is more important, over this fitness value the more perceptually relevant regions are already emphasized. For example, see the segmented image reported in Fig. 4, which was obtained after only 20 iterations. A second indication concerns the presence of small regions, which can often be regarded as noise. The analysis of the behaviour of the fitness function has pointed out that the presence of small / noisy regions is initially useful to compensate for missing boundaries but soon the GA converges towards a noiseless solution, in general by increasing the minimum size of valid regions, which implies a merge with an adjacent region. Fig. 5, on the left-side, shows the result of the colour edge detection of the input image using the Roberts’ operator on all the three chromatic bands and then reporting the maximum value for each pixel. On the right-side of Fig. 5 the result of the binarization of the edge map on the left-side is shown. As above mentioned, the binarization threshold has been selected as the value that minimizes the difference with the total number of pixels in the boundary map (Fig. 6 left-side). Finally, on the right-side of Fig. 6, the image that stopped the GA is shown. It got a fitness of 0.92, which is well justified by the detection of most of the observable objects in the input image, characters included. Apart from few small / noisy regions, the unique error that could be detected with respect to a human segmentation is the missing of some boundary parts of the airplane. But this can not be considered an error in our system, because, really, these boundary parts belong to the recognition process and not to the segmentation process. Human beings only with great difficulty can separate this two fundamental vision processes and, unfortunately, approaches for the evaluation of segmentation algorithms like the one described in [16] are injured by this fact.
1,0 0,9 0,8
0,6 0,5 0,4 0,3
M axim um Fitn ess Averag e Fitness
0,2 0,1
G eneration
379
358
337
316
295
274
253
232
211
190
169
148
127
85
106
64
43
1
0,0 22
Fitness
0,7
Figure 2. The standard colour image “airplane”.
Figure 3. The evolution of the fitness function.
Figure 4. The boundary map (left-side) of the regions (right-side) resulting after 20 GA iterations.
Figure 5. The colour edge map of image “airplane” (left-side) and the result of its final binarization (right-side).
Figure 6. The boundary map (left-side) of the regions (right-side) resulting after 378 GA iterations.
4 Conclusions In this work we have described an unsupervised approach to image segmentation that does not use neither ground-truth information nor human judgement or cues on the context of the task that will use the results. In particular, we have described the characteristics of the GA-based system adopted for the selection of optimal image segmentation parameters and the pipelined architecture of the segmentation process. The choice of an unsupervised approach was made in order to define the limits of the proposed method, while great improvements appear to be possible without requiring substantial modifications of the structure. For example, in most cases, and in image retrieval applications, in particular, it is important to find the few most important objects or the more perceptual relevant regions that better describe the contents of the image. A rough image segmentation would be more appropriate for these cases [11]. Thus, if we should follow this task, our system should penalize (by coding new adhoc post-processing procedures in the genetic string or simply by increasing the size of the smallest region) those regions that do not conform to the specific task. Experimental results exhibit a promising performance for the proposed method. In fact, when it is possible to obtain a final segmented image with a fitness higher than 0.85 the results are consistent with respect to a human segmentation. In the other cases, there is a high probability that the input images are highly textured or too much smoothed. Future works will focus on the developing of methods able to process successfully also this kind of images and on a comparative evaluation of our segmentation algorithm, for example by using the benchmark described in [8].
References [1] S.M.Bhandarkar, Y.Zhang, W.D.Potter, An Edge Detection Technique Using GA-Based Optimisation, Pattern Recognition, 27(9), 1159-1180, 1994. [2] B.Bhanu, S.Lee, J.Ming, Adaptive Image Segmentation using a genetic algorithm, IEEE Trans. on SMC, 25(12), 1543-1567, 1995. [3] S.Borra, S.Sarkar, A framework for performance characterization of intermediate-level grouping modules, IEEE Trans. on PAMI, 19(11); 1306-1312, 1997.
[4] D.N.Chun, H.S.Yang, Robust image segmentation using genetic algorithm with a fuzzy measure, Pattern Recognition, 29(7), 1195-1211, 1996. [5] D.E.Goldberg, Genetic Algorithms in Search, Optimisation, and Machine Learning, AddisonWesley, Reading, MA, 1989. [6] J.F.Haddon, J.F.Boyce, Image Segmentation by unifying region and boundary information, IEEE Trans. on PAMI, 12(10); 929-948, 1990. [7] R.M.Haralick, L.G.Shapiro, Image segmentation techniques, Computer Vision, Graphics, and Image Processing, 29, 100-132, 1985. [8] D.Martin, C.Fowlkes, D.Tal, J.Malik, A database of human segmented natural images and its application to evaluating segmentation algorithms and measuring ecological statistics, Proc. 8th IEEE Int. Conf. On Computer Vision (ICCV 2001) , 416-423, 2001. [9] N.R.Pal, S.K.Pal, A review on image segmentation techniques, Pattern Recognition, 26, 12771294, 1993. [10] J.T.Pavlidis, Y.T.Liow, Integrating region growing and edge detection, IEEE Trans. on PAMI, 12(3); 225-233, 1990. [11] P.Saha, J.Udupa, Optimum image thresholding via class uncertainty and region homogeneity, IEEE Trans. on PAMI, 27(7); 689-706, 2001. [12] M.Tico, T.Haverinen, P.Kuosmanen, An unsupervised method of rough color image segmentation, 33rd Asilomar Conf. on Signals, Systems, and Computers, vol.1, 58-62, 1999. [13] S.Wang, R.M.Haralick, Automatic multithreshold selection, Computer Vision, Graphics, and Image Processing, 25, 46-67, 1984. [14] J.S. Weszka, A.Rosenfeld, Histogram modification for threshold selection, IEEE Trans. on SMC, 9(1), 38-52, 1979. [15] Y.J.Zhang, A survey on evaluation methods for image segmentation, Pattern Recognition, 29(8), 1335-1346, 1996. [16] P.Zingaretti, A.Carbonaro, P.Puliti, "Evolutionary image segmentation", in Image Analysis and Processing, 9th Int. Conf. ICIAP'97, A.Del Bimbo Ed., Lecture Notes in Computer Science, Springer-Verlag, Berlin-Heidelberg, vol. 1310, 247-254, 1997. [17] Paul W. Fieguth, Slawo Wesolkowski: Highlight and Shading Invariant Color Image Segmentation Using Simulated Annealing. EMMCVPR 2001: 314-327