Image Transformation and Geo-Statistical Techniques to Assess Sedimentation in Southern Nepal
Image Transformation and Geo-Statistical Techniques to Assess Sedimentation in Southern Nepal D. P. Shrestha* International Institute for Geo-Information Science and Earth Observation (ITC) P. O. Box 6, 7500 AA Enschede, The Netherlands Abstract A method is proposed to transform the red and near infrared data into a soil index in order to map soil features. The index maximises soil variation and helps improve soil feature mapping while suppressing spectral response from vegetation cover. Geo-statistical analysis of field data, on the other hand, helps understand spatial dependency pattern and map it, which may not be directly visible by remote sensing techniques. A case study in mapping sedimentation problem in the lowlands of Nepal is described. Yearly deposit of silt brought by irrigation water degrades soil physical condition and lowers fertility status, which results in eventual reduction of crop yield. Image transformation by means of band rotation helps generate soil index, which allows not only mapping areas affected by sedimentation but also separating sediment deposition areas into old, moderately old and fresh sediment deposition. On the other hand spatial variability study, using field data collected at fixed intervals of 12.5, 25 and 50 m along transects at 50 and 100 m apart, helps understand sediment deposition pattern which is not directly visible in remote sensing technique, also it helps map its aerial extent, using interpolation by Kriging. Estimation by ordinary kriging incorporating limiting distance and defining minimum points within the limiting distance threshold value minimised error of estimation.
1. Introduction In evaluation of land resources, soil data is very important. It is especially crucial for the study of soil degradation. Remote sensing techniques help increase accuracy and efficiency of mapping. Surface reflectance from soil, however, depends on many factors: particle size distribution, surface roughness, crusting, soil colour, presence of vegetation in the instantaneous field of view in case that it is not pure soil, etc. On the other hand, not all the properties of soil can be directly detected and mapped using remote sensing techniques. Research works related to mapping/evaluating land resources by means of remote sensing have concentrated mainly on vegetation cover (Tucker, 1979; Curran, 1980; Jackson et al., 1983). Because of high absorption of visible light by plants, especially in red (R) portion of spectrum and high reflectance of radiation from near infrared light (IR), vegetation indices have been generated by band ratios (IR/R ratio) or computing their differences (IR–R). The most popular has been the Normalised Difference Vegetation Index (NDVI). Here the difference is normalised by their sum (IR+R) to eliminate intensity variations. A vegetation index can be also generated by using © 2005 AARS, All rights reserved. *
Corresponding :
[email protected] Tel: +31-53-4874-264 Fax: +31-53-4874-336
24
characteristic pixels representing pure vegetation (100% vegetation sample) and pure soil (0% vegetation) and computing their differences (Nieuwenhuis and Shrestha, 1984), which is used as transformation vector. In this case, all the spectral bands are used, instead of only red and infrared bands. However, application of remote sensing techniques for the study of soil has been modest, perhaps because soil is often covered by vegetation. An attempt to remove the spectral effects of the vegetation in the mixture model of soil and vegetation reflectance by estimating the vegetation component is shown by Hamid (1985). Kauth and Thomas (1976) described, using the famous “triangular, cap shaped region with a tassel” in Red-NIR space using MSS data, that the point of the cap (which lies at low red reflectance and high NIR reflectance) represented regions of high vegetation and that the flat side of the cap directly opposite the point represented bare soil. In addition to the problem of surface cover by vegetation, soil features cannot be optimally mapped since soil brightness values fall within a narrow range in the spectral bands from the commonly available sensors, except for some areas having very contrasting soils. Digital terrain modelling has been used in combination with sensor data for classifying soil. Prediction of soil properties using
Asian Journal of Geoinformatics, Vol. 5, No. 3 (2005)
DTM shows that the concept of accumulation, transit and dissipation zones are more appropriate than the prediction based on linear regression (Florinsky et al., 2002) which are related to soil properties such as particle size distribution, soil moisture and organic matter content of top soil, etc. For prediction of soil moisture, microwave data is reported to be successful (Ugsang et al., 2001; Patel et al., 2002; Shrivastava et al., 2002). On the other hand, the use of reflectance spectral libraries generated by spectral measurement of a large set of soil samples within the range of 0.35 to 2.5 µm wavelength with 1 nm interval under laboratory conditions is reported to give significant results in characterising soil properties (Shepherd and Walsch, 2002). The application of spectral libraries to field conditions however is still questionable since surface reflectance is governed by so many factors in addition to the inherent mixed pixel model. Moreover, the satellite-based sensor systems still do not have hyperspectral sensing to have almost continuous spectra of objects such that application of unmixing becomes feasible. Use of commonly available remote sensing data to enhance soil features thus plays still an important role. Soil feature enhancement and mapping however are limited to the soil surface only. Some features may not be directly detected by remote sensing techniques, such as soil depth, soil compaction, soil pollution, etc. In such a case soil spatial variability analysis helps in understanding regionalized variation pattern and mapping such features, which may be very useful in applying suitable management practices and finally in alternate land use planning activities. In the present paper a method to transform data obtained in the red and the near infrared portion of electromagnetic spectrum by means of rotation of axis is given. The transformed image maximises soil surface features, which helps in further classification of soil. In order to classify soil properties not directly detectable by remote sensing techniques, spatial variability analysis and interpolation techniques are proposed. The methods are applied in a case study in southern part of Nepal where sedimentation is an issue in agricultural fields. Soil erosion is a well-known problem in mountainous areas because of slope steepness. Although Bruijnzeel and Bremmer (1989) state that the erosion issue in Nepal is more related to nature than to human influence, land degradation is also influenced by cultivation practices and by how the farmer uses the land (Shrestha et al., 2004). This is especially important in Nepal, where more than 80% of the land surface is occupied by mountains with rugged topography and steep to very steep slope gradients, often exceeding 100%. The problem is not limited to the areas where erosion takes place. Downstream, the sediments carried by the rivers cause damage to the infrastructures, silting up of the reservoirs and finally sediment deposition in the agricultural fields under irrigation. In Nepal, several irriga-
tion schemes have been developed in the low-lying areas of the southern plain. One of the consequences of applying sediment-loaded water to agricultural fields is the decline of crop production. Because of the mineral composition of the sediments it has negative influence on soil fertility. Yearly deposit of silt brought by irrigation water degrades soil physical condition and lowers fertility status.
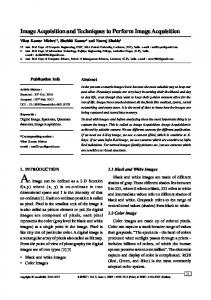
2. Methods and Techniques 2.1 Study Area The study area lies in the Chitwan valley, within the Siwalik region of Nepal. The investigated area (Figure 1) lies between the coordinates 27°36’05” and 27°43’23” N and 84°19’ 27” and 84°27’56” E, covering 19,175 hectares. The elevation ranges from 180 to 220 m asl. This region includes predominantly north dipping, semi-consolidated, interbedded Tertiary conglomerate, sandstone, siltstone and shale units. The region is bordered to the south by the Terai piedmont and to the north by the Main Boundary Fault, which separates the Tertiary sediments of the Siwalik from the older bedrocks of the Middle Mountains.
Figure 1: The study area
25
Image Transformation and Geo-Statistical Techniques to Assess Sedimentation in Southern Nepal
The area has a subtropical climate, with hot/moist summers and cool/dry winters. The average annual temperature is 24°C. The mean summer temperature is 29°C and the hottest months are May and June, with absolute maximum-recorded temperature of 43°C in June. The mean winter temperature is 16°C and the coldest months are December and January, with absolute minimum temperature of 3°C in January. The annual precipitation varies from 1584 mm to 2287 mm, with an annual average of 1830 mm, calculated from a 10-year period. More than 80% of the rain falls in the rainy season, during the period June September. The winter months (November-March) are dry and, in some years, these months do not receive any precipitation at all. In Figure 2, mean monthly precipitation is plotted versus monthly estimates of potential evapotranspiration, based on data obtained from Department of Irrigation, Hydrology and Meteorology, Nepal. The empirical formula of Blaney and Criddle (1950, 1962) was used to estimate the potential evapotranspiration such as U = kf, where U is the monthly consumptive use of the crop, k is the empirical crop coefficient and f is the climatic factor. The latter is the product of the mean monthly air temperature, t, and the monthly percentage, p, of daylight hours in relation to the annual total of daylight hours, such as f = p(0.46 t + 8.13). The calculated annual potential evapotranspiration is 1954 mm, which exceeds the average annual precipitation of 1830 mm. Moisture deficit during the months October through May is 679 mm, which shows that irrigation is necessary for growing crops. Main vegetation types in the lowlands are acacia (Acacia catechu) and sisal trees (Dalbergia sp.), shrubs and coarse grasses. Field crops such as rice, wheat, maize and mustard are grown. With the introduction of irrigation water, rice fields have considerably increased in the area. In the Chitwan valley irrigation water from the Narayani river brings a lot of sediments to the agricultural fields. During the period June-September, the estimated mean
sediment concentration in the water is above 1000 mg/l of which 75% are retained in the irrigation canals and the rest is deposited on the agricultural fields (Shrestha, 2000). The sediments include a high proportion of silt (2-50 µm) and fine sand (50-250 µm). Quartz, mica and feldspar dominate the mineralogy of the silt fraction. The sediments have an appreciable amount of calcium carbonate (up to 14%). The siltation sediments are greyish fresh unweathered minerals, with very low organic matter content (