Impact of Packet Sampling on Anomaly Detection Metrics Daniela Brauckhoff, Bernhard Tellenbach, Arno Wagner, Martin May Department of Information Technology and Electrical Engineering Swiss Federal Institute of Technology (ETH) Zurich, Switzerland
Anukool Lakhina Department of Computer Science Boston University Boston, MA
[email protected]
{brauckhoff, tellenbach, wagner, may}@tik.ee.ethz.ch
ABSTRACT Packet sampling methods such as Cisco’s NetFlow are widely employed by large networks to reduce the amount of traffic data measured. A key problem with packet sampling is that it is inherently a lossy process, discarding (potentially useful) information. In this paper, we empirically evaluate the impact of sampling on anomaly detection metrics. Starting with unsampled flow records collected during the Blaster worm outbreak, we reconstruct the underlying packet trace and simulate packet sampling at increasing rates. We then use our knowledge of the Blaster anomaly to build a baseline of normal traffic (without Blaster), against which we can measure the anomaly size at various sampling rates. This approach allows us to evaluate the impact of packet sampling on anomaly detection without being restricted to (or biased by) a particular anomaly detection method. We find that packet sampling does not disturb the anomaly size when measured in volume metrics such as the number of bytes and number of packets, but grossly biases the number of flows. However, we find that recently proposed entropy-based summarizations of packet and flow counts are affected less by sampling, and expose the Blaster worm outbreak even at higher sampling rates. Our findings suggest that entropy summarizations are more resilient to sampling than volume metrics. Thus, while not perfect, sampling still preserves sufficient distributional structure, which when harnessed by tools like entropy, can expose hard-to-detect scanning anomalies.
1. INTRODUCTION Traffic sampling has emerged as the dominant means to summarize the vast amount of traffic data continuously collected for network monitoring. The most prevalent and widely-deployed method of sampling traffic is packet sampling, where a router inspects every n-th packet (uniformly at random), and records its features (addresses, ports, protocol, and flags). Packet sampling is attractive because it is computationally efficient, requiring minimal state and counters, and is implemented in high-end routers today (e.g.,with NetFlow [4]). As such, many large networks (ISPs and enterprizes)
Permission to make digital or hard copies of all or part of this work for personal or classroom use is granted without fee provided that copies are not made or distributed for profit or commercial advantage and that copies bear this notice and the full citation on the first page. To copy otherwise, to republish, to post on servers or to redistribute to lists, requires prior specific permission and/or a fee. IMC’06, October 25–27, 2006, Rio de Janeiro, Brazil. Copyright 2006 ACM 1-59593-561-4/06/0010 ...$5.00.
are now using packet sampling to obtain rich views of traffic directly from routers. But, while being attractive because of efficiency and availability, sampling is inherently a lossy process, where many packets are discarded without inspection. Thus sampled traffic is an incomplete and more importantly, a biased approximation of the underlying traffic trace, as small flows are likely to be missed entirely. Previous work has largely focused on analyzing this bias, devising better sampling strategies [3], and recovering statistics (moments and distribution) of the underlying traffic trace using inference [5, 6, 8]. Sampled traffic views have recently been used for anomaly detection with considerable success [11, 13]. But, little is known about the fidelity of the sampled stream for these applications, and basic questions remain unanswered; for example: how complete are the detections revealed by these methods on sampled traffic? and: what kind of anomalies are discarded by packet sampling? There is little previous work on how sampling impacts network monitoring applications, in particular, anomaly detection. Two notable studies are [15] and [14]. In [15], Mai et al analyzed how packet sampling impacts three specific portscan detection methods, TRWSYN [10], TAPS [17] and entropy-based profiling method of [13, 21]. Recently, this work was extended to analyze the impact of other sampling schemes in [14]. Both studies conclude that packet sampling is inadequate to detect anomalies using these detection methods. Instead of focusing on the the performance of specific anomaly detection methods to sampling as these studies have, our study seeks to answer a more basic question: how does packet sampling impact detection metrics? We study this problem by examining the impact of packet sampling on anomaly size as viewed through various detection metrics. In this paper, we rely on a unique week-long dataset of unsampled flow records with the Blaster worm anomaly, collected from backbone routers of a national ISP. We then simulate packet sampling to construct sampled views of the same traffic trace and ask how the sampled views differ from the original trace with respect to different anomaly detection metrics. Because we know the exact characteristics of the anomaly in our trace, we can build the ideal normal baseline that all anomaly detection methods would strive to build. We then study the size of the worm anomaly, which is measured as the distance from our ideal baseline, at increasing sampling rates and for different anomaly detection metrics. The size of an anomaly determines how effective any detection method will be at exposing the anomaly. This approach allows us to gain general insight into the impact of sampling on the anomaly size for different metrics, without restricting (or biasing) us to a specific detection scheme. As a starting point, we investigate how packet sampling impacts
the three principal volume metrics (number of bytes, packets and flows), which have been used widely by many detection methods [1,2,12]. We find that packet sampling impacts byte counts and packet counts little, but impacts flow counts heavily. This finding suggests that anomalies that impact packet and byte volume only will stand out even in sampled traffic, but anomalies that impact flow counts alone (such as the Blaster worm in our data) are likely to be discarded by packet sampling. Therefore detection schemes based on flow volume alone are likely to be inadequate for sampled traffic. In addition to volume metrics, we also study the impact of packet sampling on feature entropy metrics [13, 19]. The authors of [13] showed that changes in distributions of traffic features (ports and addresses), when summarized by entropy, reveal a broad spectrum of anomalies. We evaluated how effective entropy is at exposing Blaster-type anomalies at increasing sampling rates. Our results here are surprising: we find that while flow volume is grossly impacted by packet sampling, flow entropy is disturbed little. In particular, the Blaster worm in our data when measured in flow counts is dwarfed significantly and is virtually undetectable at higher sampling rates, but the worm remains largely unaffected by sampling when measured from a baseline entropy. Thus, the structure of the Blaster worm, as captured by entropy, is preserved even at high sampling rates of 1 out of 1000. Our findings provide hope that even though packet sampling produces imperfect traffic views for anomaly detection, there are metrics (such as entropy) that allow us to harness useful information in sampled traces. The rest of this paper is organized as follows. We next provide an overview of our methodology. In Section 3, we introduce our anomaly detection model and study the impact of packet sampling on detecting flow-based anomalies. In Section 4, we conclude and outline directions for future work.
2. METHODOLOGY In order to systematically evaluate the impact of packet sampling on anomaly detection, one requires packet-level traces (at various sampling rates) that ideally meet two criteria: (1) the traces contain anomalies that are well understood, and (2) the traces span a long duration (days to week). Known anomalies allow for evaluations where the baseline is established using this knowledge. And, longer traces are needed to compare the normal traffic behavior with its diurnal and weekly pattern to the anomalous behavior. Unfortunately, legal requirements (data protection) and technical limitations (storage space), make it difficult to collect such detailed packet-level data. To circumvent the lack of suitable long-term packet traces, we decided to work with unsampled flow records and developed a method to reconstruct packet-level traces from these flow traces. In this section, we introduce our unique dataset, which meets the two criteria outlined above. We then describe our methodology for reconstructing the underlying packet-level trace from the flow traces. Once we have the reconstructed packet trace, we can apply packet sampling. We describe the sampling procedure, and present first results on the effect of sampling on volume and feature entropy metrics. Our results here underline the need to study flow-based anomalies in order to effectively evaluate the impact of packet sampling; the last subsection provides and example of such an anomaly (the Blaster worm) in our data.
2.1 Dataset We are collecting data from the Swiss Academic and Research Network (SWITCH) [18] since 2003. SWITCH is a medium-sized Swiss backbone operator, connecting all Swiss universities and var-
ious research labs (e.g.,CERN, IBM) to the Internet. The SWITCH IP address range contains about 2.2 million IP addresses. In 2003 SWITCH carried around 5% of all Swiss Internet traffic [16]. In 2004, we captured on average 60 million NetFlow records per hour, which is the full, unsampled number of flows seen by the SWITCH border routers. Basically, the border routers terminate and export a flow if one of the following conditions is met: (1) no packet has been received for 30 seconds, (2) a flow has been active for 15 minutes, implying that longer flows are split and recorded in multiple records, (3) a FIN or RST packet is received, and finally, (4) the router runs out of memory. For this paper, we collected unsampled data from the week of August 8 to August 15, 2003. This dataset is unique because it contains the Blaster worm outbreak described later in this section. However, this dataset is inadequate, because it does not contain the packet-level information needed to construct sampled views for subsequent analysis. Therefore, we must first reconstruct the underlying packet-traces from flow records.
2.2
Reconstructing Packet Traces
Our method to reconstruct the packet traces takes (unsampled) NetFlow records from the SWITCH network as input and generates the corresponding packet traces. The output format of the packet traces is again flow records with ”flows” that contain only one packet. In contrast to real NetFlow records, the packet traces contain ”flows” that are sorted according to their start time. The packet-trace reconstruction algorithm processes the flows in the order as they are stored in the flow traces. For each of these flows it does the following: First, the size of the packet is calculated by dividing the total number of bytes B by the number of packets N in the corresponding flow. Since the number of bytes in a packet is an integer but B/N does not have to be, some corrections are required. To preserve the total number of bytes in a flow, we create N packets of size ⌊B/N ⌋ and add to B mod N of them another byte. Afterwards, the time stamp of the packet is randomly selected within flow bounds and with a resolution of one millisecond. With this, the expected size of a packet in the flow is equal to B/N and the expected number of transferred bytes per millisecond is N/M . We choose this very simple approach to reconstruct the packet traces because the aggregation interval length is equal to the maximal flow length. Deviations from measurements with real packet traces occur only if a flow crosses the border of an aggregation interval (which occurs rarely). Furthermore, by choosing the same packet size for all packets, we preserve (on average) the often assumed (e.g., [7], [9]) constant throughput property of flows even if they are split over two intervals. Recently, the authors of [20] presented empirical evidence that the constant throughput property is a good approximation of the behavior of large flows (heavy hitter, elephant flows) while still being a reasonable approximation for small ones (mice flows).
2.3
Effects of Sampling on Byte, Packet, and Flow Metrics
Having reconstructed the packet traces from our NetFlow data, we can now look at how timeseries of volume and feature entropy metrics are impacted by packet sampling. Therefore, we sampled our one-week data set at four different sampling rates of 1 out of 10, 1 out of 100, 1 out of 250, and 1 out of 1000. The sampling method we applied is random probabilistic packet sampling. Thus, sampling at a rate of q we independently select each packet with a probability of q or discard it with a probability of 1 − q. Subsequently, we computed the timeseries of volume metrics (byte, packet, and flow counts), and feature entropy metrics (packet and
1.0e+10
no sampling, 15min bins, tcp in sampling 1/10, 15min bins, tcp in sampling 1/100, 15min bins, tcp in sampling 1/1000, 15min bins, tcp in
1.0e+09
1.0e+08
no sampling, 15min bins, tcp in sampling 1/10, 15min bins, tcp in sampling 1/100, 15min bins, tcp in sampling 1/1000, 15min bins, tcp in
1.0e+07
1.0e+08 1.0e+06
1.0e+07 1.0e+06
1.0e+05
1.0e+05 1.0e+04 1.0e+04 1.0e+03 08/08 00:00
08/09 00:00
08/10 00:00
08/11 00:00
08/12 00:00
08/13 00:00
08/14 00:00
1.0e+03 08/08 00:00
(a) Packet counts vs. Date and Time (UTC) 16.0
08/10 00:00
08/11 00:00
08/12 00:00
08/13 00:00
08/14 00:00
(b) Flow counts vs. Date and Time (UTC)
no sampling, 15 min bins, tcp in sampling 1/10, 15 min bins, tcp in sampling 1/100, 15 min bins, tcp in sampling 1/1000, 15 min bins, tcp in
14.0
08/09 00:00
no sampling, 15 min bins, tcp in sampling 1/10, 15 min bins, tcp in sampling 1/100, 15 min bins, tcp in sampling 1/1000, 15 min bins, tcp in
25.0
12.0
20.0
10.0 8.0
15.0
6.0 4.0
10.0
2.0 0.0 08/08 00:00
08/09 00:00
08/10 00:00
08/11 00:00
08/12 00:00
08/13 00:00
5.0 08/08 00:00
08/14 00:00
(c) Packet DST IP Entropy vs. Date and Time (UTC)
08/09 00:00
08/10 00:00
08/11 00:00
08/12 00:00
08/13 00:00
08/14 00:00
(d) Flow DST IP Entropy vs. Date and Time (UTC)
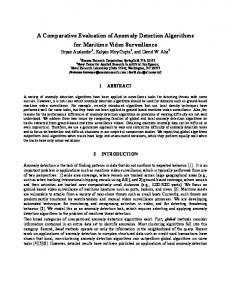
Figure 1: Impact of sampling on timeseries of selected metrics. Note that in Figure 1(a) and 1(b) the y-axis is log scale. The plots for sampling at 1 in 250 are not shown here to increase readability of the plots. flow entropy of IP addresses and port numbers). The problem with packet traces, which essentially contain no flow information, is that flow metrics (e.g., flow counts) cannot be directly inferred from them. One possibility would be to emulate the flow generation as it is done by e.g. NetFlow routers. Unfortunately, the process of how routers construct flows is not entirely deterministic, making reconstruction in this way problematic [4]. Thus, instead of trying to emulate a certain router behavior, we simply approximate i) flow counts by computing the number of unique 4-tuples of TCP flows; and ii) flow entropy by computing the entropy of unique events (e.g., destination IP addresses) within one interval. To illustrate the following discussion on sampling effects, a selection of the most meaningful timeseries is depicted in Fig. 1. As expected, Fig. 1(a) shows that packet counts are not disturbed by packet sampling. The unsampled values can simply be estimated by multiplying the sampled value with a factor of 1/q. Likewise, byte counts (not shown) are not impacted by packet sampling. This is due to the fact that the variation of packet sizes by a factor of 100 (between 40 and 1500 Bytes) is very small compared to the overall number of Bytes (≈ 1010 ) within one interval of 15 minutes. On the contrary, flow counts are heavily disturbed by packet sampling even at a sampling rate as low as 1 out of 10 (see Figure 1(b)). This can be explained with the fact that small flows (with only few packets) are sampled with a smaller probability compared to larger flows [6].
More interestingly, packet entropy metrics (Fig. 1(c)), as well as flow entropy metrics (Fig. 1(d)) are well preserved even at higher sampling rates. Though we see that packet sampling disturbs entropy metrics (the unsampled value cannot easily be computed from the sampled value as for byte and packet counts), the main traffic pattern is still visible in the sampled trace. This insight was the main motivation for this work.
2.4
Why the Blaster Worm
The primary reason to use the Blaster data as basis for our measurements is that it is primarily visible only in flow counts, a metric that is biased significantly by packet sampling. Therefore, the Blaster worm is an ideal candidate anomaly to study the (worstcase) effect of packet sampling on anomaly detection metrics. Blaster is also one of the thoroughly analyzed Internet worms. First observed on August 11, 2003, Blaster uses a TCP random scanning strategy with fixed destination and variable source port to identify potential infection targets. Specifically, the infected host tries to connect to port 135/TCP on the target machine.
3.
IMPACT OF SAMPLING ON ANOMALY DETECTION METRICS
In this section, we study the impact of sampling on common anomaly detection metrics. Rather than apply a particular anomaly detection method on sampled views of traffic, we adopt a more gen-
4.5e+07
baseline, no sampling, 15min bins, tcp in blaster outbreak, no sampling, 15min bins, tcp in
4.0e+07
3.0e+06
baseline, no sampling, 15min bins, tcp in blaster outbreak, no sampling, 15min bins, tcp in
2.5e+06 3.5e+07 3.0e+07
2.0e+06
2.5e+07 1.5e+06 2.0e+07 1.5e+07
1.0e+06
1.0e+07 5.0e+05 5.0e+06 0.0e+00 00:00
04:00
08:00
12:00
16:00
20:00
0.0e+00 00:00
(a) Packet counts vs. Time (UTC) 16.0
baseline, no sampling, 15min bins, tcp in blaster outbreak, no sampling, 15min bins, tcp in
26.0
14.0
24.0
12.0
22.0
10.0
20.0
8.0
18.0
6.0
16.0
4.0
14.0
2.0
12.0
0.0 00:00
04:00
08:00
12:00
16:00
04:00
08:00
12:00
16:00
20:00
(b) Flow counts vs. Time (UTC)
20:00
baseline, no sampling, 15min bins, tcp in blaster outbreak, no sampling, 15min bins, tcp in
10.0 00:00
(c) Packet DST IP Entropy vs. Time (UTC)
04:00
08:00
12:00
16:00
20:00
(d) Flow DST IP Entropy vs. Time (UTC)
Figure 2: Baselines for Selected Metrics. eral strategy. Our strategy is based on the observation that fundamentally all anomaly detection methods must first define “normal” behavior; anomalies then become deviations from this baseline behavior. So if we can build the “perfect” baseline for a specific metric (an objective that all anomaly detection methods will strive for), we gain insight into the fundamental impact of packet sampling on any anomaly detection method using this metric, in particular, the detection schemes with the “best” model for baseline behavior. In this section, we describe our method to determine the “ideal” profile for normal traffic. Then, we introduce how we measure the distance between the idealized baseline and the trace containing the Blaster worm for any given metric. We use this distance as measure for the Blaster anomaly size for different sampling rates. We then study the effect of packet sampling on the size of the Blaster anomaly, when viewed through flow counts and entropy. Finally, we validate the robustness of entropy-based profiling methods versus different anomaly intensities.
3.1 Determining the Baseline Since our intention is to analyze the effect of sampling on anomaly detection, we need to quantify and measure the factor by which sampling disturbs anomaly detection metrics. An accurate method to determine the level of disturbance is to measure the distance (or normalized distance) between “normal” traffic (from hereon called baseline) and “abnormal” traffic (traffic containing network anomalies). The difficulty faced by every anomaly detection method is to correctly determine the baseline.
For our study, we have the advantage that we know the Blaster anomaly in our trace very well. Thus, we are able to construct an “ideal” baseline by removing the traffic that constitutes to the anomaly. In our case, that is removing all traffic that matches a Blaster heuristic: all packets with destination port 135 and packet sizes of 40, 44, or 48 are removed. An alternative approach for determining the baselines would have been to use the average over some past time period. This is similar to what anomaly detection methods which are based on past behavior would do. Yet, our approach of removing the anomaly from the trace has two advantages: (1) it produces the “best-case” baseline model that any anomaly detection method could achieve, and (2) it is more general and is independent of the applied detection methods. The baseline and the original unsampled trace are depicted in Figure 2 for packet counts, flow counts, packet destination IP address entropy, and flow destination IP address entropy. While packet counts do only show a minor increase in distance before and after the Blaster outbreak, the other three metrics indicate a more drastic and visible change.
3.2
Measuring Anomaly Size
Having constructed the baselines and packet traces for different sampling rates and metrics, we now answer the question: How is anomaly detection impacted by packet sampling? To address this question, we measure the anomaly size with respect to different
1.000
0.250
pc, absolute difference, 17:00 fc, absolute difference, 17:00 pdip, absolute difference, 17:00 fdip, absolute difference, 17:00
0.800
0.200
0.600
0.150
0.400
0.100
0.200
0.050
0.000
pc, relative difference, 17:00 fc, relative difference, 17:00 pdip, relative difference, 17:00 fdip, relative difference, 17:00
0.000 1
10
100
250
1000
1
(a) Absolute Difference vs. Sampling Rate
10
100
250
1000
(b) Relative Difference vs. Sampling Rate
Figure 3: Anomaly size (measured as deviation from the baseline) vs. sampling rates for four metrics: packet counts (pc), flow counts (fc), flow dst IP entropy (fdip), and packet dst IP entropy (pdip). The plot shows the mean and 95% confidence interval over 12 sampling runs for one 15 minute interval. metrics at different sampling rates instead of focusing on a particular anomaly detection method. We define anomaly size as the distance between a sampled view x and the corresponding sampled ˆ . We determine the anomaly size by measuring the deviabaseline x tion from the baseline at each timebin using two distance measures: ˆ) • the absolute difference, defined as: (x − x ˆ )/ˆ • the relative difference, defined as: (x − x x In Fig. 3 we plot the sampling rate vs. the absolute difference (normed to the respective value of each metric in the unsampled trace) as well as the sampling rate vs. the relative difference for packet counts, flow counts, flow destination IP entropy, and packet destination IP entropy. The Figure shows four curves, one for each metric under investigation, at each sampling rate for one interval. We selected as representative interval, the first interval after the Blaster outbreak around 17:00 UTC. Let us consider volume metrics first. For the flow count metrics the absolute as well as the relative difference decrease drastically when sampling is applied. Thus, we confirm the results of previous work, namely that flow counts, while exposing Blaster very well in the unsampled data, are not a suitable metric for detecting flow-based anomalies when packet sampling is used. In contrast, packet counts are not impacted by packet sampling. Consequently, the relative difference for packet counts remains constant. However, the problem with packet counts is that Blaster-type anomalies which usually represent only a very small fraction of all packets (less than 1% in our backbone trace) are not very visible even in the unsampled data traces. The flow and the packet entropy curves stand in sharp contrast to flow counts. The absolute as well as the relative difference decrease only very slightly even for sampling rates as high as 1 out of 1000 for both the entropy metrics, implying that the size of the Blaster worm remains unaffected when viewed using entropy. For other intervals (not shown here) we find that flow entropy can even emphasize Blaster-type anomalies in sampled views. Such emphasis effects can occurs if sampling decreases the baseline entropy by a larger factor than the anomaly entropy. This finding is consistent with the results in [15]. To summarize, our results collectively demonstrate that entropybased metrics have two key benefits over volume-based metrics: (1)
they capture the Blaster worm in unsampled traffic, even though the Blaster worm is not clearly visible in packet and byte counts; and more importantly: (2) they are impacted little by sampling when compared to flow counts.
3.3
Metric Sensitivity to Anomaly Intensity
In the previous sections, we studied the effect of packet sampling on the Blaster anomaly as originally contained in our data. In this section, we evaluate how effective entropy is at capturing Blaster-type anomalies of varying intensities. Therefore, we use the given trace and attenuate or amplify the strength of the Blaster anomaly. Specifically, to amplify the Blaster anomaly, for each observed Blaster-packet we insert a second packet with the same source IP and a destination IP randomly selected from the SWITCH IP address range. To simulate and attenuated attack, we keep only 50%, 20%, and 10% of the attack packets in the packet trace.
Figure 4: Normalized anomaly deviation from the baseline for flow counts and flow entropy across increasing sampling rates and different intensities. Figure 4 presents the anomaly size (relative difference from the baseline) as captured in two metrics, flow counts (dark gray) and flow entropy (light gray), across increasing sampling rates and dif-
ferent intensities1 . It provides considerable insight into the efficacy of flow counts and flow entropy in exposing the Blaster anomaly at various intensities and at various sampling rates. As expected, the stronger the anomaly the larger is the relative difference for both metrics. But, flow counts decrease sharply as the Blaster worm is attenuated, even with unsampled traffic. Moreover, this decrease in flow counts is even sharper as the sampling rate increases. In contrast, flow entropy decreases remarkably slow, both with increasing sampling rate and for varying intensities of the Blaster attack. We conclude from this figure that flow entropy is far more robust to packet sampling than simple flow count based summaries, when exposing the Blaster worm at various intensities.
4. CONCLUSION In this paper, we empirically evaluated the impact of packet sampling on anomaly detection metrics. Starting with a week-long dataset of unsampled NetFlow traces containing the Blaster worm, we asked how packet sampling impacts volume metrics such as the number of bytes, packets, and flows that have been commonly used in anomaly detection. To answer this question, we employed a unique and general methodology – which treats anomalies as deviation from an idealized baseline – to evaluate the fidelity of sampled traffic in exposing anomalies. Such an approach allows us to draw general conclusions, rather than limiting our findings to a particular anomaly detection method. Our first finding is somewhat expected: we found that packet sampling produces accurate estimates of byte and packet counts (when compared to the underlying trace). However, packet sampling produces grossly inaccurate estimates of flow counts. Indeed, the Blaster worm which was prominent in the unsampled traffic view of flow counts disappears entirely at higher sampling rates. This is because, as show in previous work, small (single packet) flows are entirely missed. Thus, anomalies that only impact packet counts or byte counts, are likely to be visible in sampled views, but anomalies that impact flow counts (such as the Blaster worm in our data) will not be visible. We then evaluated the effect of packet sampling on feature entropy. Surprisingly, we found that while the Blaster worm is entirely undetectable in flow counts of sampled traces, it is visible in flow entropy. The structure of the Blaster worm remains in the sampled trace and is exposed when viewed in terms of feature entropy. While sampled traffic views are inherently incomplete and imperfect, they are not completely useless. In fact, this paper shows that sampled traffic has utility for anomaly diagnosis, if it is analyzed using the appropriate metrics, such as entropy. The results presented in this paper open up new directions for research on devising detection metrics that are robust to packet sampling.
5. REFERENCES [1] BARFORD , P., K LINE , J., P LONKA , D., AND RON , A. A signal analysis of network traffic anomalies. In Internet Measurement Workshop (Marseille, November 2002). [2] B RUTLAG , J. Aberrant behavior detection in timeseries for network monitoring. In USENIX LISA (New Orleans, December 2000). [3] C HOI , B.-Y., PARK , J., AND Z HANG , Z.-L. Adaptive random sampling for total load estimation. In IEEE International Conference on Communications (2003). 1
For presentation purposes, we normalized each surface by the maximum size for that metric, so that the size of the anomaly for each metric falls between 0 and 1.
[4] Cisco NetFlow. At www.cisco.com/warp/public/ 732/Tech/netflow/. [5] D UFFIELD , N., L UND , C., AND T HORUP, M. Properties and prediction of flow statistics from sampled packet streams. In ACM SIGCOMM Internet Measurment Workshop (2002). [6] D UFFIELD , N., L UND , C., AND T HORUP, M. Estimating Flow Distributions from Sampled Flow Statistics. In ACM SIGCOMM (Karlsruhe, August 2003). [7] E STAN , C., AND VARGHESE , G. New directions in traffic measurement and accounting. In In Proceedings of the 2001 ACM SIGCOMM Internet Measurement Workshop (San Francisco, CA, 2001), pp. 75–80. [8] H OHN , N., AND V EITCH , D. Inverting Sampled Traffic. In Internet Measurement Conference (Miami, October 2003). [9] J UNG , J., K RISHNAMURTHY, B., AND R ABINOVICH , M. Flash crowds and denial of service attacks: Characterization and implications for cdns and web sites. In In Proceedings of the International World Wide Web Conference (2002), pp. 252–262. [10] J UNG , J., PAXSON , V., B ERGER , A., AND BALAKRISHNAN , H. Fast portscan detection using sequential hypothesis testing. In In Proceedings of the IEEE Symposium on Security and Privacy (2004). [11] K IM , M.-S., K ANG , H.-J., H UNG , S.-C., C HUNG , S.-H., AND H ONG , J. W. A Flow-based Method for Abnormal Network Traffic Detection. In IEEE/IFIP Network Operations and Management Symposium (Seoul, April 2004). [12] L AKHINA , A., C ROVELLA , M., AND D IOT, C. Diagnosing Network-Wide Traffic Anomalies. In ACM SIGCOMM (Portland, August 2004). [13] L AKHINA , A., C ROVELLA , M., AND D IOT, C. Mining Anomalies Using Traffic Feature Distributions. In ACM SIGCOMM (Philadelphia, August 2005). [14] M AI , J., C HUAH , C.-N., S RIDHARAN , A., Y E , T., AND Z ANG , H. Is sampled data sufficient for anomaly detection? In IMC 2006 (Rio de Janeiro, Brazil, October 2006). [15] M AI , J., S RIDHARAN , A., C HUAH , C.-N., Z ANG , H., AND Y E , T. Impact of packet sampling on portscan detection. In In IEEE Journal on Selected Areas in Communication (2006). ¨ [16] M ULLER , O., G RAF, D., O PPERMANN , A., AND W EIBEL , H. Swiss internet analysis, 2004. http://www.swiss-internet-analysis.org/. [17] S RIDHARAN , A., Y E , T., AND B HATTACHARRYA , S. Connectionless port scan detection on the backbone. In Malware workshop, held in conjunction with IPCCC (Pheonix, AZ, April 2006). [18] SWITCH. Swiss academic and research network. http://www.switch.ch/, 2006. [19] WAGNER , A., AND P LATTNER , B. Entropy based worm and anomaly detection in fast ip networks. In In Proceedings of the STCA security workshop / WETICE 2005 (2005). [20] WALLERICH , J., D REGER , H., F ELDMANN , A., K RISHNAMURTHY, B., AND W ILLINGER , W. A methodology for studying persistency aspects of internet flows. SIGCOMM Comput. Commun. Rev. 35, 2 (2005). [21] X U , K., Z HANG , Z.-L., AND B HATTACHARRYA , S. Profiling internet backbone traffic: Behavior models and applications. In ACM Sigcomm 2005 (Philadelphia, PA, August 2005).