1
The Effect of Packet Sampling on Anomaly Detection Daniela Brauckhoff, Bernhard Tellenbach, Arno Wagner, Anukool Lakhina, Martin May
Abstract— Packet sampling methods such as Cisco’s NetFlow are widely employed by large networks to reduce the amount of traffic data measured. A key problem with packet sampling is that it is inherently a lossy process, discarding (potentially useful) information. In this paper, we empirically evaluate the impact of sampling on anomaly detection. Starting with unsampled traffic records collected during the Blaster worm outbreak, we reconstruct the underlying packet trace and simulate packet sampling at increasing rates. We then use our knowledge of the Blaster anomaly to build a baseline of normal traffic (without Blaster), against which we can measure the anomaly size at various sampling rates. This approach allows us to evaluate the impact of packet sampling on anomaly detection without being restricted to (or biased by) a particular anomaly detection method. We find that packet sampling does not disturb the anomaly size when measured in volume metrics such as the number of bytes and number of packets, but grossly biases the number of flows. However, we find that recently proposed entropy-based summarizations of packet and flow counts are affected less by sampling, and expose the Blaster worm outbreak even at higher sampling rates. Our findings suggest that entropy summarizations are more resilient to sampling than volume metrics. Thus, while not perfect, sampling still preserves sufficient distributional structure, which when harnessed by tools like entropy, can expose hard-to-detect scanning anomalies.
I. I NTRODUCTION Traffic sampling has emerged as the dominant means to summarize the vast amount of traffic data continuously collected for network monitoring. The most prevalent and widely-deployed method of sampling traffic is packet sampling, where a router inspects every n-th packet (uniformly at random), and records its features (addresses, ports, protocol, and flags). But, while being attractive because of efficiency and availability, sampling is inherently a lossy process, where many packets are discarded without inspection. Thus sampled traffic is an incomplete and more importantly, a biased approximation of the underlying traffic trace, as small flows are likely to be missed entirely. Previous work has largely focused on analyzing this bias, devising better sampling strategies [3], and recovering statistics (moments and distribution) of the underlying traffic trace using inference [5, 6, 8]. There is comparatively little previous work on how sampling impacts network monitoring applications, such as anomaly detection. Indeed sampled traffic views have recently been used for signature-based security analysis and anomaly detection D. Brauckhoff, B. Tellenbach, A. Wagner and M. May are with the Department of Information Technology and Electrical Engineering, Swiss Federal Institute of Technology (ETH), Zurich, Switzerland; email: {brauckhoff, tellenbach, wagner, may}@tik.ee.ethz.ch. A. Lakhina is with the Department of Computer Science at Boston University; email:
[email protected]
with considerable success [10, 12]. But, little is known about the fidelity of the sampled stream for these applications, and basic questions remain unanswered; for example: how complete are the detections revealed by these methods on sampled traffic? and: what kind of anomalies are discarded by packet sampling? Clearly signature-based security detection schemes – which look for specific, often detailed, packet-level connection patterns in traffic – will be very sensitive to missing packets, and will be impacted by packet sampling. However, the impact of packet sampling on anomaly detection is less clear. This is because anomaly detection is concerned not with finding specific packet patterns in sampled traffic, but rather with exposing incidents that deviate significantly from typical traffic behavior. Indeed, anomaly detection methods work by building models for “normal” traffic over a period of time (typically days to week), and then reporting events that are outliers (according to some distance measure) from this baseline normal model. Therefore, for packet sampling to impact anomaly detection it has to either: (1) disturb the baseline model of normal traffic drastically, or (2) dwarf the anomaly significantly so that it does not deviate from the baseline in any detectable manner. In this paper, we empirically study the impact of packet sampling on anomaly detection, focusing on how sampling dwarfs a known anomaly, when compared to a baseline. For our evaluation, we rely on a unique week-long dataset of unsampled traffic records with the Blaster worm anomaly, collected from backbone routers of a national ISP. We then simulate packet sampling to construct sampled views of the same traffic trace and ask how the sampled view differs from the original trace, from an anomaly detection standpoint. Rather than focus on a particular anomaly detection method, we adopt a general methodology. Because we know the exact characteristics of the anomaly in our trace, we can build the ideal normal baseline, that all anomaly detection methods would strive to build. We then study the size of the worm anomaly, which is measured as the distance from this ideal baseline, at increasing sampling rates. As a starting point, we investigate how packet sampling impacts the three principal volume metrics (number of bytes, packets and flows), which have been used widely by many detection methods [1, 2, 11]. We find that packet sampling impacts byte counts and packet counts little, but impacts flow counts radically. This finding suggests that anomalies that impact packet and byte volume only will stand out even in sampled traffic, but anomalies that impact flow counts alone (such as the Blaster worm in our data) are likely to be discarded by packet sampling. Therefore detection schemes based on flow volume alone are likely to be inadequate for sampled traffic. In addition to volume metrics, we also study the impact of
2
packet sampling on feature entropy metrics [12, 14]. The authors of [12] showed that changes in distributions of traffic features (ports and addresses), when summarized by entropy, reveal a broad spectrum of anomalies. We evaluated how effective entropy is at exposing anomalies at increasing sampling rates. Our results here are surprising: we find that while flow volume is grossly impacted by packet sampling, flow entropy is disturbed little. In particular, the Blaster worm in our data when measured in flow counts is dwarfed significantly and virtually undetectable at higher sampling rates, but the worm remains largely unaffected by sampling when measured from a baseline entropy. Thus, the structure of the Blaster worm, as captured by entropy, is preserved even at high sampling rates of 1 in 1000. Our findings provide hope that even though packet sampling produces imperfect traffic views for anomaly detection, there are metrics (such as entropy) that allow us to harness useful information in sampled traces. The rest of this paper is organized as follows. We next provide an overview of our methodology. In Section 3, we introduce our anomaly detection model and study the impact of packet sampling on detecting flow-based anomalies. In Section 4, we conclude and outline directions for future work. II. M ETHODOLOGY In order to systematically evaluate the impact of packet sampling on anomaly detection, one requires packet-level traces (at various sampling rates) that ideally meet two criteria: (1) the traces contain known anomalies, and (2) the traces span a long duration (days to week). Known anomalies make evaluation simpler, as ground truth is known a priori. And, longer traces are needed since many anomaly detection methods require a considerable training period in order to profile the normal traffic behavior. Unfortunately, legal requirements (data protection) and technical limitations (storage space), make it difficult to collect such detailed packet-level data. To circumvent the lack of suitable long-term packet traces, we instead decided to work with unsampled flow records, developed a method to reconstruct packet-level traces from these flow traces. A. Reconstructing Packet Traces Our method to reconstruct the packet traces takes (unsampled) NetFlow records from the Swiss Academic and Research Network (SWITCH) [13] as input and generates the corresponding packet traces. The output format of the packet traces is again flow records with ”flows” that contain only one packet and that have the same start- and end-time. In contrast to real NetFlow records, the packet traces contain ”flows” that are sorted according to their start time. The reconstruction algorithm processes the flows in the order as they are stored in the flow traces. For each of these flows it does the following: First, the size of the packet is calculated by dividing the total number of bytes B by the number of packets N in the corresponding flow. Afterwards, the time stamp of the packet is randomly selected within flow bounds and with a resolution of one millisecond. With this, the expected size of a
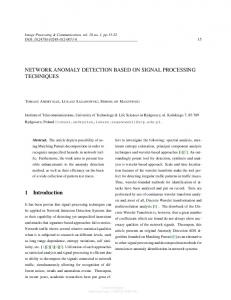
packet in the flow is equal to B/N and the expected number of transferred bytes per millisecond is N/M . Furthermore, by choosing the same packet size for all packets, we preserve (on average) the often assumed (e.g., [7], [9]) constant throughput property of flows even if they are split over two intervals. Recently, the authors of [15] presented empirical evidence demonstrating that the constant throughput property is a good approximation of the behavior of large flows (heavy hitter, elephant flows) while still being a reasonalbe approximation for small ones (mice flows). B. Effects of Sampling on Byte, Packet, and Flow Metrics Having reconstructed the packet traces from our NetFlow data, we can now look at how timeseries of volume and feature entropy metrics are impacted by packet sampling. Therefore, we sampled our one-week data set at four different sampling rates of 1 out of 10, 1 out of 100, 1 out of 250, and 1 out of 1000. The sampling method we applied is random probabilistic packet sampling. Thus, sampling at a rate of q we independently select each packet with a probability of q or discard it with a probability of 1 − q. Subsequently, we computed the timeseries of volume metrics (byte, packet, and flow counts), and feature entropy metrics (packet and flow entropy of IP addresses and port numbers). To illustrate the following discussion on sampling effects, a selection of meaningful timeseries is depicted in Fig. 1. As expected, Fig. 1(a) shows that packet counts are not disturbed by packet sampling. The unsampled values can simply be estimated by multiplying the sampled value with a factor of 1/q. This is due to the fact that the variation of packet sizes by a factor of 100 (between 40 and 1500 Bytes) is very small compared to the overall number of Bytes (≈ 1010 ) within one interval of 15 minutes. On the contrary, flow counts are heavily disturbed by packet sampling even at a sampling rate as low as 1 out of 10 (see Figure 1(b)). This can be explained with the fact that small flows (with only few packets) are sampled with a smaller probability compared to larger flows [6]. More interestingly, flow entropy metrics (Fig. 1(c)) are well preserved even at higher sampling rates. Though we see that packet sampling disturbs entropy metrics (the unsampled value cannot easily be computed from the sampled value as for byte and packet counts), the main traffic pattern is still visible in the sampled trace. This insight was the main motivation for this work. III. I MPACT OF S AMPLING ON A NOMALY D ETECTION In this section, we study the impact of sampling on anomaly detection methods. Rather than apply a particular anomaly detection method on sampled views of traffic, we adopt a more general strategy based on the observation that fundamentally all anomaly detection methods must first define “normal” behavior; anomalies then become deviations from this baseline behavior. So if we can build the “perfect” baseline (an objective that all anomaly detection methods will strive towards), we can gain insight into the fundamental impact of packet sampling on any anomaly detection method, in particular, the detection schemes with the “best” models for baseline behavior.
3
1.0e+10
no sampling, 15min bins, tcp in sampling 1/10, 15min bins, tcp in sampling 1/100, 15min bins, tcp in sampling 1/1000, 15min bins, tcp in
1.0e+09
1.0e+08
no sampling, 15min bins, tcp in sampling 1/10, 15min bins, tcp in sampling 1/100, 15min bins, tcp in sampling 1/1000, 15min bins, tcp in
1.0e+07
no sampling, 15 min bins, tcp in sampling 1/10, 15 min bins, tcp in sampling 1/100, 15 min bins, tcp in sampling 1/1000, 15 min bins, tcp in
25.0
20.0
1.0e+08 1.0e+06
1.0e+07
15.0
1.0e+06
1.0e+05
1.0e+05
10.0
1.0e+04
1.0e+04 1.0e+03 08/08 00:00
08/09 00:00
08/10 00:00
08/11 00:00
08/12 00:00
08/13 00:00
08/14 00:00
1.0e+03 08/08 00:00
08/09 00:00
08/10 00:00
08/11 00:00
08/12 00:00
08/13 00:00
5.0 08/08 00:00
08/14 00:00
(a) Packet counts vs. Time (UTC)
08/09 00:00
08/10 00:00
08/11 00:00
08/12 00:00
08/13 00:00
08/14 00:00
(c) Flow DST IP Entropy vs. Time (UTC)
(b) Flow counts vs. Time (UTC)
Fig. 1. Impact of Sampling on Timeseries of Selected Metrics. 4.5e+07
baseline, no sampling, 15min bins, tcp in blaster outbreak, no sampling, 15min bins, tcp in
4.0e+07
3.0e+06
baseline, no sampling, 15min bins, tcp in blaster outbreak, no sampling, 15min bins, tcp in
26.0
baseline, no sampling, 15min bins, tcp in blaster outbreak, no sampling, 15min bins, tcp in
24.0
2.5e+06
3.5e+07
22.0
2.0e+06
3.0e+07
20.0
2.5e+07
18.0
1.5e+06
2.0e+07 16.0
1.0e+06
1.5e+07
14.0
1.0e+07 5.0e+05
12.0
5.0e+06 0.0e+00 00:00
04:00
08:00
12:00
16:00
20:00
(a) Packet counts vs. Time (UTC)
0.0e+00 00:00
04:00
08:00
12:00
16:00
20:00
(b) Flow counts vs. Time (UTC)
10.0 00:00
04:00
08:00
12:00
16:00
20:00
(c) Flow DST IP Entropy vs. Time (UTC)
Fig. 2. Baselines for Selected Metrics.
A. Determining the Baseline Since our intention is to analyze the effect of sampling on anomaly detection, we need to quantify and measure the factor by which sampling disturbs a certain metric. An accurate method to determine the level of disturbance is to measure the distance (or normalized distance) between “normal” traffic (from hereon called baseline) and “abnormal” traffic (traffic containing network anomalies). The difficulty, however, as for every anomaly detection method is to correctly determine this baseline. For our study, we have the huge advantage that we know the Blaster anomaly in our trace very well. Thus, we are able to construct an “ideal” baseline by removing the traffic that constitutes to the anomaly. In our case, that is removing all traffic that matches a Blaster heuristic: all packets with destination port 135 and packet sizes of 40, 44, or 48 are removed. The baseline and the original unsampled trace are depicted for packet counts (Figure 2(a)), flow counts (Figure 2(b)), and flow destination IP address entropy (Figure 2(c)). While packet counts do only show a minor increase in distance before and after the Blaster outbreak, the other three metrics indicate a more drastic and visible change. B. Measuring Anomaly Size Having constructed the baselines and packet traces for different sampling rates and metrics, we now answer the question: How is anomaly detection impacted by packet sampling? To address this question, we measure the anomaly size at different sampling rates instead of focusing on a particular anomaly detection method. We define anomaly size as the distance beˆ . We tween a sampled view x and the corresponding baseline x determine the anomaly size, by measuring deviation from the baseline at each timebin using two distance measures:
ˆ )/ˆ the relative difference, x pP defined as: (x P− x ˆ )2 )/ (ˆ the l2 difference: ((x − x x2 ) For the relative difference, we computed the distance for each interval individually, and afterwards averaged over a time period starting from the Blaster outbreak on 11/08/2006 at 17:00 until midnight of the same day. For the l2 difference, we computed the sum over the same period for all distances, which was then normed over the sum of all baseline values in this period. Doing this is reasonable since we observe more or less constant Blaster traffic for the whole period (see Fig. 1). In Fig. 3 we plot the sampling rate vs. the relative difference as well as the sampling rate vs. the l2 difference for packet counts, flow counts, flow destination IP entropy, and packet destination IP entropy. The figure shows four curves, one for each metric under investigation, at each sampling rate. For the flow count metrics the relative difference as well as the l2 difference decrease drastically when sampling is applied. Packet counts, in contrast, are not impacted by packet sampling and consequently the relative difference as well as the l2 difference for packet counts remain constant. However, the problem with packet counts is that Blaster-type anomalies which usually represent only a very small fraction of all packets (less than 1% in our backbone trace) are not very visible even in the unsampled data traces. The flow and the packet entropy curves stand in sharp contrast to flow counts. The relative difference as well as the l2 difference decrease only very slightly even for sampling rates as high as 1 out of 1000 for both the entropy metrics, implying that the size of the Blaster worm remains unaffected when viewed using entropy. To summarize, our results collectively demonstrate that entropy-based metrics have two key benefits over volume-based metrics: (1) they capture the Blaster worm in unsampled traffic, • •
4
even though the Blaster worm is not clearly visible in packet IV. C ONCLUSION and byte counts; and more importantly: (2) they are impacted In this paper, we empirically evaluated the impact of packet little by sampling when compared to flow counts. sampling on anomaly detection. With a week-long dataset of 2.2
2.2
packet counts flow counts flow dst ip entropy packet dst ip entropy
2.0 1.8
packet counts flow counts flow dst ip entropy packet dst ip entropy
2.0 1.8
1.6
1.6
1.4
1.4
1.2
1.2
1.0
1.0
0.8
0.8
0.6
0.6 0.4
0.4
0.2
0.2
0.0
0.0 1
10
100
(a) Relative Difference
1000
1
10
100
1000
(b) Relative l2 Difference
Fig. 3. Anomaly Size (measured as deviation from the baseline) vs. Sampling Rates for four metrics.
C. Metric Sensitivity to Anomaly Intensity To evaluate the sensitivity of entropy towards sampling, we use the given trace and attenuate or amplify the strength of the Blaster anomaly signal. To amplify the Blaster anomaly, we duplicate the attack packets by a factor of 2; for an attenuated attack, we keep only 50%, 20%, and 10% of the attack packets in the packet trace.
Fig. 4. Normalized anomaly deviation from the baseline for flow counts and flow entropy across increasing sampling rates and different intensities.
Figure 4 presents the anomaly size (l2 difference from the baseline) as captured in two metrics, the flow count (dark gray) and the flow entropy (light gray), across increasing sampling rates and different intensities1 . It provides considerable insight into the efficacy of flow counts and flow entropy in exposing the Blaster anomaly at various intensities and at various sampling rates. As expected, the stronger the anomaly the more easily the anomaly will be detected for both metrics. But, flow counts decrease sharply as the Blaster worm is attenuated, even with unsampled traffic. Moreover, this decrease in flow counts is even sharper as the sampling rate increases. In contrast, flow entropy decreases remarkably slow, both with increasing sampling rate and for varying intensities of the Blaster attack. We conclude from this figure that flow entropy is far more robust to packet sampling than simple flow count based summaries, when exposing the Blaster worm at various intensities. 1 For presentation purposes, we normalized each surface by the maximum size for that metric, so that the size of the anomaly for each metric falls between 0 and 1.
unsampled traffic records containing the Blaster worm, we employed a general detection methodology (the deviation from an idealized baseline) to evaluate the fidelity of sampled traffic in exposing anomalies. Our first finding is somewhat expected: we found that packet sampling produces accurate estimates of byte and packet counts (when compared to the underlying trace). However, packet sampling produces grossly inaccurate estimates of flow counts. Thus, anomalies that only impact packet counts or byte counts, are likely to be visible in sampled views, but anomalies that impact flow counts (such as the Blaster worm in our data) will not be visible. We then evaluated the effect of packet sampling on feature entropy. Surprisingly, we found that while the Blaster worm is entirely undetectable in flow counts of sampled traces, it is visible in flow entropy. While sampled traffic views are necessarily incomplete and imperfect, they are not completely useless; in fact, this paper shows that sampled traffic has utility for anomaly diagnosis, if it is analyzed using the appropriate metrics, such as entropy. The results presented in this paper open up new directions for research on devising detection metrics that are robust to packet sampling. R EFERENCES [1] BARFORD , P., K LINE , J., P LONKA , D., AND RON , A. A signal analysis of network traffic anomalies. In Internet Measurement Workshop (Marseille, November 2002). [2] B RUTLAG , J. Aberrant behavior detection in timeseries for network monitoring. In USENIX LISA (New Orleans, December 2000). [3] C HOI , B.-Y., PARK , J., AND Z HANG , Z.-L. Adaptive random sampling for total load estimation. In IEEE International Conference on Communications (2003). [4] Cisco NetFlow. At www.cisco.com/warp/public/732/Tech/ netflow/. [5] D UFFIELD , N., L UND , C., AND T HORUP, M. Properties and prediction of flow statistics from sampled packet streams. In ACM SIGCOMM Internet Measurment Workshop (2002). [6] D UFFIELD , N., L UND , C., AND T HORUP, M. Estimating Flow Distributions from Sampled Flow Statistics. In ACM SIGCOMM (Karlsruhe, August 2003). [7] E STAN , C., AND VARGHESE , G. New directions in traffic measurement and accounting. In In Proceedings of the 2001 ACM SIGCOMM Internet Measurement Workshop (San Francisco, CA, 2001), pp. 75–80. [8] H OHN , N., AND V EITCH , D. Inverting Sampled Traffic. In Internet Measurement Conference (Miami, October 2003). [9] J UNG , J., K RISHNAMURTHY, B., AND R ABINOVICH , M. Flash crowds and denial of service attacks: Characterization and implications for cdns and web sites. In In Proceedings of the International World Wide Web Conference (2002), pp. 252–262. [10] K IM , M.-S., K ANG , H.-J., H UNG , S.-C., C HUNG , S.-H., AND H ONG , J. W. A Flow-based Method for Abnormal Network Traffic Detection. In IEEE/IFIP Network Operations and Management Symposium (Seoul, April 2004). [11] L AKHINA , A., C ROVELLA , M., AND D IOT, C. Diagnosing NetworkWide Traffic Anomalies. In ACM SIGCOMM (Portland, August 2004). [12] L AKHINA , A., C ROVELLA , M., AND D IOT, C. Mining Anomalies Using Traffic Feature Distributions. In ACM SIGCOMM (Philadelphia, August 2005). [13] SWITCH. Swiss academic and research network. http://www. switch.ch/, 2006. [14] WAGNER , A., AND P LATTNER , B. Entropy based worm and anomaly detection in fast ip networks. In In Proceedings of the STCA security workshop / WETICE 2005 (2005). [15] WALLERICH , J., D REGER , H., F ELDMANN , A., K RISHNAMURTHY, B., AND W ILLINGER , W. A methodology for studying persistency aspects of internet flows. SIGCOMM Comput. Commun. Rev. 35, 2 (2005), 23–36.