IMPLEMENTATION OF A MATLAB WEB SERVER FOR INTERNET-BASED PROCESSING OF BIOMEDICAL IMAGES V. Musoko, A. Proch´ azka, A. Pavelka Institute of Chemical Technology, Department of Computing and Control Engineering Abstract The paper reviews the various methods implemented for the de-noising and visualization of biomedical images on the Web using the Matlab Web Server (MWS). MWS integrates the graphical and computational capabilities of MATLAB with a remote access through the Internet. MATLAB toolboxes provide a range of algorithms that enable image processing by different mathematical methods including the discrete wavelet transform. The paper presents basic methods for the de-noising and enhancement of biomedical images with suitable wavelet thresholding methods. The final part of the paper is devoted to the design of a graphical user’s interface enabling the choice of input parameters and presentation of the results.
1
Introduction
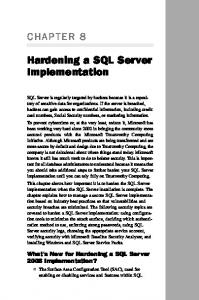
A key application of modern educational technology is e-learning with a web-based approach using for example a MATLAB Web Server (MWS) application. MWS [2] allows clients (users) to run MATLAB applications remotely over the internet. Clients interact with MATLAB over a network with a TCP/IP protocol. This interaction takes place through HTML forms which serve as graphical interfaces for the application. This not only allows users to use MATLAB based tools without any prior MATLAB programming knowledge but it also prevents unauthorized user access to source code. Fig. 1 shows the interaction between clients and MWS. Client 1 Initial HTML form
Output HTML form
.....
Client n
Initial HTML form
Output HTML form
http daemon
matweb
matlabserver Graphics
MATLAB
M-files Data
Figure 1: How MATLAB operates on the Web In the paper the implementation of the MWS with the goal of its use for biomedical image processing - remote image processing is discussed. The mathematical tools to be used include discrete wavelet transform.
2
Principle of DWT
Discrete Wavelet transform (DWT) [4] decomposes a signal into a two-dimensional function of time and scale. Wavelet functions used for signal analysis are derived from the initial function forming basis for the set of basis functions. Two types of basis functions normally used are: • Scaling function Φmk (t)
m
Φm,k (t) = 2− 2 Φ0 (2−m t − k)
• Wavelet Ψmk (t)
(1)
m
Ψm,k (t) = 2− 2 Ψ0 (2−m t − k)
(2)
where m is the scaling index and k is the time translation. Every basis function Ψ is orthogonal to every basis function Φ. The wavelet transform [3] is implemented using a pair of filters: a low-pass filter L and a highpass filter H, which split a signal’s bandwidth in two halves. The forward wavelet transform of a discrete-time signal x(n) (0 ≤ n < N − 1) is performed by convolving the signal with both a half-band low-pass filter L and high-pass filter H and down-sampling by a factor of two. Three dimensional wavelets can be derived from their one dimensional versions by their successive application in three spatial directions (x, y, and z). Fig. 2 shows a separable 3D decomposition of a volume. The volume F (x, y, z) [3] is firstly filtered along the x dimension, resulting in a low-pass image L(x, y, z) and a high-pass image H(x, y, z). Both L and H are then filtered along the y dimension, resulting in four decomposed sub-volumes: LL, LH, HL and HH. Then each of these four sub-volumes are then filtered along the z dimension, resulting in eight sub-volumes: LLL, LLH, LHL, LHH, HLL, HLH, HHL and HHH (Fig 2). LH
L
H
Dec omp os i t i on a lon g t h e c olumn s
3D volume
HH
LL
LHL
HL
Dec omp os i t i on a lon g t h e r ow s
HHL
LLL HLL LLH HLH
LHH
Dec omp os i t i on a lon g t h e s li c es
Figure 2: Three-dimensional WT decomposition After decomposition it is possible to modify resulting coefficients before the reconstruction to eliminate undesirable signal components. To implement wavelet thresholding a wavelet shrinkage algorithm is applied which consists of the following steps: • Application of the forward wavelet transform • Estimation of a threshold • Choice of shrinkage rule and application of the threshold according to the rule • Evaluation of the inverse transform using the thresholded coefficients
3
Implementation of the Matlab Web Server
The MATLAB application resides on the server machine and the components of the MWS [2] include: • matlabserver TCP/IP server running MATLAB continuously. • matweb.exe common gateway interface (CGI) program that resides on the HTTP server and communicates with matlabserver. matweb requires information found in matweb.conf to locate matlabserver. An instance of matweb.conf looks like [mri2D] mlserver=atlas mldir=H:/PHOBOS/MUSOKOV/m where mlserver is the name of host running matlabserver and mldir is the working directory for reading m-files or save any generate any graphics writing files. • Input HTML form data functions MATLAB utility functions that retrieve data from input HTML documents and then provide that data in a form convenient to MATLAB programmers. • Output HTML document functions MATLAB functions for inserting MATLAB data into template HTML forms for return transmission to the end users Web browser. There are three files associated with an mri2D function [1]: • mri2D input.html: the mri2D input document • mri2D output.html: the mri2D output document • mri2D.m: the mri2D MATLAB m-file Looking at the source from the mri2D plot.html file there is a line that sets the argument mlmfile to the value mri2D. The mlmfile argument contains the name of the MATLAB m-file to run. matlabserver uses the value of mlmfile obtained from the matweb, to run the MATLAB application. The mri2D takes the input data from mri2D input.html, carries out the de-noising application and outputs the results using mri2D outpt.html as a template. The mri2D function uses the htmlrep command to place the computed graphics into the mri2D output.html output template using the code templatefile = which(’mri2D_output.html’); rs = htmlrep(s, templatefile); where s is a MATLAB structure containing the results of the mri2D computation. htmlrep extracts data from s and replaces variable fields in mri2D output.html with the results of the MATLAB computation. The completed mri2D output.html form is transmitted to the user’s browser. In examining some parts of the mri2D and mri3D code, you will see how to include MATLAB graphics as part of a MATLAB Web Server application. The input document allows you to set the characteristics of the MRI plot you want to generate. The code in the source file calls the mri2D function and targets the output to a frame on the lower portion of the input document itself. In mri2D.m the code mlid = getfield(h,’mlid’)
extracts mlid from the structure h. The mlid is a unique identifier that matlabserver provides. Using the value of mlid to construct filenames ensures that filenames are unique. The code s.graf1 = sprintf(’../icons/%smri2D.jpeg’, mlid); creates a name for a graphic (jpeg) file and save the files in the directory /icons. The function htmlrep replaces MATLAB variable names that it finds in the HTML output template file mri2D output.html with the values in the input structure s in our case graph1. templatefile = which(’mri2D_output.html’); rs = htmlrep(s, templatefile); From the mri2D output.html, $graph1$, the variable that represents the graphic output, is found in the line
An example of how of one level image processing of a noisy MR image slice is shown in Fig. 3 on an internet browser. In our demonstration the client has to select the type of data to be loaded, the number of levels and threshold value for de-noising of a noisy MRI slice.
Figure 3: 2D biomedical image processing The user’s graphic interface for processing of 3D biomedical image is presented in Fig. 4, it is a template of an HTML form (the top frame). During the execution the user select the data file to be processed and choose the appropriate method of wavelet tresholding from the touch down button. After entering the suitable choice the user can press the Generate plot for the execution of the application. The visualization and the graphical results are returned to the browser as an image in jpeg format as shown in Fig. 4. The demonstration of a 3D image processing was done using off-line results since computation of such large volumetric image data in real time takes is very long.
Figure 4: 3D biomedical image processing
4
Conclusion
With a large demand for a powerful graphical user interface (GUI) tools and a possibility of e-learning there is a need to improve the GUI and MWS as new educational tools. An increase in MWS graphical user interface capabilities can enhance a powerful tool for distance e-learning. Using e-learning material is interactive and the great advantage is that it allows clients to access MATLAB independent from place and time.
Acknowledgment The work has been supported by the research grant of the Faculty of Chemical Engineering of the Institute of Chemical Technology, Prague No. MSM 223400007.
References [1] http://phobos.vscht.cz/musoko. [2] MATLAB Web Server. The MathWorks, Inc., 1999. [3] H. Khalil and S. Shaheen. Three dimensional video compression. IEEE Transactions on Image Processing, 8, 1999. [4] D. E. Newland. An Introduction to Random Vibrations, Spectral and Wavelet Analysis. Longman Scientific & Technical, Essex, U.K., third edition, 1994.
Prof. Aleˇs Proch´azka, CSc, Ing. Victor Musoko, Ing. Aleˇs Pavelka Institute of Chemical Technology, Prague Department of Computing and Control Engineering Technick´a 1905, 166 28 Prague 6 Phone.: 00420-22435 4198, Fax: 00420-22435 5053 E-mail:
[email protected],
[email protected],
[email protected]