Accepted Manuscript Implementation options for DNA-based identification into ecological status assessment under the European Water Framework Directive Daniel Hering, Angel Borja, J.Iwan Jones, Didier Pont, Pieter Boets, Agnes Bouchez, Kat Bruce, Stina Drakare, Bernd Hänfling, Maria Kahlert, Florian Leese, Kristian Meissner, Patricia Mergen, Yorick Reyjol, Pedro Segurado, Alfried Vogler, Martyn Kelly PII:
S0043-1354(18)30183-0
DOI:
10.1016/j.watres.2018.03.003
Reference:
WR 13622
To appear in:
Water Research
Received Date: 27 October 2017 Revised Date:
2 March 2018
Accepted Date: 3 March 2018
Please cite this article as: Hering, D., Borja, A., Jones, J.I., Pont, D., Boets, P., Bouchez, A., Bruce, K., Drakare, S., Hänfling, B., Kahlert, M., Leese, F., Meissner, K., Mergen, P., Reyjol, Y., Segurado, P., Vogler, A., Kelly, M., Implementation options for DNA-based identification into ecological status assessment under the European Water Framework Directive, Water Research (2018), doi: 10.1016/ j.watres.2018.03.003. This is a PDF file of an unedited manuscript that has been accepted for publication. As a service to our customers we are providing this early version of the manuscript. The manuscript will undergo copyediting, typesetting, and review of the resulting proof before it is published in its final form. Please note that during the production process errors may be discovered which could affect the content, and all legal disclaimers that apply to the journal pertain.
ACCEPTED MANUSCRIPT
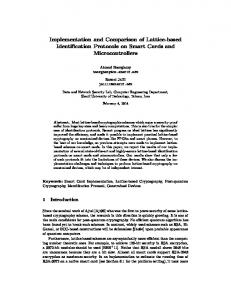
Aquatic ecosystem
Sampling
Morph. determination tax
RI PT
on keyomic
M AN U
SC
Water sample
DNA isolation & PCR
AC C
EP
Filtration
Ecological status assessment
TE D
DNA isolation & PCR
DNA metabarcoding High Throughput Sequencer
Taxonomic assignment
Barcode reference library
ACCEPTED MANUSCRIPT 1
Implementation options for DNA-based identification into ecological status assessment under the
2
European Water Framework Directive
3 Daniel Hering1*, Angel Borja2, J Iwan Jones3, Didier Pont4, Pieter Boets5, Agnes Bouchez6, Kat Bruce7,
5
Stina Drakare8, Bernd Hänfling9, Maria Kahlert10, Florian Leese11, Kristian Meissner12, Patricia
6
Mergen13,14, Yorick Reyjol15, Pedro Segurado16, Alfried Vogler17, Martyn Kelly18
7
RI PT
4
1
University of Duisburg-Essen, Aquatic Ecology, 45117 Essen, Germany
9
2
AZTI, Marine Research Division, 20110 Pasaia, Spain
10
3
School of Biological and Chemical Sciences, Queen Mary University of London, London, E1 4NS, UK
11
4
Association VigiLIFE, 17, rue du Lac Saint-André, Savoie Technolac - BP 274, 73375 Le Bourget-du-
12
Lac Cedex, France and Institute of Hydrobiology and Aquatic Ecosystem Management, University of
13
Natural Resources and Life Sciences, Gregor-Mendel-Strasse 33, 1180 Vienna, Austria
14
5
PCM, Provincial Centre of Environmental Research, Godshuizenlaan 95, 9000 Ghent, Belgium
15
6
INRA-UMR CARRTEL, 74200 Thonon les Bains, France
16
7
NatureMetrics Ltd, Egham, TW20 9TY, UK
17
8
Swedish University of Agricultural Sciences, Department of Aquatic Sciences and Assessment, PO
18
Box 7050, SE-750 07 Uppsala, Sweden
19
9
20
10
21
Box 7050, SE- 750 07 Uppsala, Sweden
22
11
University of Duisburg-Essen, Aquatic Ecosystem Research, 45117 Essen, Germany
23
12
Finnish Environment Institute, Freshwater Centre, FI-40500 Jyväskylä, Finland
24
13
Botanic Garden Meise, Nieuwelaan, 38, 1860 Meise, Belgium
25
14
Royal Museum for Central Africa; Leuvensesteenweg, 13, 3080 Tervuren, Belgium
EP
TE D
M AN U
SC
8
AC C
University of Hull, Evolutionary Biology Group, School of Environmental Sciences, Hull, HU6 7RX, UK Swedish University of Agricultural Sciences, Department of Aquatic Sciences and Assessment, PO
1
ACCEPTED MANUSCRIPT 26
15
Agence Française pour la Biodiversité (AFB), 5 square Felix Nadar, 94300 Vincennes, France
27
16
Forest Research Center, School of Agriculture, University of Lisbon, Tapada da Ajuda, 1349-017
28
Lisbon, Portugal
29
17
30
Road, London, SW7 5BD, UK
31
18
Bowburn Consultancy, 11 Monteigne Drive, Bowburn, Durham DH6 5QB, UK.
32 *corresponding author. Email:
[email protected]
SC
33
RI PT
Department of Life Sciences, Imperial College London, and Natural History Museum, Cromwell
AC C
EP
TE D
M AN U
34
2
ACCEPTED MANUSCRIPT Graphical Abstract
M AN U
SC
RI PT
35
EP
38
Source: http://dnaqua.net.
AC C
37
TE D
36
3
ACCEPTED MANUSCRIPT Abstract
40
Assessment of ecological status for the European Water Framework Directive (WFD) is based on
41
“Biological Quality Elements” (BQEs), namely phytoplankton, benthic flora, benthic invertebrates and
42
fish. Morphological identification of these organisms is a time-consuming and expensive procedure.
43
Here, we assess the options for complementing and, perhaps, replacing morphological identification
44
with procedures using eDNA, metabarcoding or similar approaches. We rate the applicability of DNA-
45
based identification for the individual BQEs and water categories (rivers, lakes, transitional and
46
coastal waters) against eleven criteria, summarised under the headlines representativeness (for
47
example suitability of current sampling methods for DNA-based identification, errors from DNA-
48
based species detection), sensitivity (for example capability to detect sensitive taxa, unassigned
49
reads), precision of DNA-based identification (knowledge about uncertainty), comparability with
50
conventional approaches (for example sensitivity of metrics to differences in DNA-based
51
identification), cost effectiveness and environmental impact. Overall, suitability of DNA-based
52
identification is particularly high for fish, as eDNA is a well-suited sampling approach which can
53
replace expensive and potentially harmful methods such as gill-netting, trawling or electrofishing.
54
Furthermore, there are attempts to replace absolute by relative abundance in metric calculations.
55
For invertebrates and phytobenthos, the main challenges include the modification of indices and
56
completing barcode libraries. For phytoplankton, the barcode libraries are even more problematic,
57
due to the high taxonomic diversity in plankton samples. If current assessment concepts are kept,
58
DNA-based identification is least appropriate for macrophytes (rivers, lakes) and angiosperms /
59
macroalgae (transitional and coastal waters), which are surveyed rather than sampled. We discuss
60
general implications of implementing DNA-based identification into standard ecological assessment,
61
in particular considering any adaptations to the WFD that may be required to facilitate the transition
62
to molecular data.
AC C
EP
TE D
M AN U
SC
RI PT
39
4
ACCEPTED MANUSCRIPT 63
Keywords: meta-barcoding, eDNA, Biological Quality Elements, rivers, lakes, transitional and coastal
64
waters
65 Introduction
67
Worldwide, aquatic ecosystems are monitored using a range of organisms as indicators (Foden et al.,
68
2008; Hallett et al., 2016; Patricio et al., 2016). In the European Union, most freshwater monitoring is
69
performed to fulfil the requirements of the EU Water Framework Directive (WFD, 2000/60/EC),
70
which aims to improve the status of European freshwater resources and ecosystems. It requires
71
Member States to assess the ecological status of all surface water bodies at regular intervals (de
72
Jonge et al., 2006). Chemical status of surface and groundwater bodies is also assessed, but not
73
discussed in this paper. The number of monitored river, lakes, transitional and coastal waters in
74
Europe exceeds 100,000, and for most of them several organism groups (“Biological Quality
75
Elements”, BQEs) are investigated. These include phytoplankton, phytobenthos and larger aquatic
76
plants, as well as benthic invertebrates and fish (EEA, 2012). The Marine Strategy Framework
77
Directive (MSFD, 2008/56/EC) also requires the use of several indicators including species diversity,
78
seafloor integrity, food web structure, and non-indigenous and commercial species, but its
79
implementation is currently not as advanced as for the WFD (Danovaro et al., 2016).
80
All monitoring and assessment methods applied under the WFD conform to the same conceptual
81
framework, although the details differ among countries and regions (Birk et al., 2012). In short,
82
organisms are sampled or surveyed following national or EU-wide standard methods to produce lists
83
of taxa present and (in most cases) estimates of abundance, processed in the laboratory (if
84
necessary), and identified using morpho-taxonomic approaches. The resulting data are used to
85
compute assessment metrics, which are compared against values for each metric expected at
86
“reference conditions” (i.e. in a more-or-less unimpacted state derived from historical conditions or
87
best available sites) specific to each type of water body. The distance between the calculated value
AC C
EP
TE D
M AN U
SC
RI PT
66
5
ACCEPTED MANUSCRIPT and the value at reference conditions is termed the Ecological Quality Ratio (EQR), which is finally
89
translated into a quality class (high, good, moderate, poor and bad) on which management decisions
90
are based. The objective is to achieve at least “good status” for all water bodies in Europe by 2027: at
91
present, half of all water bodies do not meet this goal (EEA, 2012).
92
Most assessment methods for European freshwaters were developed in the 2000s, following
93
adoption of the WFD by EU Member States. In many cases, these methods were based on
94
approaches developed prior to adoption of the WFD with adjustments to translate assessment
95
results into ecological status classes. Whilst field and laboratory methods were largely left
96
unchanged, some Member States developed new assessment methods. Whatever the strategy
97
adopted, each biological method was then “intercalibrated” with the respective methods of other
98
Member States in the same broad ecoregion (termed “Geographical Intercalibration Groups”, Birk et
99
al., 2013). Although the formal definition of ecological status encompasses both structure and
100
function (Article 2, definition 21, WFD), the assessment systems have been based primarily on
101
structure. Some assessment metrics do use species traits, such as size structure of fish assemblages
102
or feeding type composition of benthic invertebrates (Mondy et al., 2012; Pont et al., 2006) but most
103
methods neglect this aspect. Overall, despite the shortcomings of many of the methods, the process
104
of method development, adaptation and intercalibration have contributed to a better understanding
105
of reference conditions, responses of biota to stressors and the uncertainties associated with various
106
steps in the assessment of ecological status (Poikane et al., 2014).
107
Some aspects of monitoring procedures are time consuming and costly, requiring teams of skilled
108
individuals, for example the identification and counting of phytoplankton, phytobenthos and benthic
109
invertebrates (Ferraro et al., 1989; Haase et al., 2004; Nygård et al., 2016). Electrofishing and
110
gillnetting for fish are also costly and require teams of skilled staff. As budgets for such work are
111
under pressure, there is a demand to simplify methods, to lower the costs and to speed up the
112
monitoring process (Borja and Elliott, 2013), whilst maintaining quality, robustness and
AC C
EP
TE D
M AN U
SC
RI PT
88
6
ACCEPTED MANUSCRIPT comparability. Recent technological advances could go some way towards alleviating these budget
114
constraints.
115
New methods such as machine learning (Kiranyaz et al., 2011; Ärje et al., 2017), and genetic methods
116
such as metabarcoding of DNA obtained from organisms or simply by sampling environmental DNA
117
(eDNA) from the water (for example Taberlet et al., 2012a; Ji et al., 2013) provide alternative tools
118
for multiple species detection and identification. In the medium term, these new methods have the
119
potential to fundamentally change ecological assessment. Although still in the development phase,
120
genetic methods are already sufficiently well advanced for biodiversity assessment (for example
121
Elbrecht et al., 2017). Thus, it is now possible to complement or even replace traditional sample
122
processing and identification methods with DNA-based methods which are of equal or lower cost and
123
which are able to detect species occurrences with a similar or higher level of precision (Stein et al.,
124
2014; Smart et al., 2016; Aylagas, 2017; Elbrecht et al., 2017; Vasselon et al., 2017). DNA-based
125
methods have some obvious advantages compared with traditional sampling and image recognition
126
based identification schemes. Identification to species level is more precise and objective with DNA-
127
based methods, particularly for cryptic taxa, microorganisms and difficult life stages (for example
128
juveniles and pupae) while sample processing may be faster and cheaper than manual procedures
129
(Hajibabaei et al., 2011; Kermarrec et al. 2014; Dafforn et al., 2014; Stein et al., 2014; Avó et al.,
130
2017). An additional advantage of molecular techniques is the potential for assessing functional
131
diversity based on gene expression (transcription), fulfilling an aim of the WFD that has yet to be
132
addressed adequately with morpho-taxonomic approaches (Bourlat et al., 2013). On the other hand,
133
molecular techniques are still developing and require standardisation and harmonization (Cristescu,
134
2014) before they can be used in national monitoring programmes. Furthermore, there is limited
135
capability for the determination of species abundance, which is a prerequisite for many BQEs
136
assessed for the WFD. Reference barcodes are not yet available for a considerable - although
137
decreasing - proportion of species.
AC C
EP
TE D
M AN U
SC
RI PT
113
7
ACCEPTED MANUSCRIPT For a more general application of DNA-based techniques in WFD assessments, key questions
139
regarding comparability with traditional methods need to be addressed, in particular the sensitivity
140
of species detection and the precision of species identification (Leese et al., 2016). In principle, there
141
are two options for including DNA-based methods into ecological status assessment:
142
Option 1: Under this option, specific steps of the conventional assessment procedure, particularly
143
those leading to the identification of organisms, could be replaced by DNA-based methods. Other
144
elements, such as metrics, assessment system, interpretation and, in many cases, sampling, remain
145
the same or are subject to minor adaptation, for example different preservatives, reassessment of
146
taxa lists from reference water bodies, and replacement of electrofishing by water samples. This
147
option could provide the same level of information as traditional methods, but may improve
148
processing speed, comparability and cost efficiency. In the following, we refer to this method as
149
“DNA-based identification”.
150
Option 2: This option combines different ways of using new assessment metrics, which take full
151
advantage of the higher taxonomic resolution of DNA-based methods, producing typically more
152
highly resolved taxa lists and possibly information on ecosystem functioning (Grossmann et al.,
153
2016). This could, for example, enable the inclusion of species of currently widely ignored organism
154
groups (such as Chironomidae) into biodiversity metrics, or development of metrics based on the
155
expression of genes involved in osmoregulation to assess the impact of freshwater salinization. In
156
cases where only scarce taxon information exist (for example protists), Operational Taxonomic Units
157
(OTUs) can be assigned and used for index development. This option can only be implemented in the
158
medium- to long-term and may require the complete redesign of assessment systems, including
159
derivation of new reference condition values and the development of new assessment metrics.
160
Functional metrics are currently underrepresented in WFD assessment systems, although trait-based
161
data have been frequently derived from morphological criteria (Schmidt-Kloiber and Hering, 2015)
162
and are used in several assessment methods. Molecular data, in particular transcriptomic data
AC C
EP
TE D
M AN U
SC
RI PT
138
8
ACCEPTED MANUSCRIPT (Konopka and Wilkins, 2012; Creer et al. 2016) and placement into trait-informed phylogenies offer
164
additional options for functional metrics, which would need to be developed from scratch, and their
165
response to stressor gradients investigated. However, research in this field is still its infancy and
166
implementation into practical ecological assessment is unlikely in the short and medium term.
167
Hybrid option: There is also the possibility of a hybrid between Options 1 and 2 where DNA-based
168
methods are used to replace morphological identification whilst keeping metrics and reference
169
conditions for assessment purposes (cf option 1). At the same time, additional information generated
170
by DNA-based methods such as more highly resolved taxa lists or functional information derived
171
from other approaches such as metagenomics and -transcriptomics would be used to better inform
172
interpretation of assessment results, for example rating how stressors affect ecosystem functionality.
173
Until 2027, only Option 1 provides a realistic option for operational monitoring under the WFD.
174
European countries have spent considerable resource developing WFD assessment systems and have
175
used them in previous monitoring cycles : they will continue to apply them until the end of the fourth
176
River Basin Management Cycle in 2027. Therefore, this paper focuses on DNA-based identification
177
(Option 1), acknowledging that it is a straightforward, but rather conservative approach in
178
comparison with Option 2, as it aims for maximum comparability with traditional methods.
179
In some circumstances, the inclusion of DNA-based techniques into WFD assessment has already
180
been tested, for example for river phytobenthos in Mayotte Island, France (Vasselon et al., 2017) and
181
the UK (Kelly et al., 2017), and is likely to be used increasingly for a range of BQEs in other countries
182
(Leese et al., submitted). However, for a variety of reasons the applicability of Option 1 differs
183
between BQEs and water body types (river, lakes, transitional and coastal waters). Amongst others,
184
there is the need to secure comparability with traditional identification, which may be more
185
problematic for those BQEs where there are large discrepancies between morphological and DNA-
186
based species identification. In addition, the potential benefits in sample processing speed differ
187
strongly between BQEs.
AC C
EP
TE D
M AN U
SC
RI PT
163
9
ACCEPTED MANUSCRIPT Here, we evaluate the potential of DNA-based identification (Option 1) for routine WFD assessment
189
for different BQEs and water categories. Our aim is to rate the applicability of DNA-based
190
identification methods, assuming that current WFD assessment metrics are kept or only slightly
191
adapted. We use a variety of criteria related to the anticipated suitability (for example the expected
192
increase in processing speed, lower costs) and the maturity of development (for example the extent
193
to which assessment methods will need to be adapted). The paper is addressed at scientists and
194
officials involved into the commissioning and development of DNA-based methods, stakeholders and
195
consultants involved in WFD monitoring.
SC
RI PT
188
196
M AN U
197 Assessment and monitoring methods under the WFD
199
Considerable research effort has been devoted to the development of methods for ecological
200
assessment of waterbodies following implementation of the WFD (Birk et al., 2012). The primary
201
focus has been to establish sensitive and precise methods capable of assessing the impact of a wide
202
range of pressures on biota and, hence, guide management efforts to restore good ecological status.
203
The reference condition approach is a central principle of the WFD: the biota observed are compared
204
with those expected in the absence of environmental stress, resulting in an Ecological Quality Ratio
205
(EQR), calculated as the observed score /expected score (Jones et al. 2010).
206
Although always based on the same principles, subsidiarity has led to diversity in the methods
207
developed by Member States for each BQE-water category combination. This reflects the variety of
208
methods and data existing prior to the WFD, and regional differences in stressors and taxonomic
209
knowledge. Overall, more than 300 methods are in use across Europe (Birk et al., 2012), with
210
comparability ensured by an obligatory intercalibration process (Birk et al., 2013; Poikane et al.,
211
2014). At a first glance, the large number of methods is bewildering; however, all methods are based
212
on the same chain of steps and many differ only in detail (Birk et al., 2013):
AC C
EP
TE D
198
10
ACCEPTED MANUSCRIPT 213
•
214 215
Surveys are always stratified by water bodies, for example individual lakes or homogeneous river sections which may be several kilometres in length.
•
Sampling is conducted using standardised approaches allowing for (semi)quantitative analysis. Identification is to species for those BQEs with a low number of species (fish,
217
macrophytes, macroalgae, angiosperms), and varies between species and family level (for
218
the remaining BQEs (phytoplankton, phytobenthos and invertebrates), depending on
219
feasibility, regional taxonomic knowledge, and bioindication potential. •
Metrics are calculated from the resulting taxon lists, reflecting either general degradation or
SC
220
RI PT
216
individual stressors. The results are compared with metric values obtained at reference
222
conditions, which are specific to each type of water body.
M AN U
221
The deviation from reference conditions is expressed as the EQR (from 0 to 1) from which the
224
biological status class (“high”, “good”, “moderate”, “poor” or “bad”) is derived, harmonised between
225
EU member states through intercalibration. The status classes of the individual BQEs are finally
226
combined with other quality elements into an ecological status class, using the “one-out-all-out”
227
principle (the worst status class determines the overall ecological status class).
228
Three types of monitoring are specified by the WFD, each with a different objective, namely: (1)
229
surveillance monitoring to classify water bodies and assess large-scale, long-term change; (2)
230
operational monitoring, focussed on water bodies unlikely to reach good status, in order to establish
231
local management options, and (3) investigative monitoring to identify the causes of a water body
232
not achieving environmental objectives, and to assess the magnitude and source of accidental
233
pollution.
EP
AC C
234
TE D
223
235
DNA-based methods for species identification
236
DNA-based methods for species identification cover a wide range of techniques and considerations.
237
Before any molecular analysis can be applied, DNA must first be obtained either by collecting 11
ACCEPTED MANUSCRIPT organisms directly or by sampling the environment (for example water) and extracting the genetic
239
material present (environmental DNA or eDNA) without sorting organisms (Baird and Hajibabaei,
240
2012; Bohman et al., 2014; Taberlet et al., 2012a). These two broad sources of DNA differ in some
241
fundamental aspects. First, whereas large amounts of DNA can be extracted from community bulk
242
samples (for example macroinvertebrates) and microorganisms such as diatoms in biofilms or water,
243
aqueous eDNA from macroorganisms (for example fish, amphibians) is generally present at very low
244
concentrations (Pilliod et al., 2013) and can be heterogeneously distributed throughout the
245
environment, which has consequences for species detection.
246
Individually caught specimens can be identified using DNA barcoding, which uses short genetic
247
markers (DNA barcodes) in an organism’s DNA to assign it to a species using a pre-existing
248
classification and reference database. Today, the public library of standardized DNA barcodes
249
(http://www.barcodeoflife.org) allows the identification of a wide range of species based on the
250
corresponding sequence reference for animals (COI gene), plants (rbcL, matk, 18S), cyanobacteria
251
(16S) and fungi (ITS) (see Creer et al. 2016 for an overview of other markers currently in use). Single
252
specimen DNA barcoding is widely used, for example in biodiversity conservation, environmental
253
management, invasion biology, studies of trophic interactions and food safety (Cristecu, 2014) but is
254
not yet a cost efficient method for most ecological assessment purposes (Stein et al., 2014).
255
More recently, high throughput sequencing (HTS) techniques have allowed the barcodes of multiple
256
organisms to be obtained in a single reaction, enabling parallel sequence-based identification in an
257
approach termed DNA metabarcoding (Taberlet et al., 2012b; Shokralla et al., 2012). This approach
258
offers the opportunity for non-targeted (passive) detection of a wide range of rare and invasive
259
species (for example Blackman et al., 2017; see Lawson Handley, 2015, for a review) and to assess
260
the composition of whole communities. The application of DNA metabarcoding to community DNA
261
extracted from organisms or environmental samples (eDNA) is the focus of this paper.
AC C
EP
TE D
M AN U
SC
RI PT
238
12
ACCEPTED MANUSCRIPT Most current sequencing protocols rely on rather short (i.e. about 70-500 base pair) metabarcoding
263
markers and thus are capable of using the degraded DNA often found in eDNA samples (see Elbrecht
264
and Leese, 2017, for an overview). Recent research has shown that DNA-based methods are effective
265
at detecting aquatic species of microalgae and protists (Medinger et al., 2010; Kermarrec et al., 2014;
266
Kelly et al. 2017), meiofauna (Carugati et al., 2015), macroinvertebrates (Hajibabaei et al., 2011;
267
Sweeney et al., 2011; Aylagas et al., 2016), fish (Thomsen et al., 2012; Kelly et al., 2014; Civade et al.,
268
2016; Hanfling et al., 2016; Shaw et al 2016) and amphibians (Ficetola et al., 2008; Dejean et al.,
269
2012). However, the protocols and workflows used for capture, extraction and identification of DNA
270
are highly diverse even within BQEs. This makes comparison of results from different laboratories
271
and studies difficult (Deiner et al., 2015) and will limit the use of DNA for aquatic biodiversity
272
assessment until the biases associated with different methods are fully understood and controlled.
273
Probably the critical consideration is choosing the most appropriate primer, which determines the
274
DNA marker used for identification, and its length. This in turn influences the taxonomic resolution
275
that can be achieved and affects the extent to which species level identifications can be made;
276
primer choice also affects the specificity of the analysis. In some cases, highly specific primers can be
277
developed that will amplify the entire target organism group and little else (the 12S primers for fish
278
are a good example). In other cases, primers that are general enough to capture the whole group will
279
inevitably amplify non-target taxa as well. An example of this is the primers designed to amplify
280
benthic invertebrates, which consistently amplify a wide range of non-metazoan taxa when used on
281
environmental samples.
SC
M AN U
TE D
EP
AC C
282
RI PT
262
283
Criteria to rate the potential for application of DNA-based identification
284
Here we describe and justify a set of criteria, which will later be used to rate the applicability of DNA-
285
based identification for incorporation into WFD assessment for different BQEs and water categories.
286
As we limit the applicability check to DNA-based identification, and do not include more advanced 13
ACCEPTED MANUSCRIPT approaches (i.e. Option 2 described in the introduction), the criteria are restricted to those rating the
288
performance of WFD-related assessment methods. The criteria are categorised under six headings: 1)
289
Representativeness, 2) Sensitivity, 3) Precision, 4) Comparability, 5) Cost-effectiveness and 6)
290
Environmental impact, and are not always independent. For example, the cost of sample collection
291
and processing will influence the sampling strategy undertaken (frequency and number of samples
292
collected), which, in turn, will influence the representativeness and precision of the overall
293
assessment of ecological status. Here, we will address each of these criteria separately, whilst
294
considering those interactions relevant to DNA-based identification.
SC
RI PT
287
295 1) Representativeness
297
Criterion 1.1: Applicability of current sampling methods, and availability of alternative methods for
298
obtaining biological material for DNA-based identification
299
This criterion addresses how samples are collected and processed prior to sequencing, to determine
300
if current sampling methods are suitable for molecular methods, or if simple alternatives are
301
available. The criterion is relevant to establish whether DNA-based identification can be used without
302
changing current sampling strategies significantly, or if major changes in sampling methods are
303
required.
304
For some taxa ( microalgae, macroinvertebrates) entire unprocessed samples have been used for
305
extraction and subsequent metabarcoding (Zimmermann et al., 2015; Elbrecht et al., 2017), which
306
can be analysed in parallel with microscopy. However, for inventories of fish species, the current
307
sampling methods (for example electrofishing) cannot be used for DNA-based assays. The proposed
308
solution of sampling eDNA from water is a simple and effective alternative. Results from eDNA
309
approaches are often very similar to those from traditional netting or electrofishing, although usually
310
more effective (Takahara et al., 2012; Shaw et al., 2016; Hanfling et al. 2016; Stoeckle et al., 2017;
311
Pont et al. submitted). However, the inference of temporal and spatial distribution of species
AC C
EP
TE D
M AN U
296
14
ACCEPTED MANUSCRIPT through eDNA is complicated since detection is influenced by environmentally variable DNA
313
degradation rates, transport and species specific behavioural patterns (Barnes and Turner, 2015;
314
Stoeckle et al., 2017). The spatial scale of eDNA detectability is of particular importance in lotic
315
ecosystems, as eDNA may only detect species present in upstream regions or tributaries. On the
316
other hand, eDNA may better represent species composition across the whole waterbody (from a
317
few to several tens of kilometres; Civade et al., 2016; Pont et al. submitted), as is required for
318
surveillance monitoring. Understanding the spatial and temporal scales that eDNA represents is a
319
hurdle to the deployment of this approach for WFD monitoring.
320
After the removal of an organism, DNA persistence under normal conditions in water is quite short (a
321
few days to two weeks in mesocosms; Ficetola, 2008; Dejean et al., 2011; Pilliod et al., 2013). In
322
rivers, eDNA concentration and detectability downstream from the point of production are
323
dependent on production and degradation rates, dilution, transport through the river network,
324
deposition, and resuspension (Thomsen et al., 2012). Detectable eDNA can be found at distances
325
from a few hundred metres to a few kilometres downstream of its source (Deiner and Altermatt,
326
2014; Jane et al., 2015; Civade et al., 2016; Wilcox et al., 2016). The detection distance of eDNA is
327
important for defining the scale at which eDNA can reveal spatial and temporal differences in
328
biological communities (Civade et al., 2016; Deiner et al., 2016; Staehr et al., 2016; Bista et al., 2017;
329
Stoeckle et al., 2017; Yamamoto et al., 2017).
330
We used this criterion for rating the magnitude of alterations in sampling methods required to apply
331
DNA-based identification.
SC
M AN U
TE D
EP
AC C
332
RI PT
312
333
Criterion 1.2: Errors from DNA-based species detection and similarity of DNA-based and conventional
334
taxon lists
335
This criterion addresses the question of how comparable taxon lists obtained with DNA-based
336
methods are to taxon lists obtained with traditional methods, in particular as a result of detection 15
ACCEPTED MANUSCRIPT errors. The criterion is relevant to judge if current assessment indices and associated class
338
boundaries can be applied to taxon lists generated with DNA-based methods.
339
In the production of taxon lists, two types of error occur, false negatives, where a taxon is recorded
340
as absent yet is in fact present, and false positives, where a taxon is recorded as present yet is in fact
341
absent: misidentifications comprise both type of error (the correct species is falsely recorded as
342
absent, whilst the incorrect species is falsely recorded as present). Both error types affect index
343
values and hence the accuracy of assessments (Criterion 2), and add uncertainty (Criterion 3). Both
344
visual and DNA-based methods are prone to identification errors. Whilst it is known that errors can
345
significantly affect the results of traditional assessments (Haase et al., 2006), much work remains to
346
be done for DNA-based methods. If the DNA-based identification targets morphotaxa rather than
347
OTUs, benchmarking against morpho-taxonomic approaches will be critical before molecular
348
approaches can be implemented in regular assessment programs. This has been performed partly for
349
fish (Hanfling et al., 2016), marine phytoplankton (Mohrbeck et al., 2015; Albaina et al., 2016),
350
macroinvertebrates (for example Aylagas et al., 2016; Elbrecht and Leese, 2015) and diatoms
351
(Zimmermann et al., 2015).
352
Direct comparison of detection rates from DNA surveys and traditional survey methods have found
353
that the likelihood of species detection increases with the density of target organisms for both
354
approaches, but at a higher rate for DNA based methods than for morpho-taxonomic methods
355
(Darling and Mahon, 2011). Where they have been tested, false negative rates are either similar to
356
those of established methods or lower (Deiner et al., 2017). Reasons for false negatives in DNA
357
approaches include inefficiency of molecular assays (incomplete barcode libraries, primer bias, low
358
sensitivity), low DNA quality (insufficient DNA, poor quality of eDNA due to environmental conditions
359
or ineffective sample preservation; Darling and Mahon, 2011; Thomsen et al., 2016), the presence of
360
PCR inhibitors (Jane et al., 2015), structural errors (for example errors in bioinformatics) and, in the
361
case of eDNA studies, stochastic effects during sampling due to the low concentration and
AC C
EP
TE D
M AN U
SC
RI PT
337
16
ACCEPTED MANUSCRIPT heterogeneous distribution of DNA molecules (Ficetola et al., 2015). In order to ensure that rare
363
species are detected, sampling effort needs to be high in terms of the number of replicates or
364
volume of water filtered (Hanfling et al., 2016; Shaw et al., 2016; Valentini et al., 2016). The low
365
target DNA concentration typical for eDNA samples also increases the risk of contamination during
366
sampling and laboratory work. Similarly, the probability of species detection is dependent on
367
sampling effort when using traditional methods, such as electrofishing (Lyon et al., 2014).
368
On the other hand, false positives (including “unexpected” detections) are an important problem
369
especially in eDNA metabarcoding. False positive detections may arise through contamination during
370
sampling and laboratory work, structural errors (for example errors in bioinformatics, chimeras), the
371
presence of target DNA in samples where the organism in question is not present (Darling and
372
Mahon, 2011; Stoeckle et al., 2017; Yamamato et al. 2017) or only present in upstream sites
373
(Hänfling et al., 2016), and dead organisms or life-stages (seeds, spores, eggs, early instars)
374
associated with non-viable populations. The results of eDNA studies can be influenced strongly by
375
single molecules. It is less likely to be a concern for whole community analyses where the majority of
376
organisms present in the sample will be relevant and their abundant DNA reduce the influence of
377
trace DNA. There is a clear need to relate DNA reads to the presence of viable populations within the
378
water body. At some point the information gained from molecular methods will tip from “signal” to
379
“noise”, and it will be important to learn to differentiate between an indication of a genuinely rare
380
species and reads caused by DNA from non-viable organisms.
381
As a result, the taxa lists produced by DNA-based methods are different from those generated by
382
traditional methods: additional taxa will be included that are not identifiable with morphometric
383
methods, while other taxa will not be detected. In addition, detection limits will differ, dependent on
384
the way specimens/DNA are extracted from the raw samples. DNA-based taxa lists will inevitably
385
require some manipulation before they can be used in current assessment methods. This may
386
involve filtering DNA-based lists against the operational taxon list used for that assessment system,
AC C
EP
TE D
M AN U
SC
RI PT
362
17
ACCEPTED MANUSCRIPT thus eliminating those taxa which are not detected with traditional methods (Elbrecht et al., 2017) as
388
well as indicating those that cannot (yet) be identified with DNA based methods (for example due to
389
incomplete reference databases). Alternatively, assessment systems may need to be modified, by
390
aligning (intercalibrating) future indices suitable for DNA-based methods with existing indices if the
391
full potential of genetic identification is to be realised.
392
We used this criterion to rate the suitability of DNA-based taxon lists for the calculation of the
393
assessment indices applied in the current WFD assessment schemes.
SC
394
RI PT
387
Criterion 1.3: Need for assessment of abundance and accuracy of abundance estimates with DNA-
396
based methods
397
This criterion addresses questions regarding the capability of DNA-based methods to estimate
398
abundance alongside the relevance of abundance estimates is for current WFD assessment methods.
399
The criterion is relevant to understand whether missing information on abundance will be a
400
significant obstacle before DNA-based assessments can be applied to meet current WFD
401
requirements.
402
The WFD specifies that abundance should be considered when determining ecological status; hence,
403
current WFD approaches include estimates of abundance (often as abundance classes). For
404
straightforward integration of DNA-based identification into these approaches, molecular methods
405
also need to generate abundance estimates. Therefore, a key question is whether or not DNA-based
406
methods can provide reliable estimates of absolute or relative species abundance (see for review
407
Bohmann et al., 2014; Rees et al., 2014; Lawson-Handley, 2015). While quantitative PCR approaches
408
can be used to quantify target organisms (Takahara et al., 2012; Kelly et al., 2014; Nathan et al.,
409
2014; Klymus et al., 2015; Baldigo et al., 2017), this becomes problematic for metabarcoding due to
410
primer bias (Pinol et al., 2014; Elbrecht and Leese, 2015). Factors that influence DNA concentration
411
and errors along the analytical pipeline can alter the relationship between the initial quantity of DNA
AC C
EP
TE D
M AN U
395
18
ACCEPTED MANUSCRIPT in the sample and the final number of reads per species (see Bohman et al., 2014, for a review).
413
Nevertheless, recent results have tended to demonstrate a link between the initial amount of DNA
414
and the number of reads (Elbrecht et al., 2017; Klymus, 2017), opening the possibility of estimating
415
relative abundances of target taxa from high-throughput sequences of eDNA samples (Hanfling et al.
416
2016; Pont et al., submitted; Brys et al., submitted). Metagenomic approaches, where target DNA is
417
sequenced without a PCR-amplification step, could potentially overcome or reduce taxa biases
418
associated with some metabarcoding assays (Thomsen et al., 2016; Choo et al., 2017). Whilst
419
correlations between metagenomic- approaches and PCR-based approaches are significant, their
420
strength is moderate, and the first results have been a proof of concept rather than demonstration of
421
quantitative [predictive?] relationships.
422
It is important to note that even if a strong relationship can be obtained between amount of DNA in
423
a sample and the number of sequence reads, the relationship between the number (or biomass) of
424
organisms and the amount of DNA released into the environment is not straightforward. Some
425
organisms (for example fish) shed DNA continuously while others (for example crayfish) shed large
426
amounts when they breed or moult but very little at other times of year. Even for fish, spawning
427
introduces large amounts of DNA into the environment that does not reflect the size of the adult
428
population. Thus, sampling campaigns need to take account of the ecology and life-histories of the
429
target organisms before quantitative inferences can be made.
430
Correction factors can eliminate biases to an extent when DNA-based data are used in assessment
431
systems (Thomas et al., 2016). Furthermore, many assessment systems use relative rather than
432
absolute abundance or summarise absolute abundance as broad categories (for example log
433
categories), where small biases may not introduce much uncertainty (Birk et al., 2012). A number of
434
studies have demonstrated that relative abundance estimates from eDNA metabarcoding of fish
435
communities show good correlations with abundance estimates from established survey methods. A
436
comparison of electrofishing and eDNA based methods along the Rhône River, for example, revealed
AC C
EP
TE D
M AN U
SC
RI PT
412
19
ACCEPTED MANUSCRIPT a sufficient correlation between the two techniques to describe the structure of fish assemblages
438
and their longitudinal change in terms of relative abundance (Pont et al., submitted). In Windermere,
439
a large lake in the UK, rank abundance from long-term traditional survey data correlated well with
440
eDNA based estimates of relative abundance (Hanfling et al., 2016) and a recent study in Belgian
441
ponds showed strong correlations between sequence read counts and fish biomass (Brys et al.,
442
submitted). As the WFD assessment approach demands that comparison are made between
443
observed and expected conditions, it may be possible to correct for consistent biases, particularly
444
when the reference condition is based on new characterisation using molecular techniques.
445
We used this criterion to rate the degree of changes required in current WFD assessment schemes to
446
account for the differences in abundance data generated by DNA-based identification methods
447
compared with traditional identification methods.
448
M AN U
SC
RI PT
437
2) Sensitivity of species detection
450
Criterion 2.1: Capability of DNA-based methods to sample sensitive taxa
451
This criterion addresses the question of whether or not DNA-based methods are suitable for the
452
detection of sensitive taxa, which are an integral part of most WFD assessment methods. The
453
criterion is relevant to rate if current assessment metrics can reasonably be applied with taxon lists
454
generated with DNA-based methods.
455
Whilst some management objectives may require complete lists of taxa present (for example the
456
conservation objectives of the Habitats Directive, which target species listed in Annexes II, IV and V;
457
see http://ec.europa.eu/environment/nature/legislation/habitatsdirective/index_en.htm), the
458
objective of the WFD is the sustainable development of water bodies. Hence, the principal role of
459
biological monitoring is to determine the condition of the ecosystem and to detect impacts that
460
could impede WFD objectives. Those taxa that are sensitive to human-induced stress are not
461
necessarily those that contribute the most to structure and function, and assessments need to be
AC C
EP
TE D
449
20
ACCEPTED MANUSCRIPT aware of this. For example, several sensitive benthic invertebrate species with a long life cycle,
463
whose occurrence indicates the absence of pollution events over a long time period, tend to occur at
464
low abundance (e.g. large Plecoptera species). Whilst a complete list of taxa might not be required to
465
determine stress effects, rare taxa are important components of some assessment metrics as they
466
are typically most sensitive to water body deterioration (Clarke and Murphy, 2006). For those BQEs
467
and water categories where this has been demonstrated, it is important to ensure that rare species
468
are accurately characterised when developing techniques that involve bulk extraction of genetic
469
material. For fish, the capacity of DNA based methods to detect rare species in rivers more effectively
470
than traditional methods has been clearly demonstrated (Civade et al., 2016; Pont et al., submitted),
471
whereas for invertebrate samples it may be necessary to transform or increase sequencing depth in
472
order to ensure rare taxa are detected (Elbrecht et al., 2017). For phytobenthos, the main issue is the
473
severe underrepresentation of rare species in existing reference databases (Kermarrec et al. 2014).
474
Another issue affecting sensitivity is sequencing depth relative to non-target DNA. For example,
475
samples may have high concentrations of DNA from taxa that are not relevant for calculation of
476
indices (e.g. fungi) and these high concentrations may reduce sensitivity to target or rare taxa.
477
We used this criterion to rate if current assessment indices can be applied with DNA-based taxon
478
lists.
SC
M AN U
TE D
EP
479
RI PT
462
Criterion 2.2: Unassigned reads
481
This criterion addresses the separate but related question, of how the influence of f “unassigned”
482
reads (i.e. those reads or OTUs that do not match a Linnaean taxon in DNA reference databases) is
483
minimised. This criterion is relevant to judge if it is necessary to either generate more data for DNA
484
reference databases or, alternatively, to generate data on ecological preferences for unassigned
485
OTUs before they could be used in assessment systems.
AC C
480
21
ACCEPTED MANUSCRIPT The extent of this problem varies among BQEs and is particularly complex for taxa-rich BQEs. For
487
microalgae, Linnaean nomenclature still needs to be reconciled with cryptic diversity and possibly the
488
depth of coverage of each taxon needs to be reconsidered. Whilst chimeras and mistags occur for all
489
BQEs, for most the frequency of unassigned reads is related to the completeness of barcode libraries.
490
The COI gene, for example, is available for hundreds of thousands of species, yet many taxa have are
491
still to be sequenced. Additional sequences are needed for adequate representation of intraspecific
492
and geographic variation (Bergsten et al., 2012). For groups where other gene regions are preferred
493
(for example 18S and rbcL for microalgae, 16S for Cyanobacteria) the number of taxa sequenced is
494
lower despite considerable sequencing effort (for example Rimet et al., 2016). For fish, a barcode
495
library based on the 12S marker is still in development for Southern and Eastern Europe, but 90% of
496
fish species encountered in Western European continental water bodies have already been
497
sequenced (Valentini et al., 2016). For UK macroinvertebrates, most OTUs have been assigned to
498
species based on COI data, although taxonomic problems resulting from cryptic species remain to be
499
solved (Andujar et al., accepted).
500
Poor species representation in reference databases may lead to incorrect identifications and, thus,
501
affect the assessments of ecological quality (Aylagas et al., 2014). In turn, this depends on the
502
structure of the index. Four types of indices are used to assess ecological status for the WFD (Hering
503
et al., 2006): Composition / abundances indices, richness / diversity indices, sensitivity / tolerance
504
indices and functional indices. Incomplete barcode libraries may have little influence on diversity
505
indices, as the number of OTUs overall or within broad classification groups (for example order) may
506
be sufficient to derive index values. However, those indices that are calculated from species presence
507
are more vulnerable, as they require correct species identification. Indices based on average scores
508
are likely to be more robust to missing taxa, but efforts will be needed to benchmark indices derived
509
through molecular methods against those derived using existing approaches (Ärje et al., 2017).
AC C
EP
TE D
M AN U
SC
RI PT
486
22
ACCEPTED MANUSCRIPT 510
We used this criterion to rate how complete barcode libraries are for the individual BQEs and how
511
incomplete barcode libraries will affect assessment results.
512 3) Precision of DNA-based identifications
514
Criterion 3.1: Knowledge about uncertainty of DNA-based identification
515
This criterion addresses the question of how well the uncertainty associated with DNA-based
516
identification is known. The criterion is relevant as the WFD explicitly requires (Annex 1.3.4) that the
517
uncertainty of assessments is reported.
518
As WFD assessments are used to guide management decisions and, hence, have both political and
519
economic implications, there is considerable focus on the confidence in any assessment of ecological
520
status made. The level of uncertainty can be estimated using specifically designed software (Clarke
521
and Hering, 2006, Kelly et al., 2009) but differs between BQEs and associated assessment methods
522
(Birk et al., 2012). As the use of molecular approaches does not result in directly equivalent data (see
523
criteria 1.1 to 1.3), it will be necessary to quantify the uncertainty associated with the new methods
524
and the impact on assessment metrics and classification. All steps in the identification and
525
enumeration process will need to be considered, including processing (for example platform chosen,
526
sequencing depth, pre-treatment), and data analysis (for example bioinformatics), as each has the
527
potential to influence the resulting taxa list. Identification is only one step in the process and, at this
528
stage, it is unclear whether or not uncertainty will increase or decrease if molecular methods are
529
adopted. Leaving aside stochastic variability from sampling and biases associated with primer
530
selectivity, representation and other processing errors, assessments are affected by the power of
531
identification. Structural changes in the power of identification are likely to occur over time (for
532
example infilling of barcode libraries, technological developments in platforms, better links between
533
DNA-based and morpho-taxonomy). Robust quality assurance methods will be necessary in order to
534
quantify such changes. Quality assurance procedures based on morpho-taxonomic approaches are
AC C
EP
TE D
M AN U
SC
RI PT
513
23
ACCEPTED MANUSCRIPT also fundamental to account for any bias introduced by DNA contamination and chimeras, and their
536
adoption would allow for continuous comparison with existing methods to demonstrate the effects
537
of future advances in technology. Simulations can help to better understand the effect of the
538
differing taxonomic resolution on assessment indices and the degree of bias between morphology-
539
based and DNA-based identification methods (for example Ärje et al., 2016).
540
We used this criterion to roughly estimate the uncertainty associated with DNA-based identification
541
of different BQEs.
RI PT
535
SC
542 4) Comparability with conventional approaches
544
Criterion 4.1: Sensitivity of EQRs to differences in DNA-based identification
545
This criterion addresses the question of whether or not current Ecological Quality Ratios can be used
546
with assessment results generated with DNA-based identification methods. The criterion is relevant
547
to estimate the degree to which EQRs need to be adapted, to achieve similar assessment results as
548
traditional methods. It is a validation criterion integrating aspects of Criteria 1.1 to 1.3.
549
As the WFD approach requires the comparison of an observed assemblage to the assemblage
550
expected under “reference conditions” (i.e. an EQR), anything which influences the observed or the
551
expected score will affect the EQR. The adoption of molecular methods will alter the probability of
552
detection of observed species. However, increased resolution will create a demand for data
553
describing species tolerances to stressors. Currently we have little understanding of tolerances for
554
many taxa at species level, a situation that will not be easy to resolve for species with limited
555
distributions. Reducing the DNA-generated taxa list (see Criterion 1.2) to match current taxonomic
556
resolution may resolve this issue, otherwise the expected reference condition and/or quality class
557
boundaries will have to be adjusted. Differences in scores between existing and DNA-based methods
558
could be converted using correction factors to ensure comparability between past and future
559
monitoring results (Vasselon et al., 2017). Alternatively, molecular data can be treated at face value,
AC C
EP
TE D
M AN U
543
24
ACCEPTED MANUSCRIPT 560
an option for phytobenthos, for example, where the traditional approach itself has inherent biases
561
(Kelly et al., 2017).
562
We used this criterion to rate if adaptations of EQRs are necessary and feasible.
563 Criterion 4.2: Intercalibration
565
This criterion addresses the question regarding whether or not an intercalibration of boundaries for
566
ecological status classes is feasible for assessment methods that use DNA-based identification.
567
Intercalibration is a requirement for all new or revised assessment methods to be applied under the
568
WFD.
569
The statutory goal of Good Ecological Status requires that status class boundaries are harmonised
570
between all Member States of the EU. Although each Member State is free to develop a method for a
571
BQE that is most appropriate to its conditions, there is a practical need to have data that can be
572
compared with that produced by neighbouring Member States in order to ensure consistent
573
application of the WFD across the EU. Existing boundaries, in particular the high-good and good-
574
moderate boundaries, have been harmonised through the process of intercalibration. New molecular
575
methods will need to fit into this framework and procedures exist (European Union, 2015) to help
576
Member States achieve this. However, this will inevitably entail comparisons with countries still using
577
traditional approaches. This, however, will not be the first time that a Member State has proposed an
578
approach that cannot be compared directly with those of nearby countries (Poikane et al., 2014). In
579
such circumstances, it will be necessary to apply both methods in parallel at sites ranged along key
580
environmental gradients such that the position of boundaries established using the new method can
581
be compared with existing boundaries. In practice, this will concern the average position of
582
boundaries established by those countries that have already taken part in the intercalibration
583
exercise for a particular BQE and water body type. As such parallel datasets are likely to be collected
AC C
EP
TE D
M AN U
SC
RI PT
564
25
ACCEPTED MANUSCRIPT during the process of method development or testing in each country, intercalibration is unlikely to
585
present a serious challenge.
586
It should be noted that intercalibrated standards do not just affect comparisons among Member
587
States: the target of Good Ecological Status is a long-term policy goal and any change in methods
588
within a country has implications for detection of long-term change and, hence, progress towards
589
this target. Changes in the position of key status class boundaries will need to be justified to
590
governments and stakeholders as these will have implications for regulation.
591
We used this criterion to rate if there are obstacles for intercalibrating indices that are calculated
592
with DNA-based taxon lists.
SC
RI PT
584
M AN U
593 5) Cost-effectiveness
595
Criterion 5.1: Costs compared to traditional methods
596
This criterion addresses the question of whether or not DNA-based methods have the potential to
597
substantially lower the costs of monitoring. This is relevant as monitoring programmes are often
598
subject to severe financial pressure.
599
In recent years, the cost of sequencing biological material has fallen sharply and is likely to fall
600
further as technology develops. However, cost-effectiveness is not defined simply by the monetary
601
cost of sample processing but includes factors such as cost and availability of facilities, training
602
needs, speed of processing, sensitivity and precision. Here, molecular approaches could provide an
603
advantage via low processing costs and rapid turn-round (“economies of scale”), potentially enabling
604
increased sampling frequency, increasing precision of assessments and enabling more responsive
605
monitoring of pollution events or restoration activities. Furthermore, sampling eDNA is often
606
cheaper than traditional sampling methods, e.g. electrofishing, gillnetting or trawling. Again, we
607
stress that the whole cycle should be considered when comparing approaches: advantages gained by
AC C
EP
TE D
594
26
ACCEPTED MANUSCRIPT 608
mechanising one aspect can easily be offset by losses in other parts of the assessment process (Stein
609
et al., 2014; Elbrecht et al., 2017).
610
We used this criterion to rate the potential for cost reduction through the use of DNA-based
611
methods for the individual BQEs.
RI PT
612 Criterion 5.2: Processing speed
614
This criterion addresses the question of whether sample processing can be accelerated by DNA-
615
based identification or not. The criterion is relevant as the time required for manual identification is
616
often a bottleneck for processing biological samples for WFD monitoring, particularly those requiring
617
trained experts for microscopic identification (i.e. phytoplankton and macroinvertebrates). The speed
618
of processing could be enhanced by DNA-based methods (Goodwin et al., 2017). DNA based methods
619
could also benefit those BQEs requiring time-consuming sampling (for example electrofishing, gill-
620
netting). At present, however, sequencing and computer capacities are limited for such DNA-based
621
methods in many countries. This can itself create a bottleneck, potentially exacerbated by the need
622
to run sequencing machines at full capacity in order to access the economies of scale described in
623
5.1. Early experience in the UK is that the shift to DNA-based analysis of phytobenthos makes it
624
harder for laboratories to respond to requests to prioritise particular samples. This situation should
625
change over time, as capacity increases and technology advances, as well as through knowledge
626
transfer (Leese et al., submitted).
627
We used this criterion to rate the potential for speeding up sample processing for individual BQEs.
M AN U
TE D
EP
AC C
628
SC
613
629
6) Criterion 6.1: Animal well-being, health and safety, environmental impact
630
This criterion addresses the question of whether DNA-based identification can reduce the
631
environmental impact and safety risks of sampling methods.
27
ACCEPTED MANUSCRIPT “Hands-off” techniques, such as eDNA assessments of fish populations, provide benefits for the well-
633
being of fish (and bycatches of non-target organisms such as mammals or birds) particularly when
634
compared with destructive methods such as gill-netting. This also holds true for nationally or
635
internationally protected or red-listed species. For endangered species, sampling is often limited
636
during critical life stages (e.g. during breeding season) to reduce potential impacts on the species.
637
However, that may be the best opportunity to document their presence or density. Use of eDNA
638
provides an opportunity to sample during critical life history phases in a less intrusive manner.
639
Similarly, health and safety risks may be reduced when individuals do not have to enter the water or
640
use heavy or potentially dangerous equipment (for example electrofishing apparatus) to collect
641
samples or perform surveys.
642
We used this criterion to rate the potential for DNA-based methods to reduce the environmental and
643
health and safety impacts of monitoring activities.
M AN U
SC
RI PT
632
644
Applicability of DNA-based identification for combinations of BQEs and water categories
646
We applied the criteria listed in the previous chapter to each combination of BQEs (phytoplankton,
647
benthic flora, invertebrates, fish) and water categories (rivers, lakes, coastal and transitional waters)
648
(Figure 1). In the following, we provide justification for the values given in Figure 1, where the
649
applicability of the individual criteria is rated as:
651 652
655
“high” (1), i.e. the criterion poses no obstacle to the implementation of DNA-based identification;
•
653 654
EP
•
AC C
650
TE D
645
“medium” (2), i.e. DNA-based identification could be applied but requires changes in the
sampling scheme or the assessment system;
•
“low” (3), i.e. DNA-based identification is currently not possible without substantial changes in the sampling scheme or the assessment system.
28
ACCEPTED MANUSCRIPT The ranking is based on the qualitative analysis of the literature given in the previous sections . As
657
the criteria are not necessarily of equal relevance, the ranking of the individual criteria does not
658
imply an overall ranking of the BQEs. In particular, Criteria 5.1, 5.2 and 6.1 do not address the
659
technical feasibility of DNA-based identification, rather additional arguments for the use of DNA-
660
based methods.
RI PT
656
661
Criterion 1.1 (Applicability of current sampling methods, and availability of alternative methods, for
663
obtaining biological material for DNA-based identification): Applicability of sampling methods differs
664
greatly between organism groups. For phytoplankton, phytobenthos and invertebrates the
665
traditional sampling methods can be used for DNA-based assessment (high), although some aspects
666
such as use of ethanol as a fixative is problematic for cost and safety reasons in several European
667
states. For fish, traditional electrofishing or gill-netting can be replaced by water samples for
668
extraction of eDNA, which would be a simple and effective alternative (high). Macrophytes,
669
macroalgae and angiosperms are surveyed rather than sampled; most species are identified in the
670
field and their abundance is estimated directly. A different, and as yet not available, sampling
671
method capable of detecting all relevant species adequately would need to be applied for DNA-based
672
identification (low).
M AN U
TE D
EP
673
SC
662
Criterion 1.2 (Errors from DNA-based species detection and similarity of DNA-based and conventional
675
taxon lists): This criterion depends on the transferability of DNA-based taxon lists into taxon lists
676
similar to those generated with morphology-based methods, and largely concerns taxa that are
677
currently only identifiable with either morphology or DNA-based methods. In principle, additional
678
taxa identified with DNA-based methods could be removed from a taxa list through use of filters
679
(thus allowing the continuous use of the current assessment metrics; Elbrecht et al., 2017), while
680
taxa not identified with DNA-based methods necessarily require changes in the assessment metrics.
AC C
674
29
ACCEPTED MANUSCRIPT The number of the latter is low for fish and for invertebrates (Valentini et al., 2016; Aylagas, 2017)
682
(high suitability), and despite a lower number of identifiable taxa, transferability has been
683
demonstrated for phytobenthos (Kelly et al., 2017) (high). For phytoplankton, this is still to be
684
demonstrated (medium). Combining directly identifiable taxa with known ecology, with those that
685
are assigned to an OTU to give an ecological value should improve current assessment systems,
686
without fundamentally changing their concept. For macrophytes, macroalgae and angiosperms most
687
species can be identified, but as sampling methods associated with current assessment systems do
688
not result in samples of all species (see 1.1), taxa lists generated with DNA-based identification may
689
differ more than for other BQEs (medium).
SC
RI PT
681
M AN U
690 691
Criterion 1.3 (Need for abundance assessment and accuracy of abundance estimates with DNA-based
692
methods): The relevance of this criterion depends on •
the role of abundance-based metrics in assessment methods for the individual BQEs;
694
•
options to measure relative abundance and to replace absolute by relative abundance;
695
•
options to transform abundance-based metrics into presence/absence-based metrics.
TE D
693
Currently, the normative definitions for most BQEs specifies a need for abundance estimates. For
697
phytoplankton, however, a measure of abundance is provided by chlorophyll concentration, resulting
698
in a “medium” rating of this criterion. For phytobenthos and invertebrates, there are promising signs
699
that presence/absence-based data and relative abundance estimates could be used (Vasselon et al.,
700
2017) (medium). For fish, there are attempts to infer relative abundance from eDNA, while age
701
classes cannot be detected (Hanfling et al., 2016, Pont et al., submitted) (medium). The species-poor
702
groups of macrophytes, angiosperms and macroalgae are surveyed rather than sampled under the
703
current assessment schemes; in its extreme form, an assessment system can be based on a single
704
species (e.g. Posidonia) and the assessment system simply rates its abundance and density. This
705
cannot be inferred from eDNA (low).
AC C
EP
696
30
ACCEPTED MANUSCRIPT 706 Criterion 2.1 (Capability of DNA-based methods to sample sensitive taxa): For fish, DNA-based
708
methods are clearly superior to electrofishing and gillnetting in terms of the detection of rare species
709
(Hanfling et al., 2016) (high). For invertebrates and phytoplankton, there is good evidence that the
710
relevant species are reliably captured with DNA-based methods (high), although unequal biomass
711
still requires manual size adjustments especially for the biomass-rich specimens or great sequencing
712
depths (Elbrecht et al. 2017). If a suitable sampling method could be found, this would also probably
713
apply to macrophytes, but, in the absence of this, we rate it as “unknown”. For phytobenthos, the
714
coverage of barcode libraries (see 2.2) limits this criterion (medium). There are currently no papers
715
on DNA-based methods for marine angiosperms and macroalgae (unknown). This does not, however,
716
mean that DNA-based identification is unsuitable for detecting sensitive marine angiosperm and
717
macroalgae taxa, only that more work is needed.
M AN U
SC
RI PT
707
718
Criterion 2.2 (Unassigned reads): This criterion is mainly associated with the completeness of
720
barcode libraries (COI gene, 18S and rbcL for microalgae, 16S for Cyanobacteria) and cryptic diversity.
721
Fish and macrophytes in rivers and lakes rate “high”, while barcode libraries for phytobenthos,
722
invertebrates and fish in transitional and coastal waters are in an intermediate state of completeness
723
(medium). For phytoplankton, cryptic diversity is an issue, as the number of taxa sequenced is lower
724
(low), while for macroalgae and angiosperms cryptic diversity could be an issue only for small
725
epiphytic species (low).
EP
AC C
726
TE D
719
727
Criterion 3.1 (Knowledge about uncertainty of DNA-based identification): For all BQEs, data on
728
uncertainty associated with the different steps of the DNA-based processing chain have not been
729
collected systematically or simulated (Ärje et al., 2016). We rate this criterion as “low” for
730
macrophytes, angiosperms and macroalgae, as sampling provides an additional - yet unquantified 31
ACCEPTED MANUSCRIPT 731
source of uncertainty, while in the absence of more precise data the criterion is rated as “medium”
732
for all other BQEs.
733 Criterion 4.1 (Sensitivity of EQRs to differences in DNA-based identification): It is likely that
735
approaches used to derive EQRs will need to be adapted for DNA-based identification, even if
736
taxonomic issues (Criteria 1.2 and 2.2) have been solved. The feasibility of this procedure has already
737
been demonstrated for phytobenthos (Kelly et al. 2017) and fish (Civade et al., 2016; Pont et al.
738
submitted) (high), and we assume that this procedure will be possible for most other BQEs (medium).
739
Exceptions are macrophytes in rivers and lakes, and angiosperms and macroalgae in coastal and
740
transitional waters, for which we question the suitability of currently applied indices for use with
741
DNA-based data, as most rely on measures of cover.
M AN U
SC
RI PT
734
742
Criterion 4.2 (Intercalibration): In principle, there are no obstacles preventing the WFD
744
intercalibration procedure being performed to compare DNA-based methods against traditional
745
methods. However, to date this process has not been undertaken, as few countries use DNA-based
746
identification for formal WFD assessments. Promising examples, for which DNA-based and morpho-
747
taxonomic approaches have been compared (although not yet intercalibrated) include phytobenthos
748
in rivers, invertebrates in rivers and transitional and coastal waters, and fish in rivers and lakes (high),
749
while we rate this criterion as “medium” for most other BQE-water type combinations. We expect
750
more general problems for macrophytes, angiosperms and macroalgae (low), as the compatibility of
751
these BQEs with DNA-based methods is generally questionable: These groups are species-poor, they
752
are identified and their abundance estimated in the field; applying DNA-based identification would,
753
therefore, require a different sampling strategy and different metrics, which limits comparability with
754
traditional approaches.
AC C
EP
TE D
743
755 32
ACCEPTED MANUSCRIPT Criterion 5.1 (Costs compared with traditional methods): A comprehensive overview of the costs
757
associated with DNA-based methods compared with traditional methods is not yet available (but see
758
Stein et al., 2014; Sigsgaard et al., 2015; Smart et al., 2016; Aylagas, 2017). It is expected that the
759
costs will be significantly lower for fish in rivers, lakes and transitional waters, as sampling eDNA is
760
much cheaper than electrofishing, gillnetting or trawling (high). For all other BQE-water category
761
combinations, we expect a potential for cost reduction, which nevertheless still needs to be explored
762
(medium).
RI PT
756
SC
763
Criterion 5.2 (Processing speed): The potential for increased processing speed is particularly high for
765
the labour-intensive identification of phytoplankton and invertebrates (high), while it is “low” for
766
macrophytes, macroalgae and angiosperms, for which the field survey is the most time-consuming
767
process. For all other BQEs, this criterion has been rated as “medium”.
M AN U
764
768
Criterion 6.1 (Animal well-being, health and safety, environmental impact): This criterion is only
770
relevant for invertebrates and fish. For invertebrates, the same sampling methods are applied for
771
traditional and DNA-based approaches. For traditional methods, the specimens are in most cases
772
sacrificed for morphological identification, unless they are sorted and identified alive; however, rare
773
and protected species (such as Odonata larvae and large mussels) are often identified in the field and
774
placed back in the water body afterwards. Although this option is possible for DNA-based methods,
775
there is generally a need to sacrifice specimens before DNA-based identification (low). For fish, the
776
sampling of eDNA is non-invasive and offers advantages over gillnetting, trawling or electrofishing
777
(high).
AC C
EP
TE D
769
778 779
Discussion and outlook
780
Suitability of DNA-based identification for different BQEs and water categories 33
ACCEPTED MANUSCRIPT This paper is limited to the use of DNA-based identification for biological assessment systems in
782
support of the WFD, although some of the issues discussed could be applicable to other directives
783
(i.e. the Marine Strategy Framework Directive) and other geographical areas (for example in the USA,
784
for the Clean Water Act; Keck et al. 2017). Clearly, DNA-based methods offer options, which can go
785
beyond simple identification to a predefined taxonomic level. Therefore, DNA-based identification is
786
likely to be a transition stage between conventional morpho-taxonomic approaches and DNA-based
787
ecological assessment methods. However, even DNA-based identification poses many obstacles and
788
cannot be implemented without adapting both the DNA-based identification procedure and the
789
assessment methods to which they would be applied. These obstacles to implementation differ
790
strongly among BQEs.
791
The advantages of DNA-based identification are obvious for fish: eDNA offers a well-suited and
792
reliable sampling method (although different from conventional methods), with a high probability of
793
detecting species (compared to other organism groups), whilst avoiding cost-intensive and harmful
794
sampling methods. But even for fish, assessment metrics will need to be adapted, in particular to
795
account for the change from absolute to relative abundances. Furthermore, some criteria required
796
by WFD legislation (for example age class) currently cannot be assessed using DNA-based methods
797
but, on the other hand, several currently adopted (and intercalibrated) methods do not include age
798
classes either.
799
For invertebrates and phytobenthos, DNA-based identification is close to being applicable in
800
standard monitoring programmes. For invertebrates, the main challenges remaining include dealing
801
with abundance and adaptation of EQRs for use with DNA-based methods. Furthermore, barcode
802
libraries need to be completed, in particular for phytobenthos. For phytoplankton, the latter problem
803
is even more relevant, due to high taxonomic diversity in plankton samples. For phytoplankton, the
804
problem of abundance can be circumvented, as chlorophyll concentration is also assessed. At
805
present, risk of cyanobacterial blooms is inferred from the abundance estimates, and a future DNA-
AC C
EP
TE D
M AN U
SC
RI PT
781
34
ACCEPTED MANUSCRIPT based approach would need to satisfy this requirement. For phytobenthos, most of the current
807
methods assess relative abundance of taxa, and do not take total abundance into account.
808
DNA-based identification is currently least appropriate for macrophytes (rivers, lakes) and
809
angiosperms / macroalgae (transitional and coastal waters), which are surveyed rather than sampled.
810
Surveys require taxonomic knowledge to gain a representative sample, and most identification is
811
carried out in the field. Furthermore, the indices rely on cover value, as a proxy for abundance.
812
Consequently, the applicability of DNA-based identification differs markedly among BQEs, while
813
there are only minor differences between water categories, mainly due to differences in the
814
completeness of barcode libraries and the translocation of eDNA in rivers.
SC
RI PT
806
M AN U
815 Implications of implementing DNA-based identification
817
Even the relatively minor changes resulting from the replacement of morphological with DNA-based
818
identification will have significant implications for WFD assessments. On the one hand, DNA-based
819
identification will require flexibility in the interpretation of the WFD and in how regulators use data.
820
On the other hand, it will pave the way for the development of a new generation of ecological
821
assessment tools, beyond and in parallel to the current WFD approaches. The principal challenge is
822
to solve the conflict between the inherent need for ecological assessment to be consistent over a
823
long time period, and the opportunities provided by the new methods.
824
The options for dealing with abundance is a good example of this conflict. Annex V of the WFD
825
stipulates that abundance must be recorded for most BQEs. The legislation is based on the
826
assumption that abundance provides more information than taxa lists alone, as changes in
827
abundance may occur long before human-induced pressures lead to the extinction of species. As a
828
consequence, the calculation of most functional indices requires data on either the abundance of a
829
taxon or, at the very least, the proportion of the whole sample or sub-sample that it represents.
830
Therefore, before DNA-based identification can be implemented, two questions need to be
AC C
EP
TE D
816
35
ACCEPTED MANUSCRIPT addressed: (1) How best to fulfil the legal requirement of recording abundance? And (2) How can the
832
information given by species’ abundances best be provided? The answer to the first question differs
833
between BQEs. For phytoplankton, there is the option of using chlorophyll concentration as a proxy
834
for abundance or biomass. From a practical point of view, a filtered plankton sample can be divided,
835
with one half being used to measure chlorophyll and the other half for DNA-based identification. The
836
remaining quantitative indicators required for phytoplankton are algal bloom frequency and
837
amplitude, which could be measured with frequent readings of pigments from satellites or
838
continuous reading from an automated buoy placed within the water body (Schluter et al., 2014).
839
Thus, a combination of DNA-based identification and other methods could fulfil the WFD’s
840
requirements. For fish, and probably other BQEs, there is the option to use relative rather than
841
absolute abundance based on read count data, or frequency of occurrences in several eDNA samples
842
as a proxy for abundance by analysing multiple eDNA replicates per site (Pilliod et al., 2013). In
843
response to the second question, there are promising signs for various BQEs and metrics that
844
presence-absence data give signals similar to abundance data and can be translated between one
845
another (Aylagas, 2017). However, questions remain, regarding the degree to which abundance data
846
– whether traditional or molecular – reflects biomass or processes (for example related to the
847
abundance of grazers or sediment feeders in the benthic invertebrate community. Currently applied
848
measures of abundance do not discriminate between large and small specimens: a tiny chironomid
849
larvae and a large stonefly larvae count the same, although the latter might have a 1,000 times
850
greater biomass. Clearly, there is room for improvement through DNA-based methods. Barcodes
851
potentially represent the abundance of mitochondria and plastids and may, indeed, offer greater
852
insights into which taxa are actually driving ecological processes within an ecosystem, by reflecting
853
the intensity of metabolic processes.
854
More generally, there is the question of how to achieve compatibility in ecological assessments when
855
replacing conventional by novel methods? The term “monitoring” implies recording of time series,
AC C
EP
TE D
M AN U
SC
RI PT
831
36
ACCEPTED MANUSCRIPT and, inherently, the consistent use of standard methods. In case of the WFD, the monitoring intervals
857
are very long: for River Basin Management Plans, for example, ecological status only needs to be
858
reported at six-yearly intervals. It should be possible to change methods between these intervals in
859
response to results and experience. DNA-based identification is only one, albeit significant, driver of
860
changes to methods. The benefits of increased accuracy and performance of enhanced ecological
861
assessment methods will always need to be carefully balanced against the potential loss of
862
compatrability. The implementation of new methods should, therefore, always be accompanied by a
863
re-calculation of indices from prior monitoring programmes, to ensure backward compatibility. This
864
underlines the need to develop capacity to archive DNA samples, particularly from reference sites, so
865
that as new technologies emerge, DNA from critical sites can be reanalysed using the new methods.
866
Closely related with the question of backward compatibility is the future evolution of methods. With
867
DNA-based identification, there is a clear need to allow methods to evolve, which may require
868
constant adaptation of indices and assessment methods. This is a potential paradigm shift in how to
869
handle monitoring data. In future, a rolling comparison with existing methods will be needed to
870
“buffer” monitoring results against the effects of advances in technology. However, provided there is
871
sufficient storage capacity, sequence data can be stored and reanalysed more easily than traditional
872
samples, ensuring a level of “forward compatibility” as bioinformatics and metrics improve, for as
873
long as sampling, DNA extraction and the sequencing itself are robust. Most importantly, DNA
874
extracts are relatively easy to store and this should be encouraged, as we do not know which
875
barcodes and methods will be available in the future.
876
The expense of implementation is another consideration when introducing DNA-based methods into
877
WFD assessments, since costs may be reduced compared with traditional assessment methods
878
(Aylagas, 2017). Expenses are not solely related to the costs of processing individual samples, but
879
encompass training, equipment purchase, administrative and maintenance costs, quality assurance
880
and, importantly, the costs of initial method development and ongoing evaluations and upgrades.
AC C
EP
TE D
M AN U
SC
RI PT
856
37
ACCEPTED MANUSCRIPT Any change in assessment methods and results needs to be communicated to policy makers and the
882
general public, which is not necessarily a straightforward procedure and which will require education
883
of stakeholder groups, including those from non-scientific backgrounds.
884
A general challenge for river basin management will be the breakdown of the assessment procedure
885
into several smaller steps, which are performed by different people or units. While in many countries
886
microscopic identification is still the responsibility of water boards, DNA-based identification is likely
887
to induce a shift to external service providers. Care must be taken that the individual steps of the
888
assessment procedure stay connected and allow informed interpretation of the data. Data generated
889
by DNA-based identification will need to be transferred to the responsible authorities in a way that
890
allows for simple understanding of procedures, results and their uncertainties. Decisions based on
891
assessment results precipitate significant investment by the private and public sectors, and it is
892
essential that decision makers are provided with monitoring data that have been generated in a
893
transparent way.
M AN U
SC
RI PT
881
TE D
894 Conclusions
896
There is great potential for DNA-based identification to be used for assessment procedures to fulfil
897
the requirements of the WFD. DNA-based identification can contribute to making assessment
898
procedures more cost-effective, faster, more transparent and have greater reproducibility. There are,
899
however, several practical obstacles, which will need to be overcome within the next years. We
900
recommend that the potential benefits of DNA-based identification are quantified relative to
901
existing traditional methods, together with the parallel application of morphometric and DNA-based
902
identification in order to learn how comparable the approaches are and to increase compatability
903
where necessary. DNA-based identification will be a valuable step into more advanced methods of
904
DNA-based monitoring, which may complement or even replace more traditional monitoring systems
905
in the future.
AC C
EP
895
38
ACCEPTED MANUSCRIPT 906 Acknowledgements
908
This paper is a result of the COST Action CA15219 “Developing new genetic tools for bioassessment
909
of aquatic ecosystems in Europe” (DNAqua-Net), funded by the European Union. We are grateful to
910
Alexander Weigand and Sarah Kückmann for their valuable support throughout the Action. We
911
greatly appreciated the comments of three anonymous reviewers, who contributed a lot to
912
improving the paper.
RI PT
907
SC
913 References
915
Albaina, A., Aguirre, M., Abad, D., Santos, M., Estonba, A., 2016. 18S rRNA V9 metabarcoding for diet
916
characterization: a critical evaluation with two sympatric zooplanktivorous fish species. Ecology and
917
Evolution 6, 1809-1824.
918
Andújar, C., Arribas, P., Gray, C., Bruce, K., Woodward, G., Yu, D.W., Vogler, A.P., accepted.
919
Metabarcoding of freshwater invertebrates to detect the effects of a pesticide spill. Molecular
920
Ecology.
921
Ärje, J., Choi, K.P., Divino, F. ,Meissner K. Kärkkäinen, S., 2016. Understanding the statistical
922
properties of the percent model affinity index can improve biomonitoring related decision making.
923
Stochastic Environment Research and Risk Assessment 30, 1981-2008.
924
Ärje,J., Kärkkäinen, S., Meissner, K., Iosifidis, A., Ince, T., Gabbouj, M., Kiranyaz, S., 2017. The effect of
925
automated taxa identification errors on biological indices, Expert Systems with Applications, Volume
926
72, Pages 108-120, ISSN 0957-4174, http://dx.doi.org/10.1016/j.eswa.2016.12.015.
927
Avó, A.P., Daniell, T. J., Neilson, R., Oliveira, S., Branco, J., Adão, H., 2017. DNA Barcoding and
928
Morphological Identification of Benthic Nematodes Assemblages of Estuarine Intertidal Sediments:
929
Advances in Molecular Tools for Biodiversity Assessment. Frontiers in Marine Science 4. 39
AC C
EP
TE D
M AN U
914
ACCEPTED MANUSCRIPT Aylagas, E., 2017. DNA metabarcoding derived biotic indices for marine monitoring and assessment.
931
PhD Thesis, University of the Basque Country, 248 pp.
932
Aylagas, E., Borja, A., Rodríguez-Ezpeleta, N., 2014. Environmental Status Assessment Using DNA
933
Metabarcoding: Towards a Genetics Based Marine Biotic Index (gAMBI). PLoS ONE 9, e90529.
934
Aylagas, E., Borja, A., Irigoien, X., Rodriguez-Ezpeleta, N., 2016. Benchmarking DNA metabarcoding
935
for biodiversity-based monitoring and assessment. Frontiers in Marine Science, 3, doI:
936
10.3389/fmars.2016.00096.
937
Baird, D.J., Hajibabaei, M., 2012. Biomonitoring 2.0: A New Paradigm in Ecosystem Assessment Made
938
Possible by Next-Generation DNA Sequencing. Molecular Ecology 21, 2039-2044.
939
Baldigo, P.B., Sporn, L.A., Scott, D.G., Ball, J.A., 2017. Efficacy of Environmental DNA to Detect and
940
quantify Brook Trout Populations in headwater streams of the Adirondack Mountains, New York.
941
Trans. Am. Fisheries Soc. 146(1), 99-111.
942
Barnes, M.A., Turner, C.R., 2015. The ecology of environmental DNA and implications for
943
conservation genetics. Conservation genetics 17, 1-17.
944
Bergsten, J., Bilton, D.T., Fujisawa, T., Elliott, M., Monaghan, M.T. Balke, M., Hendrich, L., Geijer, J.,
945
Herrmann, J., Foster, G.N., Ribera, I., Nilsson, A.N., Barraclough, T.G., Vogler, A.P., 2012. The Effect of
946
Geographical Scale of Sampling on DNA Barcoding. Systematic Biology 61, 851-869.
947
Birk, S., Bonne, W., Borja, A., Brucet, S., Courrat, A., Poikane, S., Solimini, A., van de Bund, W.,
948
Zampoukas, N., Hering, D., 2012. Three hundred ways to assess Europe's surface waters: An almost
949
complete overview of biological methods to implement the Water Framework Directive. Ecological
950
Indicators 18, 31-41.
AC C
EP
TE D
M AN U
SC
RI PT
930
40
ACCEPTED MANUSCRIPT Birk, S., Willby, N.J. Kelly, M.G. Bonne, W., Borja, A., Poikane, S., van de Bund, W., 2013.
952
Intercalibrating classifications of ecological status: Europe's quest for common management
953
objectives for aquatic ecosystems. Science of The Total Environment 454-455, 490-499.
954
Bista, I., Carvalho, G.R., Walsh, K., Seymour, M., Hajibabaei, M., Lallias, D., Christmas, M., Creer, S.
955
2017. Annual time-series analysis of aqueous eDNA reveals ecologically relevant dynamics of lake
956
ecosystem biodiversity. Nature Communications 8, 14087.
957
Blackman, R., Constable, D., Hahn, C., Sheard, A.M., Durkota, J., Hanfling, B., Lawson Handley, L.,
958
2017. Detection of a new non-native freshwater species by DNA metabarcoding of environmental
959
samples - first record of Gammarus fossarum in the UK. Aquatic Invasions 12, 177-189.
960
Bohmann, K., Evans, A., Gilbert, M.T., Carvalho, G.R., Creer, S., Knapp, M., Yu, D.W., de Bruyn, M.,
961
2014. Environmental DNA for wildlife biology and biodiversity monitoring. Trends Ecol. Evol. 29, 358-
962
67.
963
Borja, Á., Dauer, D.M., Grémare, A., 2012. The importance of setting targets and reference
964
conditions in assessing marine ecosystem quality. Ecological Indicators 12, 1-7.
965
Borja, A., M. Elliott, 2013. Marine monitoring during an economic crisis: The cure is worse than the
966
disease. Marine Pollution Bulletin 68, 1-3.
967
Bourlat, S.J., Borja, A., Gilbert, J., Taylor, M.I., Davies, N., Weisberg, S.B., Griffith, J.F., Lettieri, T.,
968
Field, D., Benzie, J., Glöckner, F.O., Rodríguez-Ezpeleta, N., Faith, D.P., Bean, T.B., Obst, M., 2013.
969
Genomics in marine monitoring: New opportunities for assessing marine health status. Marine
970
Pollution Bulletin 74, 19-31.
971
Brys, R., Bellemain, E., Halfmaerten, D., Dejean, T., Mergeay, M., 2017 (under revision).
972
Quantitatively predicting fish community composition using environmental DNA metabarcoding.
AC C
EP
TE D
M AN U
SC
RI PT
951
41
ACCEPTED MANUSCRIPT Carugati, L., Corinaldesi, C., Dell'Anno, A., Danovaro, R. 2015. Metagenetic tools for the census of
974
marine meiofaunal biodiversity: An overview. Marine Genomics 24, 11-20.
975
Choo, L.Q., Crampton-Platt, A., Vogler, A.P., 2017. Shotgun mitogenomics across body size classes in
976
a local assemblage of tropical Diptera: Phylogeny, species diversity and mitochondrial abundance
977
spectrum. Molecular Ecology 26, 5086-5098.
978
Civade, R., Dejean, T., Valentini, A., Roset, N., Raymond, J.-C., Bonin, A., Taberlet, P., Pont, D., 2016.
979
Spatial representativeness of environmental DNA metabarcoding signal for fish biodiversity
980
assessment in a natural freshwater system. Plos One. DOI:10.1371/journal.pone.0157366.
981
Clarke, R.T., Hering, D., 2006. Errors and uncertainty in bioassessment methods – major results and
982
conclusions from the STAR project and their application using STARBUGS. Hydrobiologia 566, 433-
983
439.
984
Clarke, R.T., Murphy, J.F., 2006. Effects of locally rare taxa on the precision and sensitivity of RIVPACS
985
bioassessment of freshwaters. Freshwater Biology 51, 1924-1940.
986
Creer, S., Deiner, K., Frey, S., Porazinska, D., Taberlet, P., Thomas, W.K., Potter, C., Bik, H.M., 2016.
987
The ecologist's field guide to sequence-based identification of biodiversity. Methods in Ecology and
988
Evolution 7, 1008-1018.
989
Cristescu, M.E., 2014. From barcoding single individuals to metabarcoding biological communities:
990
towards an integrative approach to the study of global biodiversity. Trends in Ecology and Evolution
991
29, 566-571.
992
Dafforn, K. A., Baird, D.J., Chariton, A.A., Sun, M.Y., Brown, M.V., Simpson, S.L., Kelaher, B.P.,
993
Johnston, E.L., 2014. Chapter One - Faster, Higher and Stronger? The Pros and Cons of Molecular
994
Faunal Data for Assessing Ecosystem Condition. Advances in Ecological Research 51, 1-40.
AC C
EP
TE D
M AN U
SC
RI PT
973
42
ACCEPTED MANUSCRIPT Danovaro, R., L. Carugati, L., Berzano, M., Cahill, A.E., Carvalho, S., Chenuil, A., Corinaldesi, C.,
996
Cristina, S., David, R., Dell'Anno, A., Dzhembekova, N., Garcés, E., Gasol, J.M., Goela, P., Féral, J.-P.
997
Ferrera, I., Forster, R.M., Kurekin, A.A., Rastelli, E., Marinova, V., Miller, P.I., Moncheva, S., Newton,
998
A., Pearman, J.K., Pitois, S.G., Reñé, A., Rodríguez-Ezpeleta, N., Saggiomo, V., Simis, S.G.H., Stefanova,
999
K., Wilson, C., Lo Martire, M., Greco, S., Cochrane, S.K.J.O. Mangoni, A.Borja, 2016. Implementing and
RI PT
995
Innovating Marine Monitoring Approaches for Assessing Marine Environmental Status. Frontiers in
1001
Marine Science 3, 10.3389/fmars.2016.00213.
1002
Darling, J.A. Mahon, A.R., 2011. From molecules to management: Adopting DNA-based methods for
1003
monitoring biological invasions in aquatic environments. Environmental Research 111, 978-988.
1004
De Jonge, V.N., Elliott, M., Brauer, V.S., 2006. Marine monitoring: its shortcomings and mismatch
1005
with the EU Water Framework Directive's objectives. Marine Pollution Bulletin 53, 5-19.
1006
Deiner, K., Altermatt, F., 2014. Transport Distance of Invertebrate Environmental DNA in a Natural
1007
River. Plos One 9, e88786.
1008
Deiner, K., Bik, H.M., Mächler, E., Seymour, M., Lacoursiere-Rousse, A., Altermatt, F., Creer, S., Bista,
1009
I., Lodge, D.M. de Vere, N., Pfrender, M.E., Bernatchez, L., 2017. Environmental DNA metabarcoding:
1010
Transforming how we survey animal and plant communities. Molecular Ecology 2017, 1-24.
1011
Deiner, K., Fronhofer, E.A., Mächler, E., Walser, J.-C., Altermatt, F., 2016. Environmental DNA reveals
1012
that rivers are conveyer belts of biodiversity information. Nature Comms, 7:12544, DOI: 10.1038.
1013
Deiner, K., Walser, J.-C., Mächler, E., Altermatt, F., 2015. Choice of capture and extraction methods
1014
affect detection of freshwater biodiversity from environmental DNA. Biol. Conserv. 183, 53-63.
1015
Dejean, T., Valentini, A., Miquel, C., Taberlet, P., Bellemain, E., Miaud, C., 2012. Improved detection
1016
of an alien invasive species through environmental DNA barcoding: the example of the American
1017
bullfrog Lithobates catesbeianus. Journal of Applied Ecology 49, 953-959.
AC C
EP
TE D
M AN U
SC
1000
43
ACCEPTED MANUSCRIPT EEA, 2012. European waters - assessment of status and pressures. EEA Report, 8: 100 pp.
1019
Elbrecht, V., Leese, F., 2015. Can DNA-Based Ecosystem Assessments Quantify Species Abundance?
1020
Testing Primer Bias and Biomass-Sequence Relationships with an Innovative Metabarcoding Protocol.
1021
PLOS ONE 10, e0130324.
1022
Elbrecht, V., Leese, F., 2017. Validation and Development of COI Metabarcoding Primers for
1023
Freshwater Macroinvertebrate Bioassessment. Front. Environ. Sci.,
1024
https://doi.org/10.3389/fenvs.2017.00011
1025
Elbrecht, V., Vamos, E.E., Meissner, K., Aroviita, J. Leese, F., 2017. Assessing strengths and
1026
weaknesses of DNA metabarcoding-based macroinvertebrate identification for routine stream
1027
monitoring. Methods Ecol Evol., doi:10.1111/2041-210X.12789.
1028
European Union, 2015. Procedure to fit new or updated classification methods to the results of a
1029
completed intercalibration exercise. CIS Guidance Document 30, European Union, Luxembourg,
1030
29pp.
1031
Ferraro, S.P., Cole, F.A., DeBen, W.A., Swartz, R.C., 1989. Power-Cost Efficiency of Eight Macrobenthic
1032
Sampling Schemes in Puget Sound, Washington, USA. Canadian Journal of Fisheries and Aquatic
1033
Sciences 46, 2157-2165.
1034
Ficetola, G.F., Miaud, C., Pompanon, F., Taberlet., P., 2008. Species detection using environmental
1035
DNA from water samples. Biology Letters 4, 423-425.
1036
Ficetola, G.F., Pansu, J., Bonin, A., Coissac, E., Giguet-Covex, C., De Barba, M., Gielly, L., Lopes, C.M.,.
1037
Boyer, F., Pompanon, F., Rayé, G., Taberlet, P., 2015. Replication levels, false presences and the
1038
estimation of the presence/absence from eDNA metabarcoding data. Molecular Ecology Resources
1039
15, 543-556.
AC C
EP
TE D
M AN U
SC
RI PT
1018
44
ACCEPTED MANUSCRIPT Foden, J., Rogers, S.I., Jones, A.P., 2008. A critical review of approaches to aquatic environmental
1041
assessment. Marine Pollution Bulletin 56, 1825-1833.
1042
Goodwin, K.D., Thompson, L.R., Duarte, B., Kahlke, T., Thompson, A.R., Marques, J.C., Caçador, I.,
1043
2017. DNA Sequencing as a Tool to Monitor Marine Ecological Status. Front. Mar. Sci.,
1044
https://doi.org/10.3389/fmars.2017.00107.
1045
Grossmann, L., Beisser, D., Bock, C., Chatzinotas, A., Jensen, M., Preisfeld, A., Psenner, R., Rahmann,
1046
S., Wodniok, S., Boenigk, J., 2016. Trade-off between taxon diversity and functional diversity in
1047
European lake ecosystems. Molecular Ecology 25, 5876-5888.
1048
Haase, P., Lohse, S., Pauls, S., Schindehütte, K., Sundermann, A., Hering, D. 2004. Development of a
1049
practical standardized protocol for macroinvertebrate sampling and sorting in streams. Limnologica
1050
34, 349-365.
1051
Haase, P., Murray-Bligh, J., Lohse, S., Pauls, S., Sundermann, A., Gunn, R., Clarke, R.T. 2006. Assessing
1052
the impact of errors in sorting and identifying macroinvertebrate samples. Hydrobiologia 566, 505–
1053
521.
1054
Hajibabaei, M., Shokralla, S., Zhou, X., Singer, G.A.C., Baird, D.J., 2011. Environmental Barcoding: A
1055
Next-Generation Sequencing Approach for Biomonitoring Applications Using River Benthos. PLoS
1056
ONE 6, e17497. doi:17410.11371/journal.pone.0017497.
1057
Hallett, C.S., Valesini, F., Elliott, M., 2016. A review of Australian approaches for monitoring, assessing
1058
and reporting estuarine condition: I. International context and evaluation criteria. Environmental
1059
Science & Policy 66, 260-269.
1060
Hanfling B., Handley, L.L., Read, D.S., Hahn, C., Li, J., Nichols, P., Blackman, R.C., Oliver, A., Winfield,
1061
I.J., 2016. Environmental DNA metabarcoding of lake fish communities reflects long-term data from
1062
established survey methods. Molecular Ecology 25, 3101-3119.
AC C
EP
TE D
M AN U
SC
RI PT
1040
45
ACCEPTED MANUSCRIPT Hering, D., Moog, O., Ofenböck, T. & Feld, C.K., 2006. Cook book for the development of a
1064
Multimetric Index for biological condition of aquatic ecosystems: experiences from the European
1065
AQEM and STAR projects and related initiatives. Hydrobiologia 566, 311-324.
1066
Jane, S.F., Wilcox, T.M., McKelvey, K.S., Young, M.K., Schwartz, M.K., Lowe, W.H., Letcher, B.H.,
1067
Whiteley, A.R., 2015. Distance, flow, and PCR inhibition: eDNA dynamics in two headwater streams.
1068
Molecular Ecology Resources 15, 216-227.
1069
Ji, Y., Ashton, L., Pedley, S.S.M., Edwards, D.D.P., Tang, Y., Nakamura, A., Kitching, R., Dolman, P.M.,
1070
Woodcock, P., Edwards, F.A., Larsen, T.H., Hsu, W.W., Benedick, S., Hamer, K.C., Wilcove, D.S., Bruce,
1071
C., Wang, X., Levi, T., Lott, M., Emerson, B.C., Yu, D.W., 2013. Reliable, verifiable and efficient
1072
monitoring of biodiversity via metabarcoding. Ecology Letters 16, 1245–57.
1073
Jones, J.I., Davy-Bowker, J., Murphy, J.F., Pretty, J.L., 2010. Ecological Monitoring and Assessment of
1074
Pollution in Rivers. In: Ecology of Industrial Pollution: Remediation, Restoration and Preservation.
1075
Eds. L.C. Batty & K.B. Hallberg, CUP.
1076
Keck, F., Vasselon, V., Tapolczai, K., Rimet, F., Bouchez, A., 2017. Freshwater biomonitoring in the
1077
Information Age. Frontiers in Ecology and the Environment 15, 266-274.
1078
Kelly, M.G., Bennion, H., Burgess, A., Elllis, J., Juggins, S., Guthrie, R., Jamieson, B.J., Adriaenseens, V.
1079
and Yallop, M.L. 2009. Uncertainty in ecological status assessments of lakes and rivers using diatoms
1080
Hydrobiologia 633, 5-15.
1081
Kelly, M., Boonham, N., Juggins, S., Kille, P., Mann, D., Pass, D., Sapp, M., Sato, S., Glover, R. Walsh,
1082
K., 2017. A DNA based diatom metabarcoding approach for Water Framework Directive classification
1083
of rivers. Science Report SC140024, Environment Agency, Bristol. 151pp.
1084
Kelly, R.P., Port, J.A. Yamahara, K.M., Crowder, L.B., 2014. Using environmental DNA to census
1085
marine fishes in a large mesocosm. Plos One 9, e86175.
AC C
EP
TE D
M AN U
SC
RI PT
1063
46
ACCEPTED MANUSCRIPT Kermarrec, L., Franc, A., Rimet, F., Chaumeil, P., Frigerio, J.M., Humbert, J-F., Bouchez, A., 2014. A
1087
next-generation sequencing approach to river biomonitoring using benthic diatoms. Freshwater
1088
Science 33, 349–363.
1089
Kiranyaz, S., Ince, T., Pulkkinen, J., Gabbouj, M., Ärje, J., Kärkkäinen, S., Tirronen, V., Juhola, M.,
1090
Turpeinen, T., Meissner, K., 2011. Classification and retrieval on macroinvertebrate image databases.
1091
Computers in Biology and Medicine 41, 463-472.
1092
Klymus, K.E., Marshall, N.T., Stepien, C.A., 2017. Environmental DNA (eDNA) metabarcoding assays to
1093
detect invasive invertebrate species in the Great Lakes. PLoS ONE 12, e0177643.
1094
Klymus, K.E., Richter, C.A., Chapman, D.C., Paukert, C., 2015. Quantification of eDNA shedding rates
1095
from invasive bighead carp Hypophthalmichthys nobilis and silver carp Hypophthalmichthys molitrix.
1096
Biological Conservation 183, 77-84.
1097
Konopka, A, Wilkins M. 2012. Application of meta-transcriptomics and -proteomics to analysis of in
1098
situ physiological state. Frontiers in Microbiology 18, 3:184. doi: 10.3389/fmicb.2012.00184.
1099
Lawson Handley, L., 2015. How will the ‘molecular revolution’ contribute to biological recording?
1100
Biological Journal of the Linnean Society 115, 750–766.
1101
Leese, F., Altermatt, F., Bouchez, A., Ekrem, T., Hering, D., Mergen, P., Pawlowski, J., Piggott, J.,
1102
Abarenkov, K., Beja, P., Bervoets, L., Boets, P., Bones, A., Borja, A., Bruce, K., Carlsson, J., Coissac, E.,
1103
Costa, F., Costache, M., Creer, S., Csabai, Z., Deiner, K., DelValls, A., Duarte, S., Fazi, S., Graf, W.,
1104
Hershkovitz, Y., Japoshvili, B., Jones, I., Kahlert, M., Kalamujic Stroil, B., Kelly-Quinn, M., Keskin, E.,
1105
Mächler, E., Mahon, A., Marečková, M., Mejdandzic, M., Montagna, M., Moritz, C., Mulk, V.,
1106
Navodaru, I., Pálsson, S., Panksep, K., Penev, L., Petrusek, A., Pfannkuchen, M., Rinkevich, B.,
1107
Schmidt-Kloiber, A., Segurado, P., Strand, M., Šulčius, S., Traugott, M., Turon, X., Valentini, A., van der
1108
Hoorn, B., Vasquez Hadjilyra, M., Viguri, J., Vogler, A., Zegura, B., 2016. DNAqua-Net: Developing new
AC C
EP
TE D
M AN U
SC
RI PT
1086
47
ACCEPTED MANUSCRIPT genetic tools for bioassessment and monitoring of aquatic ecosystems in Europe. Research Ideas and
1110
Outcomes 2, e11321.
1111
Leese, F., Bouchez, A., Abarenkov, K., Altermatt, F., Borja, A., Bruce, K., Ekrem, T., Čiampor, F. Jr,
1112
Čiamporová-Zaťovičová, Z., Costa, F.O., Duarte, S., Elbrecht, V., Fontaneto, D., Geiger, M.F., Hering,
1113
D., Kahlert, M., Kalamujić Stroil, B., Kelly, M., Keskin, E., Liska, I., Mergen, P., Meissner, K., Pawlowski,
1114
J., Penev, L., Reyjol, Y., Rotter, A., Steinke, D., Vitecek, S., Zimmermann, J., Weigand, A.M., 2018.
1115
Chapter Two - Why We Need Sustainable Networks Bridging Countries, Disciplines, Cultures and
1116
Generations for Aquatic Biomonitoring 2.0: A Perspective Derived From the DNAqua-Net COST
1117
Action. Advances in Ecological Research 58, 63-99.
1118
Lyon, J.P., Bird, T., Nicol, S., Kearns, J., O'Mahony, J., Todd, C.R., Cowx, I.G., Bradshaw, C.J.A., 2014.
1119
Efficiency of electrofishing in turbid lowland rivers: implications for measuring temporal change in
1120
fish populations. Canadian Journal of Fisheries and Aquatic Sciences 71, 878-886.
1121
Medinger, R., Nolte, V.,Vinay Pandey, R., Jost, S., Ottenwälder, B., Schlötterer, C., Boenigk, J., 2010.
1122
Diversity in a hidden world: potential and limitation of next generation sequencing for surveys of
1123
molecular diversity of eukaryotic microorganisms. Mol Ecol 19 (Suppl 1), 32–40.
1124
Mohrbeck, I., Raupach, M.J., Arbizu, P.M., Knebelsberger, T., Laakmann, S., 2015. High-Throughput
1125
Sequencing-The Key to Rapid Biodiversity Assessment of Marine Metazoa? PLOS ONE 10, e0140342.
1126
Mondy, C.P., Villeneuve, B., Archaimbault, V., Usseglio-Polatera, P., 2012. A new macroinvertebrate-
1127
based multimetric index (I2M2) to evaluate ecological quality of French wadeable streams fulfilling
1128
the WFD demands: A taxonomical and trait approach. Ecological Indicators 18, 452-467.
1129
Nathan, L.M., Simmons, M., Wegleitner, B.J., Jerde, C.L., Mahon, A.R., 2014. Quantifying
1130
Environmental DNA Signals for Aquatic Invasive Species Across Multiple Detection Platforms.
1131
Environmental Science & Technology 48, 12800-12806.
AC C
EP
TE D
M AN U
SC
RI PT
1109
48
ACCEPTED MANUSCRIPT Nygård, H., Oinonen, S., Lehtiniemi, M., Hällfors, H., Rantajärvi, E., Uusitalo, L., 2016. Price versus
1133
value of marine monitoring. Frontiers in Marine Science 3, 10.3389/fmars.2016.00205.
1134
Patrício, J., Little, S., Mazik, K., Papadopoulou, K.-N., Smith, C., Teixeira, H., Hoffmann, H., Uyarra, M.,
1135
Solaun, O., Zenetos, A., Kaboglu, G., Kryvenko, O., Churilova, T., Moncheva, S., Bučas, M., Borja, A.,
1136
Hoepffner, N., Elliott, M., 2016. European Marine Biodiversity Monitoring Networks: strengths,
1137
weaknesses, opportunities and threats. Frontiers in Marine Science 3, 10.3389/fmars.2016.00161.
1138
Pilliod, D. S., Goldberg, C.S., Arkle, R.S., Waits, L.P., 2013. Estimating occupancy and abundance of
1139
stream amphibians using environmental DNA from filtered water samples. Canadian Journal of
1140
Fisheries and Aquatic Sciences 70, 1123-1130.
1141
Pinol, J., San Andres, V., Clare, E.L., Mir, G., Symondson, W.O.C., 2014. A pragmatic approach to the
1142
analysis of diets of generalist predators: the use of next-generation sequencing with no blocking
1143
probes. Molecular Ecology Resources 14, 18-26.
1144
Poikane, S., Zampoukas, N., Borja, A., Davies, S.P., van de Bund, W., Birk, S., 2014. Intercalibration of
1145
aquatic ecological assessment methods in the European Union: Lessons learned and way forward.
1146
Environmental Science & Policy 44, 237-246.
1147
Pont, D., Hugueny, B., Beier, U., Goffaux, D., Melcher, A., Noble, R., Rogers, C., Roset, N., Schmutz, S.,
1148
2006. Assessing river biotic condition at the continental scale: a European approach using functional
1149
metrics and fish assemblages. Journal of Applied Ecology 43, 70-80.
1150
Pont D., Rocle, M., Valentini, A., Civade, R., Jean, P., Maire, A., Roset, N., Schabuss, M., Zornig, H. &
1151
Dejean, T., submitted. Environmental DNA reveals quantitative patterns of fish biodiversity in large
1152
rivers despite its downstream transportation. Queiros, A.M., Strong, J.A., Mazik, K., Carstensen, J.,
1153
Bruun, J., Somerfield, P.J., Bruhn, A., Ciavatta, S., Chuševe, R., Nygård, H., Flo, E., Bizsel, N., Ozaydinli,
1154
M., Muxika, I., Papadopoulou, N., Pantazi, M., Krause-Jensen, D., 2016. An objective framework to
AC C
EP
TE D
M AN U
SC
RI PT
1132
49
ACCEPTED MANUSCRIPT test the quality of candidate indicators of good environmental status. Frontiers in Marine Science 3,
1156
DoI: 10.3389/fmars.2016.00073.
1157
Rees, H.C., Maddison, B.C., Middleditch, D.J., Patmore, J.R.M., Gough, K.C.., 2014. The detection of
1158
aquatic animal species using environmental DNA – a review of eDNA as a survey tool in ecology.
1159
Journal of Applied Ecology 51, 1450–1459.
1160
Rimet, F., Chaumeil, P., Keck, F., Kermarrec, L., Vasselon, V., Kahlert, M., Franc, A., Bouchez, A., 2016.
1161
R-syst::diatom: an open-access and curated barcode database for diatoms and freshwater
1162
monitoring. Database 2016, baw016.
1163
Schluter, L., Mohlenberg, F., Kaas, H. (2014) Temporal and spatial variability of phytoplankton
1164
monitored by a combination of monitoring buoys, pigment analysis and fast screening microscopy in
1165
the Fehmarn Belt Estuary. Environmental Monitoring and Assessment 186, 5167-5184. Schmidt-
1166
Kloiber, A., Hering, D., 2015. www.freshwaterecology.info – An online tool that unifies, standardises
1167
and codifies more than 20,000 European freshwater organisms and their ecological preferences.
1168
Ecological Indicators 53, 271–282.
1169
Shaw, J.L.A., Clarke, L.J., Wedderburn, S.D., Barnes, T.C., Weyrich, L.S., Cooper, A., 2016. Comparison
1170
of environmental DNA metabarcoding and conventional fish survey methods in a river system.
1171
Biological Conservation 197, 131-138.
1172
Shokralla, S., Singer, G.A.C., Hajibabaei, M., 2010. Direct PCR amplification and sequencing of
1173
specimens’ DNA from preservative ethanol. BioTechniques 48, 233-234, doi 10.2144/000113362.
1174
Shokralla S., Spall, J.L., Gibson, J.F., Hajibabaei, M., 2012. Next-generation sequencing technologies
1175
for environmental DNA research. Molecular Ecology 21, 1794-1805.
AC C
EP
TE D
M AN U
SC
RI PT
1155
50
ACCEPTED MANUSCRIPT Sigsgaard, E. E., Carl, H., Møller, P. R. & Thomsen, P.F., 2015. Monitoring the near-extinct European
1177
weather loach in Denmark based on environmental DNA from water samples. Biological
1178
Conservation, 183, 46–52.
1179
Smart, A.S., Weeks, A.R., van Rooyen, A.R., Moore, A., McCarthy, M.A., Tingley, R., 2016. Assessing
1180
the cost-efficiency of environmental DNA sampling. Methods in Ecology and Evolution 7, 1291-1298.
1181
Stæhr, P.A., Santos, S., Hansen, L.H., Lundsteen, S., Haraguchi, L., Dahl, K., Ávila, M.P., Winding, A.,
1182
2016. Comparison of eDNA and conventional techniques for monitoring species diversity of boulder
1183
reefs in Danish waters. DCE - Danish Centre for Environment and Energy. Aarhus University, 22 pp.
1184
Stein, E.D., Martinez, M.C., Stiles, S., Miller, P.E., Zakharov, P.E., 2014. Is DNA Barcoding Actually
1185
Cheaper and Faster than Traditional Morphological Methods: Results from a Survey of Freshwater
1186
Bioassessment Efforts in the United States? PLoS ONE 9, e95525.
1187
Stoeckle, M.Y., Soboleva, L., Charlop-Powers, Z., 2017. Aquatic environmental DNA detects seasonal
1188
fish abundance and habitat preference in an urban estuary. PLoS ONE 12, e0175186.
1189
Sweeney, B.W., Battle, J.M., Jackson, J.K., Dapkey, T., 2011. Can DNA barcodes of stream
1190
macroinvertebrates improve descriptions of community structure and water quality? J. N. Am.
1191
Benthol. Soc. 30(1), 195-216.
1192
Taberlet, P., Coissac, E., Hajibabaei, M., Rieseberg, L.H., 2012a. Environmental DNA. Molecular
1193
Ecology 21, 1789-1793.
1194
Taberlet, P., Coissac, E., Pompanon, F., Brochmann, C., Willerslev, E., 2012b. Towards next-
1195
generation biodiversity assessment using DNA metabarcoding. Molecular Ecology 21, 2045-2050.
1196
Takahara, T., Minamoto, T., Yamanaka, H., Doi, H., Kawabata, Z., 2012. Estimation of fish biomass
1197
using environmental DNA. Plos One 7,, e35868.
AC C
EP
TE D
M AN U
SC
RI PT
1176
51
ACCEPTED MANUSCRIPT Thomsen, P.T., Møller, P.R., Sigsgaard, E.E., Knudsen, S.W., Jørgensen, O.A., Willerslev, E., 2016.
1199
Environmental DNA from Seawater Samples Correlate with Trawl Catches of Subarctic, Deepwater
1200
Fishes. PLoS ONE 11, e0165252. doi:10.1371/journal.pone.0165252
1201
Thomsen, P. F., J. Kielgast, L. L. Iversen, P. R. Moller, M. Rasmussen, E. Willerslev, 2012. Detection of
1202
a Diverse Marine Fish Fauna Using Environmental DNA from Seawater Samples. Plos One 7, e4173.
1203
Valentini, A., Taberlet, P., Miaud, C., Civade, R., Herder, J., Thomsen, P. F., Bellemain, E., Besnard, A.,
1204
Coissac, E., Boyer, F., Gaboriaud, C., Jean, P., Poulet, N., Roset, N., Copp, G.H., Geniez, P., Pont, D.,
1205
Argillier, C., Baudoin, J.-M., Peroux, T., Crivelli, A.J., Olivier, A., Acqueberge, M., Le Brun, M., Møller,
1206
P.R., Willerslev, E., Dejean, T., 2016. Next-generation monitoring of aquatic biodiversity using
1207
environmental DNA metabarcoding. Molecular Ecology 25, 929-942.
1208
Vasselon, V., Rimet, F., Tapolczai, K., Bouchez, A., 2017. Assessing ecological status with diatom DNA
1209
metabarcoding: scaling-up on a WFD monitoring network (Mayotte Island, France). Ecological
1210
Indicators 82, 1-12.
1211
Wilcox, T.M., McKelvey, K.S., Young, M.K.,Sepulveda, A.J., Shepard, B.B., Jane, S.F., Schwartz, M.K.,
1212
2016. Understanding environmental DNA detection probabilities: a case study using a stream-
1213
dwelling char Salvelinus fontinalis. Biological Conservation 194, 209-216.
1214
Yamamoto, S., Masuda, R., Sato, Y., Sado, T., Araki, H., Kondoh, M., Minamoto, T., Miya, M., 2017.
1215
Environmental DNA metabarcoding reveals local fish communities in a species-rich coastal sea.
1216
Scientific Reports | 7:40368 | DOI: 10.1038/srep40368.
1217
Zimmermann, J., Glockner, G., Jahn, R., Enke, N., Gemeinholzer, B., 2015. Metabarcoding vs.
1218
morphological identification to assess diatom diversity in environmental studies. Molecular Ecology
1219
Resources 15, 526-542.
AC C
EP
TE D
M AN U
SC
RI PT
1198
1220 1221
52
M AN U
SC
RI PT
ACCEPTED MANUSCRIPT
1222
Figure 1: Rating of the criteria for different BQEs and water categories. Large circles = high suitability
1224
of DNA-based identification; mid-sized circles = medium suitability; small circles = low suitability; N/A
1225
= not applicable. TRaC: Transitional and Coastal waters.
EP
1227
AC C
1226
TE D
1223
53
ACCEPTED MANUSCRIPT
RI PT SC M AN U TE D
•
EP
• • •
eDNA and metabarcoding are options for complementing and replacing morphological identification These methods are differently well suited for assessing Biological Quality Elements (BQEs) eDNA is well suited for assessing the fish fauna Remaining challenges for all BQEs include the modification of assessment indices and completing barcode libraries Methods are least suited for BQEs that are surveyed rather than sampled (e.g. macrophytes)
AC C
•