The current issue and full text archive of this journal is available at www.emeraldinsight.com/1756-378X.htm
Improved biclustering on expression data through overlapping control Beatriz Pontes Department of Computer Science, University of Seville, Seville, Spain, and
Federico Divina, Rau´l Gira´ldez and Jesu´s S. Aguilar-Ruiz School of Engineering, Pablo de Olavide University, Seville, Spain
Improved biclustering on expression data 477 Received 7 November 2008 Revised 10 December 2008 Accepted 15 December 2008
Abstract Purpose – The purpose of this paper is to present a novel control mechanism for avoiding overlapping among biclusters in expression data. Design/methodology/approach – Biclustering is a technique used in analysis of microarray data. One of the most popular biclustering algorithms is introduced by Cheng and Church (2000) (Ch&Ch). Even if this heuristic is successful at finding interesting biclusters, it presents several drawbacks. The main shortcoming is that it introduces random values in the expression matrix to control the overlapping. The overlapping control method presented in this paper is based on a matrix of weights, that is used to estimate the overlapping of a bicluster with already found ones. In this way, the algorithm is always working on real data and so the biclusters it discovers contain only original data. Findings – The paper shows that the original algorithm wrongly estimates the quality of the biclusters after some iterations, due to random values that it introduces. The empirical results show that the proposed approach is effective in order to improve the heuristic. It is also important to highlight that many interesting biclusters found by using our approach would have not been obtained using the original algorithm. Originality/value – The original algorithm proposed by Ch&Ch is one of the most successful algorithms for discovering biclusters in microarray data. However, it presents some limitations, the most relevant being the substitution phase adopted in order to avoid overlapping among biclusters. The modified version of the algorithm proposed in this paper improves the original one, as proven in the experimentation. Keywords Programming and algorithm theory, Data structures, Genes Paper type Technical paper
1. Introduction By measuring the expression level of a large number of genes (from the same organisms or from different ones), under different experimental conditions (different environments, individuals, time series, different cells, etc.), it is possible to analyze the behavior of the genes. The expression level of a gene is the measurement of the activity of the gene. Generally, the expression level of a gene measures the relative amount of mRNA expressed under an experimental condition. This analysis allows discovering or justifying certain biological phenomena (Harpaz and Haralick, 2006). This research is supported by the Spanish Ministry of Science and Technology under grant TIN2007-68084-C02-00 and the Junta de Andalucı´a Research Program.
International Journal of Intelligent Computing and Cybernetics Vol. 2 No. 3, 2009 pp. 477-493 q Emerald Group Publishing Limited 1756-378X DOI 10.1108/17563780910982707
IJICC 2,3
478
The use of microarray techniques allows to measures the expression levels of thousands of genes under several experimental conditions. Usually, the resulting data is organized in a matrix, where, e.g. columns may represent genes and rows represent conditions (Baldi, 2002; Tilstone, 2003). Such a matrix is called an expression matrix. Therefore, each entry of the matrix denotes the numerical expression level of a gene under a certain experimental condition. With the development of microarray techniques, the interest in extracting useful knowledge from gene expression data has experimented an enormous increase. Various machine learning techniques have been applied successfully to this context (Piatetsky-Shapiro et al., 2003). Clustering has been extensively applied to expression matrices, with the aim of discovering groups of genes that present a similar behaviour, in terms of variations of expression level, under all the experimental conditions (Tamayo et al., 1999; Ben-Dor et al., 1999; Yin et al., 2006). However, there may be genes that present a similar behavior only under a subset of conditions. So it is necessary to address the clustering problem not only in one dimension (genes), but in two dimensions simultaneously. This motivated the development of biclustering algorithms for solving this problem (Hartigan, 1972). The first application of biclustering to microarray analysis was proposed by Cheng and Church (Ch&Ch) (2000). Biclustering aims at grouping genes presenting similar trends under a subset of experimental conditions. In this way, a bicluster represents a submatrix of the expression matrix. From the biological point of view, biclustering is a very interesting technique, as it is possible to discriminate groups of conditions by using different groups of genes. Biclustering has been proven to be much more complex than clustering (Divina and Aguilar-Ruiz, 2006). Two key factors have influenced the biclusters searching problem: the definition of a measure that assigns a value of quality to the potential biclusters and the development of a suitable heuristic. The mean squared residue (henceforth MSR; Ch&Ch, 2000) is an example of a quality measure for biclusters. MSR has turned into one of the most popular measures, and it has been used by many researches who have proposed different heuristics for biclustering biological data (Divina and Aguilar-Ruiz, 2006; Bryan and Cunningham, 2007; Aguilar-Ruiz et al., 2006; Yang et al., 2005; Cho et al., 2004). Ch&Ch also proposed a heuristic for discovering biclusters using MSR. This heuristic is described in the following sections. In this work, a particular emphasis is placed on the heuristic proposed in the biclustering algorithm. The exhaustive search of all the biclusters in a microarray corresponds to an exponential order, regarding the number of genes and conditions. Therefore, it is necessary to develop an approximate heuristic which finds good solutions, even if these may be not the optimal ones. Ch&Ch proposed a sequential covering algorithm. Although this approach is one of the main references for many researchers, it has several shortcomings. Such drawbacks are analyzed in Section 2 and represent the main motivations for this work. Experiments show that the original algorithm proposed in Ch&Ch (2000) returns biclusters whose MSR is not the one computed by the algorithm, due to the presence of random values in the expression matrix. Our proposal does not present such a drawback. This paper is organized as follows. In Section 2, we describe the algorithm proposed in Ch&Ch (2000) and analyze its shortcomings. Section 3 describes our proposal. Experiments and conclusions are described in Sections 4 and 5, respectively.
2. Cheng and Church approach As already mentioned, the original algorithm of Ch&Ch (2000) adopts a sequential covering algorithm in order to return a list of n biclusters from an expression data matrix. In order to assess the quality of a biclusters the algorithm adopts MSR. This measure aims at evaluating the coherence of the genes and conditions of a bicluster B consisting of I rows and J columns. MSR is defined as: i¼I X 1 X ðeij 2 eiJ 2 eIj þ eIJ Þ2 I · J i¼1 j¼1
479
j¼J
MSRðBÞ ¼
ð1Þ
where eij, eiJ, eIj and eIJ represent the element in the ith row (condition) and jth column (gene), the row and column means and the mean of B, respectively. The lower the MSR, the stronger the coherence exhibited by the bicluster and the better the quality of the bicluster. If a bicluster has a MSR lower than a given value d, then we call the bicluster a d-bicluster. It follows that the smaller the value of MSR, the better the bicluster is considered. If a bicluster has a MSR equal to zero, it means that its genes fluctuate in exactly the same way under the subset of experimental conditions and thus, it can be considered a perfect bicluster. Algorithm 1 shows a scheme of Ch&Ch. The algorithm takes as input the expression matrix EM and the threshold d imposed on MSR. d is used to reject non d-biclusters. A list L of d-biclusters is returned as output: Algorithm 1. Ch&Ch’s original algorithm Input: Expression Matrix EM; Thresholds d Output: List of Biclusters L 1 preprocess the missing values of EM 2 list L ¼ Y 3 Bicluster B 4 repeat n times 5 B ¼ EM 6 Bd ¼ multiple node deletion phase(B,d) 0 7 Bd ¼ simple node deletion phase(B,d) 00
Improved biclustering on expression data
0
8 Bd ¼ addition phase(Bd ) 00 9 L ¼ L%Bd 00 10 substitution phase(Bd , EM ) 11 end_repeat 12 return L After preprocessing the missing values of EM by replacing them with random numbers (line 1) and initializing the list of bicluster (line 2), the bicluster discovering process is repeated n times (lines 5-11). First, the bicluster B is initialized to the whole matrix EM. Next, the multiple node deletion phase (line 6) produces a d-bicluster Bd. This phase is based on the elimination of those rows or columns whose residue is higher than a certain value, depending on the MSR of the current matrix. Later, the single node deletion phase (line 7) removes the row or column from Bd with the higher 0 residue and returns0 Bd . Next, the node addition phase (line 8) tries to enlarge the current bicluster Bd . This is done by adding those columns and rows that do not
IJICC 2,3
480
00
increase the residue of the matrix above the threshold d. The obtained bicluster Bd is stored in the list L (line 9). Finally, the substitution phase (line 10) replaces the elements 00 of EM that are contained in Bd with random numbers. This substitution is applied in order to prevent overlapping among biclusters, since it is very unlikely that elements covered by existing biclusters would contribute to any future bicluster discovery (Ch&Ch, 2000). This strategy succeeds in avoiding the overlapping, however it presents two main drawbacks: (1) As biclusters are discovered, more and more elements of the original expression matrix are lost, since they are substituted with random values. It follows that the expression matrix the algorithm is working on contains more and more random values as biclusters are being discovered. As a consequence, the algorithm may return biclusters that are obtained using random values, whereas these random values will be later replaced by the original ones. Moreover, in this way some biclusters might not be found. For instance, if gene j and condition i are contained in a bicluster B, the element eij is substituted by a random value in the expression matrix. This may prevent gene i to be included in other biclusters under the same condition j, even if it could have improved the quality of the bicluster, since some of its original expression values have been substituted by random values. In general, it is desirable to avoid overlapping among biclusters, but not at the cost of loosing possible important interactions among genes. (2) During the execution of the algorithm, the MSR value of the biclusters considered has to be computed. If a bicluster contains random values its computed MSR is not real, since it is influenced by the presence of random values. This has a negative influence of the overall search process, since the algorithm cannot compute the real values of MSR for some biclusters. After having performed a number of experiments, we have found that the percentage of random numbers present in the EM can be very high during the execution of the algorithm. For example, for one of the datasets used in the experiments presented in this paper (yeast dataset (Cho et al., 1998)), we found that after 80 biclusters had been discovered, up to 50 per cent of the elements of EM had been replaced by random values. Another point that has to be considered is that Ch&Ch makes use of a threshold d in order to reject biclusters: biclusters with MSR higher than d are rejected. However, if some elements of the biclusters are random, the MSR of this biclusters might be higher that d, and thus be rejected. But again the MSR is influenced by the presence of random values. The MSR of the same bicluster with the original elements is different and could therefore be lower than d. Also the opposite case may arise, i.e. a bicluster with estimated MSR lower than d is accepted, but when the original values are used instead of the random ones, the MSR might increase to a level higher than d. In this last case the bicluster should have been rejected. Equation (2) shows an example of such a situation. The bicluster represented in the equation has a MSR ¼ 259.47. If the element shown in bold were a random value and the original value were 153 the MSR of the bicluster would drop to 0 when the MSR is computed with the original value. If a d equal to, e.g. 100 were used, the bicluster depicted in equation (2) would be rejected, even if with the original values it represents a perfect bicluster:
0
53
B 122 B B B B ¼ B 55 B B 73 @ 140
8
65
77
134
10
67
28
85
95
152
84
1
60 C C C 86 C C C 104 C A 171
ð2Þ
The above considerations clearly show that the replacement strategy adopted by Ch&Ch may, on one hand, prevent the discovering of interesting biclusters, or, on the other hand, yields the algorithm towards the discovering of biclusters considered to be interesting only because of random values they contain. This clearly illustrates the limitations of the replacement policy adopted by Ch&Ch. These considerations represent our main motivations for the work presented in this paper. 3. Controlling the overlap among biclusters In this section, we describe the variations we incorporated to Ch&Ch. We call the resulting algorithm – Ch&Ch-R. The main variation is represented by the removal of the substitution phase used in the original algorithm (line 10 in Algorithm 1) and the incorporation of an overlapping control mechanism. Since, in Ch&Ch-R elements contained in already found biclusters are not replaced by random values, a deterministic version of Ch&Ch would always find the same bicluster. Therefore, our proposal includes a different heuristic, consisting of some variations in order to render Ch&Ch-R non-deterministic. 3.1 Overlapping control mechanism Given an expression matrix EM, we say that two biclusters B1 and B2 are overlapped if there is at least one element eij [ EM such that eij [ B1 and B2. By controlling the level of overlapping among biclusters, we can decide whether a bicluster may be considered as a significative one, with respect to its overlapping percentage with the previously found biclusters. In our approach, we control the overlapping by means of a matrix of weights W, in a similar way to the approach adopted in Divina and Aguilar-Ruiz (2006). W has the same dimension of the original expression data matrix, so that each element w(eij) [ W represents a weight associated with eij [ EM. Initially all the elements of W are equal to zero, i.e. w(eij) ¼ 0, ; i, j. Each time a bicluster B is stored in the list L, w(eij) is increased by one if eij [ B. So, basically, w(eij) indicates how many biclusters in L contains element eij. It follows that this matrix can be used to measure the overlapping of a new bicluster. We define the degree of overlapping of a bicluster B as: P wðeij Þ eij [B
PðBÞ ¼
V ðBÞ
where V(B) is the volume of a bicluster B. P(B) will be high for a bicluster whose elements are already contained in the previously found biclusters. Since we aim at avoiding overlapping as much as possible, P(B) can be used, in combination with MSR, in order to reject biclusters. In order to do this, we need to
Improved biclustering on expression data 481
IJICC 2,3
482
define a criterion for establishing if P(B) is to be considered high. 0 # P(B) # nb, where nb is the number of biclusters found so far. Thus, the upper limit of P(B) will be different in each iteration of the algorithm. In order to use P(B) for rejecting biclusters in different iterations, it is convenient that the range of values P(B) can assume is always the same in all iterations. For this purpose in equation (3) we define the overlapping factor of a bicluster for the iteration nb: P P nb ðBÞ ¼
wðeij Þ
i;j[B
V ðBÞ £ nb
ð3Þ
Notice that Pnb(B) [ [0,1], ; nb. In this way, we can use Pnb(B) to reject a bicluster B if Pnb(B) is higher than a certain threshold v. Moreover, biclusters found in later iterations are allowed to have more elements in common with biclusters stored in L. This is because Pnb(B) tends to be smaller as nb increases. In other words, the biclusters with high overlapping are penalized more in the first iterations. By setting the overlapping threshold v, the user can decide the level of overlapping among the biclusters. In our experiments, we have used threshold v ¼ 0.5. This value was experimentally obtained after several trial runs of the algorithm with different v.
3.2 Re-adaptation of Ch&Ch algorithm As already mentioned, the removal of the substitution phase discussed in Section 2 and the fact that Ch&Ch is a deterministic algorithm, implies that the algorithm will produce always the same bicluster. Therefore, we need to introduce other modifications in order to render the algorithm non-deterministic. To this aim, we propose the following variations: (1) The substitution phase has been replaced by the overlapping control mechanism. This mechanisms allows to reject biclusters with overlapping factors higher than v and updates the matrix of weights W. (2) Multiple node deletion phase has been redefined in terms of the selection of the rows or columns to be deleted from the bicluster. Removing first those rows or columns that produce more overlapping with previous biclusters speeds up the convergence of the algorithm. The selection of the rows and columns is done using the matrix of weights W. (3) The selection mechanism for the columns or rows to be added in the node addition phase has been also redefined. Those columns or rows that are less overlapped with previously found biclusters are selected first, provided that their addition do not increase the matrix residue above d. As in the previous variation, this selection is also based on W. The redefinition of the node addition phase aims at finding biclusters with a low-overlapping degree. (4) Finally, the initial bicluster is randomly determined from the original microarray, with the exception of the first iteration where the initial bicluster is the whole matrix, as in Ch&Ch.
The pseudocode of the resulting algorithm Ch&Ch-R, is shown in Algorithm 2: Algorithm 2. Ch&Ch-R algorithm Input: Expression Matrix EM; Thresholds d and v Output: List of Biclusters L 1 preprocess the missing values of EM 2 list L ¼ Y 3 nb ¼ 1 4 Matrix of Weight W ¼ 0 5 Bicluster B ¼ EM 6 while nb ,¼ n (number of biclusters) 7 Bd ¼ multiple node deletion phase(B,d,W) [re-adapted] 8
0
Bd ¼ simple node deletion phase(Bd,d) 00
0
9 Bd ¼ addition phase(Bd , W ) [re-adapted] 00 10 if P(Bd ) , ¼ v 11 nb ¼ nb þ 1 00 12 L ¼ L%Bd 13 ; i, j 00 14 if eij [ Bd 15 wij þ 1 16 end_if 17 B ¼ random selection (EM) 18 end_while 19 return L After preprocessing the missing values of EM, as explained in Section 4, the variables L (list of biclusters), nb (counter for the loop or number of biclusters found), W (matrix of weight) and B (initial bicluster) are initialized. Notice that in the first iteration, the bicluster B is initialized to the whole matrix EM (line 5), in order to take into account the whole set of genes and experimental conditions. Next, the while-loop is executed, where the three first phases (lines 7-9) are the re-adapted multiple node deletion phase, simple node deletion phase and re-adapted addition0 phase, respectively. These steps 00 always produce d-biclusters, that is MSR(Bd), MSR(Bd ) and MSR(Bd ) are smaller that d. Notice that single node deletion (line 8) phase is always deterministic, since the selection of the row or column to be removed depends on their residues. Therefore, there is no00 adaptation of this phase in our proposal. Once Bd is returned by the re-adapted addition phase, the overlapping control 00 method is performed. If the overlapping factor of the bicluster PðBd Þ does not exceed the threshold v, then nb is increased, the bicluster is included in the list L and W is 00 updated (lines 13-15). If eij [ EM belongs to Bd then the element wij [ W is increased 00 by one. If, on the other hand, the overlapping factor is above v, the bicluster Bd is rejected, because it has too many common elements with the biclusters previously found. Finally, a new bicluster B is randomly generated from the original dataset EM to be used in the next iteration. The dimension of B is randomly chosen, as well as the specific genes and conditions belonging the bicluster. In the original algorithm, each iteration starts from the whole matrix EM, modified from the last iteration by the
Improved biclustering on expression data 483
IJICC 2,3
484
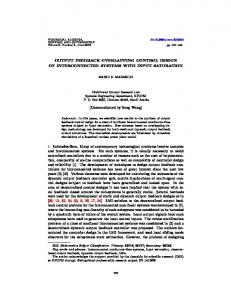
substitution phase. However, different experiments showed that starting from a random bicluster produced better results. Figures 1 and 2 show the flow charts of the re-adapted multiple node deletion phase and addition phase, respectively. As can be seen in Figure 1, multiple row/column deletion is only performed if the number of rows/columns is greater than 100. The way in which rows are chosen to be deleted is shown in the right flow chart in Figure 1 (deleteMultipleRows). Columns are deleted in a similar way. Multiple node deletion phase ends up once the bicluster has a lower value of MSR than the limit or the bicluster does not change after multiple rows and columns deletion. Figure 2 depicts the re-adapted addition phase. This phase iteratively add multiple rows, columns and inverse rows until no addition is performed. The way in which multiple rows are added to the bicluster can be seen in the right flow chart of the figure. Multiple columns are added in a similar way. Inverse rows are added in the same way as in the original Ch&Ch algorithm. 4. Experiments In order to test our proposal we conducted experiments on three datasets: (1) Yeast Saccharomyces cerevisiae cell cycle expression dataset originated from Cho et al. (1998). This datasets consists of 2,884 genes and 17 conditions. (2) Human B-cells expression data originated from Alizadeh et al. (2000). The human dataset consists of an expression matrix of 4,026 genes and 96 conditions.
Cont ← 0
Rows(B)>100 Yes
Cont < rows
ComputeMSR (B)
No
No
Yes
MSR(B)>δ Yes
Nextrow ← mostOverlappedRow (B,W)
deleteMultipleRows rowMSR (nextrow) > α∗ MSR
No No
Compute (B)>100 Yes No
Yes deleteRow (nextrow, B)
ComputeMSR (B) Cont ← cont +1
deleteMultipleColums Yes Deletion?
Figure 1. Flow chart representing the re-adapted multiple node deletion phase
Return B
No Return B
Multiplenode deletion phase (re-adapted)
deleteMultipleRows
Improved biclustering on expression data
Cont ← 0 ComputeMSR (B)
Cont < rows (not in B) No Yes
addMultipleColumns
485
nextRow ← lessOverlappedRow (B,W)
computeMSR (B) rowMSR (nextRow) ≤ MSR addMultipleRows
No
Yes
addInverseRows
addRow (nextRow,B)
Addition?
Cont ← cont +1
Yes No
Figure 2. Flow chart representing the re-adapted addition phase
Return B Return B Addition phase (re-adapted)
addMultipleRows
(3) Colon cancer dataset. This dataset originated from Cho et al. (1998) and contains an expression matrix consisting of 2,000 genes and 62 conditions. All these datasets were preprocessed as in Ch&Ch (2000). The most important preprocessing operation regards missing values: missing values are replaced with random values, although it is known the existing risk that these random numbers can affect the discovery of biclusters (Yang et al., 2002). The expectation was that these random values would not form recognizable patterns. Table I shows the most relevant characteristic for each dataset. The first two columns show the number of genes and conditions, respectively. The third column shows the values of the d limit that has been used. In the case of the yeast and human datasets they were taken from the original work (Ch&Ch, 2000), while for the other dataset we have established the value of d following a procedure suggested in such a reference. For each dataset, we have obtained 100 biclusters, using both the Ch&Ch and Ch&Ch-R. It is important to notice that most of the biclusters found with the last algorithm would have not been obtained using the original Ch&Ch, since we have eliminated the substitution phase. In fact, this phase masked the values contained in each bicluster by introducing random numbers. Dataset
Number of genes
Number of conditions
d
Yeast Human Colon
2,884 4,096 2,000
17 96 62
300 1200 500
Table I. Main information for each dataset
IJICC 2,3
486
Both algorithms have been implemented in the Java language, 1.6 version. All the experiments were carried out in an Intel Core 2Quad CPU running at 2.40 GHz, with 4 GB of RAM. Tables II and III show the average results (and their standard deviations in brackets) obtained on each dataset (in columns) by the two algorithms, Ch&Ch and Ch&Ch-R, respectively. The first row gives the average MSR, the second row in Table II shows the mean of the real MSR, i.e. when the MSR is calculated using the original values, and not the random values introduced in the substitution phase. These real MSR values have been calculated for each bicluster once the random values are substituted with the original ones. Table III lacks of this row since there no random values are introduced in the expression matrix by Ch&Ch-R. The row labelled GeneVarMean shows the gene variance. Next row (Overlap) represents the average overlapping for each bicluster with all the previous ones. Note that in Table II this value also represents the mean number of random values that have been used in the algorithm. This is because values that are contained in more than a bicluster have been substituted with random values. Finally, rows GenesMean and CondsMean show the mean of the number of genes and conditions. Furthermore, in order to statistically validate the results, we applied the Student’s t-test. Using a confidence level of 0.5 per cent, we can conclude that all the differences of results shown in Tables II and III are statistically significant. From these tables, it is evident that the random values introduced in the expression matrix during the substitution phase negatively affect Ch&Ch. In fact, the MSR computed considering the original values is, on average, higher than the specified d. This means that many of the biclusters returned by the algorithm are not d-biclusters, which is in contradiction with the specification of the algorithm. This fact is Yeast
Table II. Ch&Ch average results for each dataset
MSR MSR (real) GeneVarMean Overlap (%) GenesMean CondsMean
124.80 498.46 836.36 42.94 219.47 7.25
(72.86) (306.08) (456.27) (36.30) (309.99) (3.42)
Colon
857.01 (107.99) 9,940.90 (8,381.73) 10,985.36 (8,780.13) 49.53 (23.62) 271.52 (234.25) 14.70 (12.26)
389.02 (76.99) 2,159.61 (13,343.43) 5,929.48 (16,066.57) 9.26 (18.40) 21.89 (22.12) 8.81 (7.24)
Note: Standard deviation is given in parentheses
Yeast
Table III. Ch&Ch-R average results for each dataset
Human
MSR GeneVarMean Overlap (%) GenesMean CondsMean Overlap2Bics (%)
225.138 (24.85) 334.02 (84.33) 94.55 (12.21) 758.18 (212.89) 8.59 (2.47) 30.1 (17.58)
Note: Standard deviation is given in parentheses
Human 1,109.94 1,432.11 91.21 134.53 45.66 25.23
(21.09) (101.06) (13.45) (17.34) (7.41) (0.39)
Colon 435.31 742.64 94.81 134.48 24.80 33.94
(13.84) (13.99) (12.15) (18.15) (4.44) (0.65)
particularly evident for the human and the colon datasets, where the average real MSR is about eight and four time higher, respectively, than the d used for these datasets. On the other hand, all the biclusters obtained by Ch&Ch-R are d-biclusters and the average MSR is much lower than the real MSR of the biclusters found by Ch&Ch. These results alone show the limitations of the substitution phase adopted in Ch&Ch. This substitution phase is effective for avoiding overlapping among biclusters, as it can be noticed by the overlapping percentages shown in Table II. However, this effectiveness is obtained at the cost of possibly producing biclusters that are not d-biclusters. As far as the gene variance is concerned, it can be noticed that, in general, Ch&Ch obtained better results. However, this result is influenced by the fact that MSR is much higher for the biclusters discovered by Ch&Ch. In general, biclusters with lower MSR have also a lower gene variance and this explain the lower average gene variance for the biclusters obtained by Ch&Ch-R. Biclusters found by Ch&Ch-R are characterized by a higher volume, even if the average MSR of the biclusters is lower than the MSR of biclusters found by Ch&Ch. This is due to the overlapping policy adopted by Ch&Ch. In fact, the random values introduced causes biclusters found in later iterations of the algorithm to have a very low volume. This is because random values are in general not included in biclusters, since they introduce noise that would cause the genes not be coherent under some conditions. Table III contains an additional row, named Overlap2Bics, which represents the average percentages of overlapped values between every pair of biclusters, for each dataset. Note that these amounts are considerably lower than the overlapping percentage of the whole set of biclusters (row overlap). In the following, we analyze the obtained results for each dataset individually. These results have been generated using the Ch&Ch-R approach. 4.1 Yeast S. cerevisiae cell cycle expression dataset The application of the algorithm to this dataset produces big biclusters, compared to the other two datasets. This is due to the intrinsic characteristics of the microarray, since genes contained in it are mostly flat, that is with low row variance (Ch&Ch, 2000; Divina and Auilar-Ruiz, 2006). For this reason, the mean number of genes contained in the obtained biclusters is about 750. The number of conditions in the biclusters is about nine on average, which means that the algorithm works well at discriminating some experimental conditions for each bicluster. As the algorithm produces big biclusters, the existence of a certain overlapping percentage among them is inevitable. Nevertheless, by analyzing the results, we have discovered that the overlapping percentage between two average-size biclusters does not exceed 50 per cent. Naturally, the bigger a bicluster is, the higher the percentage of overlapping. A special case of this situation is the first obtained bicluster which is specially big, since its overlapping percentage is always 0. Figure 3 shows two biclusters found on the yeast dataset. The graph presented, is the most commonly used representation of a bicluster. In such a graph, each line is relative to the expression level that a given gene assume under a particular experimental condition. For each bicluster, there are three pictures in the same column. The first one corresponds to the full obtained bicluster. The second and third ones
Improved biclustering on expression data 487
IJICC 2,3
Expression value
500 Expression value
488
bi 0
600 400 300 200 100 0 –100
0
2
4
6
8
10 12 14 16
500 450 400 350 300 250 200 150 100 50 0 –50
bi 75
0
2
4
Conditions bi 0
600
Expression value
Expression value
500 400 300 200 100 0 –100
0
2
4
6 8 10 12 14 16 Conditions
Expression value
Expression value
500 400 300 200 100 0
Figure 3. Examples of biclusters found on the yeast dataset
0
2
4
6
8
10 12 14 16
8
10
12
450 400 350 300 250 200 150 100 50 0
8
10
12
8
10
12
bi 75
0
2
4
6 Conditions
bi 0
600
6 Conditions
450 400 350 300 250 200 150 100 50 0
bi 75
0
2
4
6
Conditions Conditions Notes: Each column shows three pictures of the same bicluster: full bicluster, 20 and 10 percent of the genes, respectively; X-axis represents each of the experimental conditions in the bicluster, while Y-axis represents the expression level of the genes in each bicluster
correspond to the 20 per cent and 10 per cent of the genes in the original bicluster, respectively. These two not-complete biclusters are presented in order to visualize and test the quality of the original ones, since it is difficult to deduce genes shapes in such a big bicluster. These genes have been selected sequentially among the genes in the whole bicluster. The first gene out of each ten sequentially selected genes have been obtained for the 10 per cent case and the first gene out of five sequentially selected genes have been selected for the 5 per cent case. As aforementioned, gene expressions in yeast dataset show flatter tendencies than in the other datasets. For this reason, the obtained biclusters contain a big amount of genes and they can be hardly analyzed by their graphical representation. Nevertheless, the representation of a certain percentage of the original biclusters proves that genes show a certain correlation among them.
In this sense, we have obtained some quality biclusters that would have not been found by the original Ch&Ch, since masking the values of a found bicluster with random ones prevents finding lots of real biclusters.
200 150 100 50 0 –50 –100 –150 –200
bi 0 Expression value
Expression value
4.2 Human B-cells expression data Biclusters found on the human dataset are significantly smaller than the ones discovered from the yeast dataset. The mean of the number of genes in the biclusters is about 135. This result is accentuated even more by the fact that the expression matrix relative to human dataset is bigger than that of the yeast dataset. The main reason for this situation is the intrinsic characteristics within the datasets. Genes in human dataset do not present such a flat behavior as in the yeast dataset. On the contrary, gene expression varies significantly among the different experimental conditions. The average of the number of conditions for biclusters on human dataset is about 45, almost the 50 per cent of the total number of conditions. Again, the first bicluster presents the highest volume, since its overlapping percentage is always 0. This bicluster contains 83 genes and 96 conditions, which represents the whole set of experimental conditions. Therefore, it is one of the most overlapped biclusters. Nevertheless, the amount of overlapping between two medium-sized biclusters does not exceed 30 per cent. Figure 4 represents four biclusters of the 100 found for this dataset. We can appreciate in these pictures that genes in the same bicluster are strongly correlated. Their expression levels vary in unison under the same subset of conditions. Furthermore, the expression levels of the genes are within the same range of values, for this reason all of them are grouped and it is difficult to differentiate each gene.
0 10 20 30 40 50 60 70 80 90
200 150 100 50 0 –50 –100 –150
200 150 100 50 0 –50 –100 –150 –200
bi 41
0
489
bi 15
0
10
20
30
40
50
Conditions
Expression value
Expression value
Conditions
Improved biclustering on expression data
200 150 100 50 0 –50 –100 –150 –200
bi 77
5 10 15 20 25 30 35 40 45 0 5 10 15 20 25 30 35 40 45 Conditions Conditions Notes: X-axis represents each of the experimental conditions in the bicluster, while Y-axis represents the expression level of the genes in each bicluster
Figure 4. Examples of biclusters found on the human dataset
IJICC 2,3
490
4.3 Colon cancer dataset Colon cancer dataset consists of 2,000 genes and 62 conditions. The mean number of genes in the biclusters for this dataset is 135, while the mean number of conditions is 25. In this case, biclusters contain almost the same number of genes as those obtained from the human dataset. Considering the volume of both datasets, biclusters from colon dataset are expected to be more overlapped among them. In fact, this dataset produces biclusters with a mean of 40 per cent of common values between two given biclusters. Figure 5 shows four biclusters obtained for colon dataset. They resemble the ones found on the human dataset, since we can clearly see that each bicluster contains correlated genes. All genes in a certain bicluster follow the same trend, and they are also within a close range of expression values. In this case, the first obtained bicluster (shown in Figure 5 with label bi0) does not correspond with the highest number of genes, but with the highest number of experimental conditions. It is made up of 55 conditions, which represents the double of the mean numbers of conditions of the whole set of biclusters. 4.4 Comparison Even if the aim of this paper was to assess the validity of the mechanism for controlling the overlapping among bicluster, we nevertheless include a comparison with another state of the art biclustering algorithm, called sequential evolutionary biclustering (SEBI; Divina and Aguilar-Ruiz, 2006). SEBI is an algorithm based on bi 0
bi 24
200
Expression value
Expression value
250
150 100 50 0
0
10
20 30 Conditions
40
50
200 180 160 140 120 100 80 60 40 20 0
0
5
10 15 Conditions
Figure 5. Examples of biclusters found on the colon dataset
25
bi 96 250 Expression value
Expression value
bi 77 200 180 160 140 120 100 80 60 40 20 0
20
0
2
4
6
8
10 12 14 16 18
Conditions
200 150 100 50 0
0
5
10
15
20
Conditions
Notes: X-axis represents each of the experimental conditions in the bicluster, while Y-axis represents the expression level of the genes in each bicluster
25
evolutionary computation that shown excellent performance at finding patterns in gene expression data. Furthermore, SEBI adopts a strategy for avoiding overlapping similar to the one proposed in this paper. Table IV shows the average results (and their standard deviations in brackets) obtained on each dataset by the algorithm SEBI (Divina and Aguilar-Ruiz, 2006) for what concerns the average MSR and the average dimension (genes and conditions) of the biclusters found. Thus, we can compare this table against Table III in order to test performance of our approach. Regarding MSR, Ch&Ch-R shows very similar results against SEBI and all of them are lower than the d used for these datasets. However, if we compare these values with those shown in Table II for Ch&Ch, we can notice that the average real MSR is much higher. On the other hand, we can see that Ch&Ch-R is capable of finding biclusters characterized by a higher number of genes than the ones found by SEBI. This is a very important aspect, since the aim of these biclustering method is to find d-biclusters with maximum size.
Improved biclustering on expression data 491
5. Conclusions In this paper, we have proposed some variations that can be applied to the Ch&Ch algorithm in order to overcome its shortcomings described in Section 2. The original algorithm is very effective at discovering biclusters, however, after some iterations it starts to work with more and more random values in the expression matrix, due to the substitution phase used. This causes the algorithm to estimate wrongly the MSR of the biclusters. In this paper, we have proposed an alternative method for avoiding as much as possible overlapping among biclusters. Our proposal is based on a matrix of weights, that is used to estimate the overlapping of a bicluster with already found ones. We have defined an overlapping factor which is used in order to reject biclusters if their overlapping is above a certain threshold. In this way, the algorithm is always working with the original expression data and so the biclusters it discovers contain only original data. Since no random values are introduced in the expression matrix, we have included other modifications to the algorithm in order to render it non deterministic. Results show that many biclusters found by Ch&Ch have a MSR that is higher than d, due to the random values they contain. This is an important shortcoming of Ch&Ch, since this may yield the algorithm to discovering biclusters that are not d biclusters. It is also important to notice that many biclusters found by Ch&Ch-R would have not been obtained using the original Ch&Ch. This is due to the fact that Ch&Ch does not work with the original expression matrix. This causes that many biclusters are masked by random values.
MSR GenesMean CondsMean
Yeast
Human
Colon
205.18 (4.49) 13.61 (10.38) 15.25 (1.37)
1,028.84 (29.19) 14.07 (5.39) 43.57 (6.20)
492.46 (6.23) 9.86 (4.51) 40.91 (8.00)
Note: Standard deviation is given in parentheses
Table IV. SEBI average results for each dataset
IJICC 2,3
492
As future work, we intend to investigate a way to use the overlapping factor for guiding the algorithm towards biclusters that have a small overlap percentage with other ones. This could be done, e.g. by modifying the modification phases of the algorithm and by using the overlapping factor, in combination with MSR in order to decide, for instance, which node to delete from the bicluster. References Aguilar-Ruiz, J.S., Rodriguez, D.S. and Simovici, D.A. (2006), “Biclustering of gene expression data based on local nearness”, Proceedings of EGC 2006, pp. 681-92. Alizadeh, A.A., Eisen, M.B., Davis, R.E., Ma, C., Lossos, I.S., Rosenwald, A., Boldrick, J.C., Sabet, H., Tran, T., Yu, X., Powell, J.I., Yang, L., Marti, G.E., Moore, T., Hudson, J. Jr, Lu, L., Lewis, D.B., Tibshirani, R., Sherlock, G., Chan, W.C., Greiner, T.C., Weisenburger, D.D., Armitage, J.O., Warnke, R., Levy, R., Wilson, W., Grever, M.R., Byrd, J.C., Botstein, D., Brown, P.O. and Staudt, L.M. (2000), “Distinct types of diffuse large B-cell lymphoma identified by gene expression profiling”, Nature, Vol. 403, pp. 503-11. Baldi, P. (2002), DNA Microarrays and Gene Expression: from Experiments to Data Analysis and Modeling, Cambridge University Press, Cambridge. Ben-Dor, A., Shamir, R. and Yakhini, Z. (1999), “Clustering gene expression patterns”, Journal of Computational Biology, Vol. 6 Nos 3-4, pp. 281-97. Bryan, K. and Cunningham, P. (2007), “BALBOA: extending bicluster analysis to classify ORFs using expression data”, Proceedings of the 7th IEEE International Conference on Bioinformatics and Bioengineering (BIBE ), Boston, MA, 14-17 October, pp. 995-1002. Cheng, Y. and Church, G.M. (2000), “Biclustering of expression data”, Proceedings of the 8th International Conference on Intelligent Systems for Molecular Biology, pp. 93-103. Cho, H., Dhillon, D., Guan, Y. and Sra, S. (2004), “Minimum sum-squared residue cococlustering of gene expression data”, Proceedings of the 4th SIAM International Conference on Data Mining. Cho, R.J., Campbell, M.J., Winzeler, E.A., Steinmetz, L., Conway, A., Wodicka, L., Wolfsberg, T.G., Gabrielian, A.E., Landsman, D., Lockhart, D.J. and Davis, R.W. (1998), “A genome-wide transcriptional analysis of the mitotic cell cycle”, Molecular Cell, Vol. 2, pp. 65-73. Divina, F. and Aguilar-Ruiz, J.S. (2006), “Biclustering of expression data with evolutionary computation”, IEEE Transactions on Knowledge & Data Engineering, Vol. 18 No. 5, pp. 590-602. Harpaz, R. and Haralick, R. (2006), “Exploiting the geometry of gene expression patterns for unsupervised learning”, The 18th International Conference on Pattern Recognition, pp. 670-4. Hartigan, J.A. (1972), “Direct clustering of a data matrix”, Journal of the American Statistical Association, Vol. 67, pp. 123-9. Piatetsky-Shapiro, G., Khabaza, T. and Ramaswamy, S. (2003), “Capturing best practice for microarray gene expression data analysis”, Proceedings of the 9th ACM SIGKDD International Conference on Knowledge Discovery and Data Mining, Washington, DC, pp. 407-15. Tamayo, P., Slonim, D., Mesirov, J., Zhu, Q., Kitareewan, S., Dmitrovsky, E., Lander, E.S. and Golub, T.R. (1999), “Interpreting patterns of gene expression with self-organizing maps: methods and application to hematopoietic differentiation”, Proceedings of the National Academy of Sciences of the United States of America, Vol. 96, pp. 2907-12. Tilstone, C. (2003), “DNA microarrays: vital statistics”, Nature, Vol. 424, pp. 610-2.
Yang, J., Wang, H., Wang, W. and Yu, P.S. (2002), “d-Clusters: capturing subspace correlation in a large data set”, Proceedings of the 18th IEEE Conference on Data Engineering, IEEE Computer Society, Washington, DC, pp. 517-28. Yang, J., Wang, H., Wang, W. and Yu, P.S. (2005), “An improved biclustering method for analyzing gene expression profiles”, International Journal on Artificial Intelligence Tools, Vol. 14, pp. 771-90. Yin, L., Huang, C.H. and Ni, J. (2006), “Clustering of gene expression data: performance and similarity analysis”, BMC Bionformatics, Vol. 7, p. S19. About the authors Beatriz Pontes is an Assistant Professor in Computer Science at the University of Seville, Spain. She received the BEng degree in 2003 and the MSEng degree in 2005, both in Computer Science, from the University of Seville, Spain. Since 2006, she is studying for her PhD on Bioinformatics, especially on the analysis of gene expression data. Her areas of interest include evolutionary computation, knowledge discovery an data mining applied to the bioinformatics field. Beatriz Pontes is the corresponding author and can be contacted at:
[email protected] Federico Divina is an Assistant Professor in Computer Science at the Pablo de Olavide University, Seville, Spain. In 2004, he received his PhD in Computer Science from the Vrije Universiteit of Amsterdam, The Netherlands. He has participated, as a postdoc at the Tilburg University (The Netherlands) in the European project NEWTIES, which concerned the evolution of an artificial society. His research interests include machine learning and in particular evolutionary computation, multi-agent systems and bioinformatics. Rau´l Gira´ldez is an Assistant Professor in Computer Science at Pablo de Olavide University, Seville, Spain. He received the BEng degree in 1998, the MSEng degree in 2000 and the PhD in 2004, all in Computer Science, from the University of Seville, Spain. He has also received a doctoral dissertation award from the University of Seville. His areas of research interest include evolutionary algorithms, knowledge discovery and bioinformatics. Jesu´s S. Aguilar-Ruiz is an Associate Professor in Computer Science at Pablo de Olavide University, Seville, Spain. He received the BSc degree in 1992, the MSc degree in 1997 and the PhD degree in 2001, all in Computer Science, from the University of Seville, Spain. He has also received a doctoral dissertation award from the University of Seville. His areas of research interest include evolutionary computation, data mining and bioinformatics.
To purchase reprints of this article please e-mail:
[email protected] Or visit our web site for further details: www.emeraldinsight.com/reprints
Improved biclustering on expression data 493