Comparison of linear drums and 50-rpm drums. .... Change in volume recovery
with changing depth of cut for linear drum ....................... . Summary of comparative
...
RI 9536
REPORT OF INVESTIGATIONS/1995
PLEASE DO NOT REMOVE FROM LIBRARY
~/
/
(
\
~ a?Jf>:J~ "\,s /
.
\
-J
~~'
\\
'\. . ~
~
_..~'(,;
:-l~'
~~' ,..i.t'
~V:'t;-ft.~'\
~~~~t-~
\ ~~ \ Improved Perform'a[lce of Linear Coal Cutting . Compared With Rotary Cutting
UNITED STATES DEPARTMENT OF THE INTERIOR
UNITED STATES BUREAU OF MINES
U. S. Department of the Interior Mission Statement As the Nation's principal conservation agency, the Department of the Interior has responsibility for most of our nationally-owned public lands and natural resources. This includes fostering sound use of our land and water resources; protecting our fish, wildlife, and biological diversity; preserving the environmental and cultural values of our national parks and historical places; and providing for the enjoyment of life through outdoor recreation. The Department assesses our energy and mineral resources and works to ensure that their development is in the best interests of all our people by encouraging stewardship and citizen participation in their care. The Department also has a major responsibility for American Indian reservation communities and for people who live in island territories under U.S. administration.
Report of Investigations 9536
Improved Performance of Linear Coal Cutting Compared With Rotary Cutting By W. W. Roepke, B. D. Hanson, R. C. Olson, C. F. Wingquist, and T. A. Myren
UNITED STATES DEPARTMENT OF THE INTERIOR Bruce Babbitt, Secretary BUREAU OF MINES Rhea L. Graham, Director
International Standard Serial Number ISSN 1066-5552
CONTENTS Page Abstract. . . . . . . . . . . . . . . . . . . . . . . . . . . . . . . . . . . . . . . . . . . . . . . . . . . . . . . . . . . . . . . . . . . . . . . . . . . Introduction . . . . . . . . . . . . . . . . . . . . . . . . . . . . . . . . . . . . . . . . . . . . . . . . . . . . . . . . . . . . . . . . . . . . . . . . Linear cutting concept background ....................................................... Linear cutting system design . . . . . . . . . . . . . . . . . . . . . . . . . . . . . . . . . . . . . . . . . . . . . . . . . . . . . . . . . . Initial concept verification . . . . . . . . . . . . . . . . . . . . . . . . . . . . . . . . . . . . . . . . . . . . . . . . . . . . . . . . . . . . Comparison testing with second generation drum .......................................... Experimental plan ............................................................... Drum types .................................................................... Results and discussion ............................................................ Comparison of linear drums and 50-rpm drums. . . . . . . . . . . . . . . . . . . . . . . . . . . . . . . . . . . . . . . . . . Comparison of linear drum and 22-rpm forward attack drum ....................... ; . . . . . . . . Replicated data ................................................................. Statistical analysis . . . . . . . . . . . . . . . . . . . . . . . . . . . . . . . . . . . . . . . . . . . . . . . . . . . . . . . . . . . . . . . . . . Conclusions ........................................................................ References .................................................................... : . . . . Appendix A.-Description of test facility ................................................... Appendix B.-Individual test results . . . . . . . . . . . . . . . . . . . . . . . . . . . . . . . . . . . . . . . . . . . . . . . . . . . . . . . Appendix C.-Bit force determinations .................................................... Appendix D.-Analysis of variance. . . . . . . . . . . . . . . . . . . . . . . . . . . . . . . . . . . . . . . . . . . . . . . . . . . . . . . .
1 2 3 4 5 6 6 7 7 7 12 17 17 18 18 19 25 27 31
ILLUSTRATIONS
1. 2. 3. 4. 5. 6. 7. 8. 9. 10. 11. 12. 13. 14. 15. 16. 17. 18. 19. 20. 21. 22. 23. 24. 25. A-I. A-2. A-3. A-4.
Cutting sequence of linear drum ................................................... . Artist's rendition of continuous miner with CDLC drum .................................. . Schematic comparison of bit paths for rotary and CDLC miners ............................ . Volume removed versus cut depth for linear and rotary drums ............................. . Internal gearbox ............................................................... . First and second generation linear cutting drums ....................................... . Comparison of L1 linear head and R1 rotary drums ..................................... . Three Rotary cutting drums ...................................................... . Specific dust results for linear and 50 rpm rotary drums .................................. . Torque results for linear and 50 rpm rotary drums ...................................... . Peak torque results for linear and 50 rpm rotary drums .................................. . Thrust results for linear and 50 rpm rotary drums ...................................... . Peak thrust results for linear and 50 rpm rotary drums ................................... . Power results for linear and 50 rpm rotary drums ....................................... . Minus 0.32 cm (1/8 in) results for linear and 50 rpm rotary drums .......................... . Results for plus 5.08-cm (2-in) material for linear and 50 rpm rotary drums ................... . Results for specific dust for linear and slow rotary drum .................................. . Torque results for linear and slow rotary drum ........................................ . Peak torque results for linear and slow rotary drum ........................... " ......... . Thrust results for linear and slow rotary drum ......................................... . Peak thrust results for linear and slow rotary drum ..................................... . Power results for linear and slow rotary drum ......................................... . Results for minus 0.32 cm (1/8 in) for linear and slow rotary drum ......................... . Results for plus 5.08-cm (2-in) material for linear and slow rotary drum ...................... . Replicated data ................................................................ . Mainframe of multibit test facility ...................................... "., .. , .. ,'" Schematic of dust measurement system ., .......... " " " ' , . " . , .... " . , . , . , , " " , " ' , Comparison of Illinois No.6 coal and simulatcd coal ...... ,", ....... , ..... " .. ,.,.,"'" Pallet of simulated coal blocks in storage .. , ... , , .. , .. , . , .. , , , , , , . , . , , , , . , , , , ..... , , , , ,
2 2
3 4 5 5 6 6 8 8 9 9 10 10 11 11
13 13 14 14 15 15 16 16
i
17
19
20 22
23
," I , I
ii
ILLUSTRATIONS-Continued
Page A-5. A-6. A-7. C-1. C-2. C-3. C-4. C-5.
Assembled test sample ready for cutting test ........................................... Shape of face after rotary cutting . . . . . . . . . . . . . . . . . . . . . . . . . . . . . . . . . . . . . . . . . . . . . . . . . . . . Shape of face after linear cutting. . . . . . . . . . . . . . . . . . . . . . . . . . . . . . . . . . . . . . . . . . . . . . . . . . . . Bit force vector schematic for linear drum . . . . . . . . . . . . . . . . . . . . . . . . . . . . . . . . . . . . . . . . . . . . . Tangential and normal force versus shaft angle ......................................... Bit force versus depth of cut for L2 . . . . . . . . . . . . . . . . . . . . . . . . . . . . . . . . . . . . . . . . . . . . . . . . . . Tangential force capability versus shaft angle . . . . . . . . . . . . . . . . . . . . . . . . . . . . . . . . . . . . . . . . . . . Variation in bit attack angle across face during linear cutting ...............................
23 24 24 28 29 29 30 30
TABLES 1.
2. 3.
4. 5. 6. B-l. B-2.
D-l. D-2. D-3. D-4.
Change in volume recovery with changing depth of cut for rotary drum ....................... Change in volume recovery with changing depth of cut for linear drum ....................... Summary of comparative results for L1 drum versus R1 drum ............................. Results comparing linear drum and four rotary drum configurations ......................... Replicated test set . . . . . . . . . . . . . . . . . . . . . . . . . . . . . . . . . . . . . . . . . . . . . . . . . . . . . . . . . . . . . . Analysis of variance results for five drums ............................................ Test results ................................................................... Maximum cut depth of test drums .................................................. Test results for full factorial experiment .............................................. ANOVA results for full factorial experiment .......................................... Test results for replicated experiment ............................................... ANOVA results for replicated experiment ............................................
. . . . . . . . . . . .
3 3 6 12
17 17 25 26 31 32
33 34
UNIT OF MEASURE ABBREVIATIONS USED IN THIS REPORT cm
centimeter
lb
pound
cm/s
centimeter per second
m
meter
deg
degree
m 3 /min
cubic meter per minute
ft
foot
mg/m 3
milligram per cubic meter
fe/min
cubic foot per minute
min
minute
g
gram
ms
millisecond
g/m
gram per meter
N
newton
gpm
gallon per minute
N-m
newton-meter
hp
horsepower
oz
ounce
in
inch
pct
percent
in/s
inch per second
rpm
revolution per minute
kg
kilogram
",m
micrometer
kN
kilonewton
°C
degree Celsius
kW
kilowatt
OF
degree Fahrenheit
L/min
liter per minute
Reference to specific products docs not imply endorsement by the U.S. Bureau of Mines.
IMPROVED PERFORMANCE OF LINEAR COAL CUTTING COMPARED WITH ROTARY CUTTING
By W. W. Roepke,1 B. D. Hanson,2 R. C. 0180n,3 C. F. Wingquist,4 and T. A. Myren 5
ABSTRACT The linear cutting system, developed by the U.S. Bureau of Mines, uses geometric principles developed by Cardan to produce a nearly constant cut depth. The new system has been extensively tested in a synthetic material under laboratory conditions to verify mechanical capability and to identify operational characteristics. Comparisons between IS-rpm linear cutting and 50-rpm rotary cutting systems show significant improvement in respirable dust entrainment, product size distribution, and energy usage. Respirable dust is reduced by as much as 90 pct. Recovered product showed a 67-pct reduction in -0.32-cm (-1/8-in) material and a 2OO-pct increase in +5.08 cm (+2 in) material. Average power was reduced by 66 pct for the linear cutting. Because the bit cutting paths differ between linear and rotary cutting, it was necessary to compare the two at the same cut depths and bit types. These comparisons show that low revolution per minute rotary cutting entrains about the same amount of respirable dust as the linear cutting system, but the average shaft torque may be 55 to 130 pct greater for the rotary system.
lSupeIVisory physical scientist (retired). 2Physical scientist. 3Mechanical engineer. 4Physical scientist (retired). SMining engineering technician (retired). Twin Cities Research Center, U.S. Bureau of Mines, Minneapolis, MN.
I
i'
2
INTRODUCTION The U.S. Bureau of Mines (USBM) at the Twin Cities Research Center in Minneapolis has been working on the prevention and control of airborne respirable dust generation by rotary drum mining machines since enactment of the Federal Coal Mine Health and Safety Act of 1969. The working premise has been "If you don't want dust, don't produce it," but since coal cannot be fragmented without producing dust, practical approaches to the problem have relied on either minimizing the dust generated or control and/or suppression of the dust once it is entrained. While control is adequate to meet near-term regulatory concerns when production is not high, the most economically advantageous approach for either long-term or highproduction operations is reduction of the dust generated at the face during the cutting process. This can only be done through redesign of the cutting system. Such a reduction in dust generation would reduce the burden on existing control and suppression techniques allowing the operators to more easily meet the standard. The synergism between a new mining technology and existing control-suppression technology will permit significan~ h· creases in production capability. The USBM has designed a new "linear cutting system" based on geometric principles developed by Cardan in the 1500's. Cardan defmed the relationships for a rotating equilateral triangle whose center of rotation also rotates about an eccentric, but in the opposite direction (figure 1). For the case where the center of rotation of the triangle rotates three times for each rotation of the triangle and the radius of the eccentric and the distance from the triangle center to each apex are in the ratio of 9:1, each apex will trace out an approximately square path. The linear cutting system based on this geometry and shown in the artist's rendition of figure 2 consists of a triangularshaped drum with the bits mounted in a row along each apex. The drum is mounted to a spur gear riding inside a ring gear in such a manner that the triangular drum rotates once for every three rotations of the spur gear inside the ring gear. This gerotor drive system provides a mechanical reduction of 3:1. The cutting concept is described in patent applications (1-4).6 The development of the linear cutting concept required extensive comparison testing between full-sized linear and rotary-cutting drums to quantify the specific differences between the two cutting systems. This was done in two phases. Initial testing was done to provide proof of concept for the linear system, and to furnish preliminary comparisons with current rotary cutting systems. Based on these results, a more comprehensive test series was conducted to statistically confirm the preliminary fmdings, to compare the linear cutting system with rotary cutting 6Italic numbers in parentheses refer to items in the Jist of references preceding the appendixes at the end of this report.
drums operating with similar bit speeds, and to investigate the cutting parameters associated with the noted reduction in dust. This testing was done using a synthetic material, whose force characteristics closely approximated Illinois No.6 coal.
Figure 1 A
B
c
o
Cutting sequence of linear drum. A, No rotation; B, 45° rotation; c.; 135° rotation; D, 270" rotation.
Figure 2
Artist's rendition of continuous miner with constant-depth linear cutter (CDLe) drum.
3
LINEAR CUTTING CONCEPT BACKGROUND The linear cutting concept was developed from the analyses of rotary cutting technology by the USBM in 1976 (5). These investigations related the depth of cut for each bit on the drum to the dust and forces generated per unit volume of coal cut. With rotary cutting each bit on the drum enters the coal face at zero depth of cut. As the bit proceeds in its circular path the depth of cut increases to a maximum at the horizontal centerline. Once the bit is past the centerline the depth of cut decreases until the bit exits at zero depth (figure 3A). The relationship between the depth of cut and the volume recovered for rotary cutting is shown in table 1. Table 1.-Change In volume recovery with changing depth of cut for rotary drum Pet of maximum cut depth
Pet of rotation
10 ............ . 20 30 40 50 ............ . 60 70 ............ . 80 ........... ..
18.4 33.4 47.6 60.6 72.1 81.9 89.7 95.4
90 ............ . 100 ........... .
100.0
Pet of total volume removed
1.7 5.7 11.9 20.2 30.4 42.3 55.5 69.8 86.6 100.0
98.8
It can be seen that the cutting action between zero and approximately 75 pct of maximum depth of cut produces about one-third of the total volume of coal recovered. That portion of the cut constitutes the shallow-cutting, low-coal-recovery part of the drum rotation where the ratio of dust produced and energy used to the volume recovered is maximum. It follows that if one wishes to design an improved cutting system, the low-recovery portion of the rotary cut must be eliminated from the system to minimize the ratio of dust and energy to volume recovered. Figure 3B shows the reduction in the amount of shallow cutting by a linear drum as compared with a rotary drum. Table 2 shows the relationship between depth of cut and volume removed for the linear drum. Figure 4 shows the comparison between rotary and linear cutting. When both drums have reached 75 pct of maximum cut depth, the rotary drum has removed approximately 33 pct of the total volume. The linear drum has taken only 15 pct in this shallow cutting region. The linear drum takes approximately 70 pct of the total volume at cut depths between 95 and 100 pct of its maximum depth of cut. The rotary drum removes only 30 pct in this range of cut depths. The linear drum not only cuts less material at shallow depths of cut, but also does 70 pct of its cutting at or near the maximum cut depth. Table 2.-Change In volume recovery with changing depth of cut for linear drum
Fagun3
Pet of rotation
,,
45 0
a: :r:
50 40
I~
~
3
~
2
o
I,
0.95
,I
1.91
2.86
ADVANCE RATE, cm/s
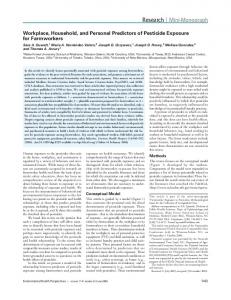
Results for minus 0.32 em (1/8 in) for linear and slow rotaty drum. !,
Figure 24 45 40
KEY DL213R2A
35 t)
c.
'i
u
30 25
co ~
LO
en
:::::>
....I 0..
20 15 10 5 0 0.95
,
i I
i
1.91 ADVANCE RATE, cm/s
i
I;,
i
I
i
Results for plus 5.08-cm (2-in) moterial for linear and slow rotaty drum.
2.86
. .- . - " "
~-
i
17
Table 5.-Replicated test set
L2 drum
Variable 3
Speoiflo dust, mg/m . • . . • • . • • • . Average torque, N-m .......... . Average thrust, kN ............ . Power, kW .................. . Minus 0.32-om produot, pet ..... . Plus 5.08-om produot, pot ....... .
,
,I
0.028 6254 10.26 29.47 6.40 42.27
0.059 6847 4.58 35.88 9.45 6.83
± 0.003 ± 244 ± 1.87 ± 1.12 ± 0.7 ± 1.0
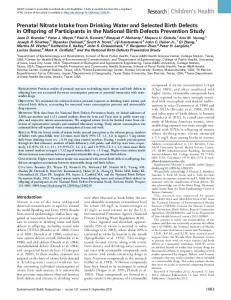
Replicated Data
Table 5 and figure 25 show the portion of the experiment which was replicated. As can be seen by comparing figure 25 and figures 9-16, values for the three drums at the 1.91 cmls (0.75 in/s) advance rate, the data were consistent.
0,092 ±
± 0.004 ± 438 ± 0.26 ± 2.31 ± 1.0 ± 1.8
0.007 733 9.n ± 0.13 52.44 ± 3.88 12.03 ± 1.3 17.10 ± 0.9
10005 ±
variables showed a significant difference at a confidence level of 95 pet. The complete ANOVA tables are given in appendix D. Table 6.-Analysls of variance results for five drums
STATISTICAL ANALYSIS
Both the data from the full factorial (five drum types and three advance rates) and the replicated tests were analyzed using standard analysis of variance techniques (ANOVA) (9). The summary of results (table 6) identifies parameters affected by drum type andlor advance rate for the full factorial. With the exception of the minus 0.32-cm (l/8-in) mesh screen as a function of advance rate, all of the dependent
R4 drum
R2B drum
Full factorial: Drum ... Advance rate ... Replioation: Drum ...
Speoifio dust
Torque
Thrust
Minus Power 0.32-om product
Yes
Yes
Yes
Yes
Yes
Yes
Yes
Yes
Yes
Yes
No
Yes
Yes
Yes
Yes
Yes
Yes
Yes
Plus 5.08-om product
Note.-The yes or no in the table indioates the signifioanoe of the variable at the 95-pct level of confidence for each response.
Figure 25 250
200
IDIJ Linear
:e
:::l
a:
Q
~
150
II.
0
IZ LIJ
()
a:
100
LIJ
c. 50
o Specific Dust
Average Torque
Average Thrust
Power
Minus O.32cm
Plus 5.08 cm
Replicated dolo.
I
18
CONCLUSIONS Testing has confirmed the validity of the new linear cutting concept. Dust generation is reduced with linear cutting from 35 to 90 pct for the same production rate when the rotary drums are cutting relatively shallow and at high drum speeds. As depths of bit penetration of the rotary cutting increased due to slower drum speed to that used by the linear drum, dust generation levels were approximately the same. Linear cutting, with one exception, required less power than the rotary drum configurations. The maximum difference was 70 pct. Linear cutting consistently produced more + 5.08-cm (+ 2-in) product than
the rotary drums tested and produced the same or less, -032-cm (-1/8-in) product. The mechanics of linear cutting required the development of a new eccentric drive system for the concept to become operational. The resulting high-torque gerotor gearbox, modified to accommodate rotary cutting, may provide the ability to cut slow and deep with a rotary drum machine. Past USBM research (8) has shown the potential benefits of such a system, but to date there is no gearbox capable of withstanding the strain imposed by such a cutting mode.
REFERENCES 1. Roepke, W. W., D. P. Lindroth, and J. W. Rasmussen. Linear Cutting Rotary Head Continuous Mining Machine. U.S. Pat. 4,025,0'n, Mar. 15, 1977. 2. Roepke, W. W., K. C. Strebig, and B. V. Johnson. Method of Operating a Constant Depth Linear Cutting Head on a Retrofitted Continuous Mining Machine. U.S. Pat. 4,025,116, May 25, 1m. 3. Roepke, W. W., D. P. Lindroth, and R J. Wilson. Automatic Face TJ;IInsfer by Linear Cutting Rotary Head. U.S. Pat. 4,062,595, Dec. 13, 1m. 4. Roepke, W. W., and S. J. Anderson. Triangular Shaped Cutting Head for Use With a Longwall Mining Machine. U.S. Pat. 4,303,2'n,
Dec. 1, 1981. 5. Roepke, W. W., D. P. Lindroth, and T. A. Myren. Reduction of Dust and Energy During Coal Cutting Using Point Attack Bits With
a Discussion of Rotary Cutting and Development of a New Cutting Concept. USBM RI 8185, 1976, 53 pp. 6. Courtney, W. G. New Development in Respirable Dust Control (Pree. Symp. on Underground Mining, Louisville, KY, Oct. 1975). NCA/BCR Coal Conf. and Expo n, pp. 103-109. 7. Matta, J. E. Effect of Location and Type of Water Sprays for Respirable Dust Suppression on a Continuous Mining Machine. USBM TPR 96, 1976, 11 pp. 8. Black, S., R L. Schmidt, and B. V. Johnson. Reduced Generation of Airborne Dust Through Deep Cutting Continuous Miners. Coal Age, v. 82, No. 10, Oct. 1m, pp. 158-160. 9. Hicks, C. R Fundamental Concepts in the Design of Experiments. Holt, Rinehart & Wilson, New York, NY, 1964, 293 pp.
--------------------------------------19
APPENDIX A.-DESCRIPTION OF TEST FACILITY GENERAL FACIUTY DESCRIPTION
The Multibit Test (MBT) stand (figure A-1) was developed to verify the mechanics of the linear cutting concept and to allow comparisons between existing rotary cutting systems and the linear cutting system. It consists of a fixed drum mounting-drive system, a sample transport table and a control-measurement system. The MBT was built so that each drum cut a 76.2-cm-wide (30 in) by 81.3-cm-high (32 in) cross section, which is equivalent to a low-seam longwall shearer or to one-fourth of a continuous miner head on sump. The drums are mounted on a fixed support frame and the synthetic coal sample is moved perpendicular to the axis of the drum to simulate cutting an entry or panel. The cutting system drums were designed to be interchangeable on the test stand. The sample transport is a heavy steel table mounted on cam rollers moved by a hydraulic cylinder. The maximum displacement of the sample transport table is 1.83 m (6 ft). Figure A-I
Mainframe
of multibit test facility·
Two hydraulic pumps are used to drive the drum rotation and the sample transport table independently. The drum rotation system has a 74.6-kW (loo-hp) electric motor driving a 378.5-L/min (loo-gal/min) pump which operates a 74.6-kW (loo-hp) hydraulic motor. With the gerotor gearbox, the linear drum can operate up to 15 rpm while any rotary drum without the gear reduction can operate up to 50 rpm. A 29.8-kW (40-hp) electric motor powers the hydraulic system used to move the sample transport table into the rotating drum. This system has two flow control valves giving two table speed ranges of 0.64 to 1.91 cm/s and 2.54 to 7.62 cm/s (0.25 to 0.75 in/s and 1.0 to 3.0 in/s), respectively. FACIUTY INSTRUMENTATION
Load-Position Measurements The facility is equipped to measure both forces and position. Measurement-control functions include: sample
20 infeed thrust, sample position, drive-shaft torque, angular displacement of shaft, shaft revolution per minute, and infeed table speed. The latter two are provided to facilitate setting manual controls. The thrust transducer used is a commercially available strain-gauged clevis pin mounted in the hydraulic cylinder eye which fastens to the sample support table. Shaft torque measurements are implemented using strain gauge transducers mounted on the drive shaft. All torque values reported in this report are shaft torques. For rotary drums, the shaft torque and drum torques are equivalent. For the linear drum, drum torque is three times the measured shaft torque because of the three to one gear reduction in the gerotor. All measurement channels are fed into a bank of signal conditioning modules which provide input offset, gain and transducer excitation, and analog light-emitting diode bar graph display of the output. The system has limit and overload controls to prevent system damage. The control system also has an override to allow the table or head to be backed out if it does become jammed. User-adjustable, vernier potentiometers on the hydraulic valves control the revolution per minute and table speeds. Primary data acquisition is accomplished with a fourchannel frequency modulation data tape recorder using
standard 4.70 cm/s (1-718 in/s) tape cassettes. The tape is replayed through a low-pass ftlter into an analog-todigital converter interfaced with a personal computer. Commercial data acquisition software digitize and store the test signals in a format that can then be directly imported into a spreadsheet for analysis. Dust Measurement
A schematic of the dust measurement system is shown in figure A-2. The drum and sample table are enclosed in a dust shroud during testing. Dust liberated during a cutting test is entrained in the air of the test chamber. The dust-laden air is pulled from the test chamber through a 30.48-cm-diameter-exhaust (12 in) duct at 70.79 m3 /min (2,500 ft3 /min) . . An isokinetic sampling probe is located in this discharge duct. A 0.11-m3 /min (4-ft3 Imin) constant flow air pump draws a sample of the aerosol through a 3.5-p.m cut-point cyclone. The dust, smaller than 3.5 p.m, is collected by the afterftlter. Gravimetric analysis is performed to determine the amount of dust collected on the afterftlter. The result is divided by the cubic feet of sample material removed to calculate a specific dust value.
Isokinetic probe
I==-==il II II II
After fi It er r'"'--'---,
3.5-fLm cut-point cyclone
Kurz air sampler Schemotic of dust mellSUTrmU!lJt system.
To suction fan ~
Flow rate= 3 70.8m /min
21
SYNTHETIC COAL SAMPLE
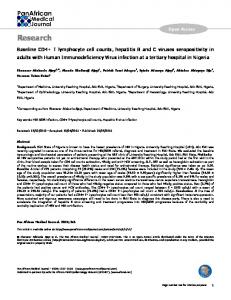
Because coal disintegrates rapidly when exposed to air, and because it is difficult to obtain the quantity, size, and consistency needed for these tests, a synthetic coal sample is used in the cutting tests. This synthetic material is made from No.1 molding plaster. With careful control of water content and curing times, the final test block reverts to gypsum which exhibits the same cutting forces as Illinois No.6 coal. A comparison of cutting forces between the synthetic coal and Illinois No. 6 coal is shown in figure A-3. The average and peak tangential values are nearly identical, but the normal forces are slightly less in the simulated material. The synthetic coal does not have any internal fracturing or cleats as coal does. Although it fractures in a brittle manner and has nominally similar cutting forces, it is much tougher cutting than coal. Since all the drums were tested in the same material, the comparisons between them are valid. The recipe for these gypsum blocks is 39.69-kg (87.5-lb), No.1 molding plaster, 23.81-kg (S2.5-lb) water, which is 60 pct of the plaster weight, and 7.09-g (1/4-oz) sodium citrate. After slow mixing to control aeration and
voids, a 3O-min cure in the mixing form is used for initial setup. They are then taken out of the form and placed in a low-temperature oven 43.3 °C ±2.8° (110 OF ±SO). After the blocks have been in the oven for 3 weeks, they have lost all free water, and the plaster has reverted to a gypsum with a weight of about 46.27 kg (102Ib). At this point, they are uniformly dry and ready for assembly into the large sample to make a simulated coal seam. The material in this dried condition is minimally hygroscopic so the blocks can be stored on open pallets (figure A-4), awaiting fmal use. The cutting tests require a simulated coal seam with the approximate size of 0.91 by 1.22 by 2.13 m (3 by 4 by 7 ft). This large sample is made-up of 60.smaller blocks which are 30.48 by 30.48 by 41.91 cm (12 by 12 by 16-1/2 in). The 60 blocks are assembled using a Super X Hydrostone as a binder between blocks. The binder, which acts like shale bands in the seam, is more difficult to cut than the synthetic coal. A' completed simulated seam with the roof steel bolted down on top and ready for test cuts is shown in figure A-S. Figures A-6 and A-7 show the simulated seam after test cuts using the rotary and linear drums, respectively.
22 FigureA-3 KEY
2,500
-Ir-
2,000
Simulated coal - cutting
-+- Simulated coal - normal -Illinois No.6 coal - cutting -+-Illinois No.6 coal - normal
z u.i
(.)
1,500
a:
f2 w
~w ~
1,000
500
o 6,000
5,000
4,000 Z
u.i
(.)
a: 0
LI.
3,000
~
~
0.
2,000
1,000
o
L -_ _ _ _ _ _ _ _ _ _ _ _ _ _ _ _ _ _
~
__________________
o
2 DEPTH OF CUT,
Comparison
of Illinois No.
~
6 cool and simulated coaL
em
_ _ _ _ _ _ _ _ _ _ _ _ _ ___
23
FigureA-4
Pollet of simuloted cool blocks in stoI'agf!.
FigureA-5
Assembled test sample ready for cutting test.
24
FigureA-6
Shape of face
after rotmy cutting.
FigureA-7
Shape of face
after lineIIr cutting.
25
APPENDIX B.-INDIVIDUAL TEST RESULTS Table 8-1.-T." r..ulta Variable and drum Specific dust, mg/m3 : L2 ................................ .. R2A .......................•......... R2B ................................ . R3 ................................. . R4 ................................. . Average torque, N-m: L2 ................................ .. R2A ....•.•.......................... R2B .•............................... R3 ................................. . R4 ................................. . Peak torque, N-m: L2 ................................ .. R2A ................................ . R2B ................................ . R3 ................................. . R4 .•................................ Average thrust, kN: L2 ................................ .. R2A .................. '.............. . R2B ................................ . R3 ................................. . R4 ................................. . Peak thrust, kN: L2 ................................ .. R2A ................................ . R2B •................................ R3 ................................. . R4 ................................. . Power, kW: L2 ................................. . R2A ................................ . R2B ................................ . R3 ................................. . R4 ................................. . Minus O.32-cm, pet: L2 ................................ .. R2A ....................•..........•. R2B ................................ . R3 ................................. . R4 ..........................•....... Plus 5.08-Cm, pet: L2 ................................. . R2A ....................••..........• R2B ................................ . R3 ................................. . R4 ................................. .
Advance rate, em/s 0.95 1.91 2.86
0.035 0.050 0.072 0.216 0.262
0.033 0.013 0.050 0.078 0.159
0.026 0.009 0.059 0.064 0.104
3,030 6,507 7,153 11,263 9,291
6,721 10,434 8,161 11,404 10,730
8,624 19,940 7,014 13,695 13,557
6,4591 1,726 10,723 17,704 17,965
10,798 16,320 15,161 18,066 20,203
16,358 20,873 10,691 20,218 21,246
4.27 4.29 4.29 11.80 12.47
10.44 6.27 4.83 9.98 15.50
13.78 8.01 4.66 12.24 18.62
33.4 12.5 10.5 23.0 27.0
67.7 16.3 12.1 24.0 26.5
78.5 26.8 9.7 29.4 27.6
14.3 15.3 37.5 59.0 48.7
31.7 24.6 42.7 59.7 56.2
40.6 47.0 36.7 71.7 71.0
6.1 6.7 19.8 24.3 17.8
7.1 7.9 12.4 14.7 11.9
7.9 7.1 7.5 11.8 10.2
28.4 15.3 8.3 18.8 11.0
41.2 26.6 10.3 15.8 8.3
40.7 ~.1
13.4 23.1 19.7
26
Table B-2.-Maximum cut depth of test drums Advance rate, cm/s
Drum type L2 .......................................... .
R2A ......................................... . R2B ..•.......................................
0.95
1.91
2.86
1.27 1.27 0.58 0.58 0.38
2.54 2.54 1.14 1.14 0.76
3.81 3.81 1.73 1.73 1.14
R3 .•.........••.....•.....•...•.............. R4 .......................................... . Note.-For the linear drum, L2, the average cut depth is 84 pct of the maximum. For the rotary drums, R2A through R4, the average cut depth is 67 pet of the maximum.
27
APPENDIX C.-BIT FORCE DETERMINATIONS General Comments on Bit Forces Based on past experience, direct bit force measurements were considered to be impractical. The test stand instrumentation does, however, allow the measured values of shaft torque, shaft angle, and sample advance to be used to determine average forces on the bits. A brief discussion of these bit force determinations and a summary of their calculated values are presented in this appendix for the linear tests. I
Discussion of Bit Force Determination
varies with shaft angle and also that the relationship between shaft torque and head torque is dependent on the geometry of the gerotor assembly. A schematic representation of the linear head and gerotor is provided by figure C-l. Identified in the construction and relevant to this discussion are the moment arm, r; the gerotor to bit tip distance, 1; the ring radius, a; the gerotor radius, b; the normal force, FN; the tangential force, FT; the shaft angle, 0; and the normal force vector direction, a. The tangential force, FT, is expressed in terms of the shaft torque, T, the shaft torque transformation ratio, b/(a-b), and the moment arm length, r, by:
1-
The resultant force fed through the tip of the bit is resolved into two components, normal and tangential. The normal force is defined as the component of the resultant force which is directed along a line originating at the axis of rotation and terminating at the bit tip. The tangential force is defined as the component of the resultant force which is directed along a line perpendicular to the normal force. The tangential force vector, as its name implies, is always tangent to the locus of the bit tip as it proceeds through the cutting cycle. Torque at the measurement point (drive shaft) is transformed into head torque and then divided by the moment arm length, (the distance from the center of rotation to the bit tip) to get tangential force. The normal force is determined by summing the projections of the normal and tangential force vectors onto the horizontal axis and equating this sum to the sample infeed thrust and finally solving the equation for the unknown quantity (normal force). The measured quantities that are input to the transformation equations are shaft angle, shaft torque and sample infeed thrust. The accuracy of the transformation equations is dependent on the accuracy of the values for the measured quantities as well as the angular position of the head or shaft. As the direction of the normal force vector increases beyond 45°, the equations for normal force become increasingly sensitive to errors in the independent variables (measured quantities). This is intuitively obvious since, as the normal force vector approaches a vertical position, the projection of that vector onto the horizontal axis is approaching zero. The following provides some of the details including the transformation equations (without derivations) pertaining to the bit force calculations for each specific cutting system.
Linear Cutting Specifics The transformation equations are complicated due to the fact that the moment arm, r, is not a constant, but
r
[lcos(~) 3
+ (a -
FT
Tb r(a-b)
= ---,
(1)
The value of r is given by the rather complicated expression shown below in equation 2. The expression for normal force is obtained by equating the sum of the projections of the vectors FT and FN onto the horizontal axis to the sample infeed thrust FX and solving for FN to get: FN = FX - FTsina
cosa
(3)
The angle, a, can be expressed in terms of the shaft angle, 0, by: -Isin (~) + bsinO a = arctan _ _ _ _3_ _ _ __ 1f - 0 -leos ( - - ) + bcosO 3
(4)
Linear Bit Forces Bit forces have been calculated for each pass (each row of bits) of each linear cutting test. The calculated values are based on torque and thrust values sampled every 50 ms. A separate angle transducer measures shaft angle since that is the independent variable in the transformation equations. Bit force data versus shaft angle for a typical cut of a bit row on the linear drum from the top corner to the bottom corner of the face are shown in figure C-2. The force values given in figure C-2 are distributed equally over the bits (five or six for drum L2) in the row along any single apex of the linear drum. Although the cutting cycle ranges from 0° to 360° of shaft angle, the transformation equations are useful only over the range of approximately 45° to 315° of shaft angle (top corner to bottom corner).
b)cosO - acosO]2 +
[lsin(~) 3
+ (a - b)sinO - asinO]2
(2)
i!
28
Outside of this range, normal force determinations are excessively sensitive to measurement errors in torque and thrust. For this reason, in figure C-2, tangential force includes the corners while the normal force is shown for only the linear portion of the cut. An increased tangential force about shaft angles of 45° and 3150 may be seen at the upper and lower corners. At the midface point, where the row of bits is encountering an inclusive shale band, (layer of hydrostone cement), a peak may also be seen in the tangential force. There is a peak in the normal force at a shaft angle of 90° which corresponds to the beginning of the linear portion of the cut. These are features typical of all of the linear test data. A summary of the bit force data from the second-generation linear drum, L2, cutting tests reported in this document are shown in figure C-3. This figure shows the calculated single-bit forces, averaged over the linear portion of the face being cut, for the three advance rates used. The average peak normal and tangential forces for the upper corner region are also shown. The average and peak normal forces are relatively low, and insensitive to depth, over the range of advance rates covered by these tests. This is consistent with past experience in linear cutting when using this bit geometry. Peak tangential force is more sensitive to depth of cut and is significantly higher in magnitude than is the average tangential force over the linear range. A mitigating factor is the tangential force capability of the system. The tangential force capability varies over the cutting cycle as shown in figure C-4. The tangential force capability for a given shaft torque is 2.2 times greater in the corner than at the midface point because the length of the moment arm (the distance from the instantaneous center of rotation to the bit tip) varies as a function of shaft angle
and length of the eccentric arm. The angle of attack of the bit (dermed as the angle lying between the centerline of the bit and the normal force direction) also varies with shaft angle as shown in figure C-5. Notice that the angle of attack in the corners (shaft angle at 45° and 315°) is equal to the angle of attack at the midface point. This identifies one of the significant differences between linear and rotary cutting systems. The linear cutting system has a constantly varying angle of attack with a fixed depth of cut across the linear portion of the face. Rotary drum systems use a fIXed angle of attack with a constantly varying depth of cut across the face. Figure C-J Instantaneous center (P2)
-E