Adv. Geosci., 40, 31–35, 2015 www.adv-geosci.net/40/31/2015/ doi:10.5194/adgeo-40-31-2015 © Author(s) 2015. CC Attribution 3.0 License.
Improvements in Data Quality, Integration and Reliability: New Developments at the IRIS DMC T. Ahern, R. Benson, R. Casey, C. Trabant, and B. Weertman IRIS Data Management Center, 1408 NE 45th Street, Seattle, WA 98105, USA Correspondence to: T. Ahern (
[email protected]) Received: 14 November 2014 – Revised: 14 January 2015 – Accepted: 15 January 2015 – Published: 13 February 2015
Abstract. With the support of the US National Science Foundation (NSF) and on behalf of the international seismological community, IRIS developed a Data Management Center (DMC; Ahern, 2003) that has for decades acted as a primary resource for seismic networks wishing to make their data broadly available, as well as a significant point of access for researchers and monitoring agencies worldwide that wish to access high quality data for a variety of purposes. Recently IRIS has taken significant new steps to improve the quality of and access to the services of the IRIS DMC. This paper highlights some of the current new efforts being undertaken by IRIS. The primary topics include (1) steps to improve reliability and consistency of access to IRIS data resources, (2) a comprehensive new approach to assessing the quality of seismological and other data, (3) working with international partners to federate seismological data access services, and finally (4) extensions of the federated concept to extend data access to data from other geoscience domains.
1
Building resiliency in IRIS data services through auxiliary data centers
For several decades IRIS has relied on a single centralized data center in Seattle, Washington to provide all services to the community. In 2006 we created an Active Backup System at the PASSCAL Instrument Center in Socorro, New Mexico. This backup system held copies of all the primary waveform data, key software source and binaries, documentation and a variety of other information in case of a catastrophic event at the primary center such as fire or earthquake. In 2009 the system was relocated to the UNAVCO facility in Boulder, Colorado to take advantage of the higher bandwidth at that location. In 2013 the DMC transitioned the Ac-
tive Backup concept to a fully functioning Auxiliary Data Center (ADC) where ultimately all of the services of the primary IRIS data center would be replicated and available at all times. The first auxiliary center is located at the Livermore Valley Open Campus (LVOC) at Lawrence Livermore National Laboratory (LLNL). The location of the ADC allows it to be connected to the High Performance Computing (HPC) environment at LLNL and helps in IRIS’ goal to place the entire IRIS archive in the proximity of supercomputing resources. The key development that enabled IRIS to do this relies on the Service Oriented Architecture (SOA) that IRIS has developed. The replication of the DMC functionality was greatly aided by relying on web services that have been adopted by the International Federation of Digital Seismograph Networks (FDSN) as well as a small number of additional services that IRIS has developed and uses internally as well as exposing them external to the DMC. Most of IRIS’ applications use these web services and it is much simpler to deploy systems at multiple locations once the web service infrastructure is deployed. This infrastructure is fully deployed at the ADC and the ADC services function identically to the services at the primary DMC. In the future it is IRIS’ plan to leverage an external load balancing system that will seamlessly route some requests to the primary DMC and others to the ADC based on business rules such as how busy one system is over the other system, geographic proximity to one or the other services, or other business rules yet to be determined. Currently the global load balancing is not in place. It is possible to access the web services and other installed applications at the ADC if the URL is known. In fact we are currently running the MUSTANG QA system at both locations leveraging the web services internally so the proof of concept has been heavily exercised. Specifically IRIS services that operate at both the DMC and
Published by Copernicus Publications on behalf of the European Geosciences Union.
32
T. Ahern et al.: New Developments at the IRIS DMC
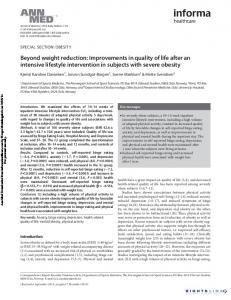
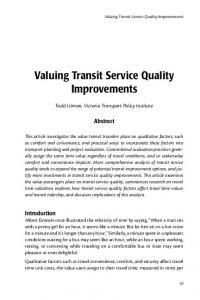
Figure 1. The new MUSTANG system not only identifies potential problems with data quality but also builds in a feedback loop between MUSTANG and network operators. This feedback will sometimes be able to help resolve the problem that caused the identified problem and later MUSTANG estimates should verify the improvement in the data quality.
the ADC include the BUD real time system, the ring server that replicates files across a computer network and so in principle data ingestion from any data source can take place at either the DMC or the ADC. However real time data ingestion for real time streams takes place primarily at the DMC and would have to be switched to the ADC manually in the event of a failure. Support for access tools such as BreqFast, WILBER3, SeismiQuery, WebRequest, and the new MUSTANG system all operate at both the DMC and the ADC. In principle it would be possible to install additional ADCs in the US or around the world if resources were available.
2
Enhanced quality assessment of time series data
At the current time a very ambitious project called MUSTANG is soon to enter operational status at the IRIS DMC and the ADC. As new time series arrive at IRIS either in real time or by delayed file transfer procedures, a system of roughly 50 metric calculators derives statistical metrics that characterize a day’s worth of waveform data. Such things as gaps per day, overlaps per day, means, RMS values, medians, extreme values and other statistical measures are estimated by MUSTANG algorithms. Additional metrics that are calculated include measures of latency, power spectral density, power density functions and a variety of other time series comparisons between multiple time series (collocated sensors, comparisons to nearby stations, comparisons to synthetic tide estimates are calculated) as well as the signal to noise ratio for windows of data recorded during larger events. The entire list of metrics being calculated can be found at http://service.iris.edu/mustangbeta/metrics/1/query and the list will evolve dynamically as new ways of looking at data quality are determined with time. Figure 1 shows the basic concept of MUSTANG. Time series enter the DMC, metric calculators are run, normally about one day after real time, and all relevant metrics are estimated from the new data. These metrics are stored in Adv. Geosci., 40, 31–35, 2015
a PostgreSQL database and are made accessible through a set of web services similar to the other data access web services that are available at IRIS and some other FDSN centers. Data technicians are alerted to patterns in a single metric or a combination of multiple metrics that are indicative of a data problem. The technicians will validate the data problem, try to identify the source of the problem and then communicate with knowledgeable people at the seismic network from which the data came. At the current time (November 2014) MUSTANG is in beta mode but appears stable and will enter a production phase early in 2015. The system is presently being used to calculate all the metrics for all the relevant data in the archive. By the end of 2014 we anticipate that all metrics will have been calculated for IRIS generated data (_GSN, _PASSCAL, _OBSIP, _US-Array) as well as significant portions of the data from networks that share their data with IRIS. A coverage service will be available that allows one to quickly assess whether or not metrics have been calculated for a specific network, station, channel for a given time period. A sophisticated recalculation component of MUSTANG is being developed to know when to recalculate metrics. This can happen when any of the following occur: (1) a new version of the time series is received, (2) relevant metadata is updated, or (3) the algorithm itself changes. When completed the automated recalculation engine will trigger recalculation of just those metrics that need recalculation. When complete, metrics should not become stale for any reason and users will have confidence that the metrics they view are correct and represent the metadata and waveform state in the holdings of the DMC. Ultimately we intend to make use of the various metrics to enable data requestors to filter the data they receive from a request to the IRIS DMC based on the values of the MUSTANG metrics.
www.adv-geosci.net/40/31/2015/
T. Ahern et al.: New Developments at the IRIS DMC
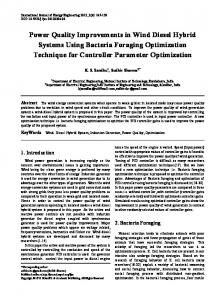
Figure 2. The MUSTANG Data Browser allows visualization of metrics. For instance Box Plots for an entire network can be displayed and quickly allow the operator of a specific seismic network to identify specific stations that have problems indicated by any specific metric. This example shows a boxplot for three stations of the IRIS/USGS network FDSN Network Code IU. The box visible for the topmost station shows the 25th, 50th (median) and 75th percentile range of the gaps per day metric. By looking at long time spans for entire networks in one display, a network analyst can quickly identify problematic stations within their network. The small circles show outliers for the given station.
3
33
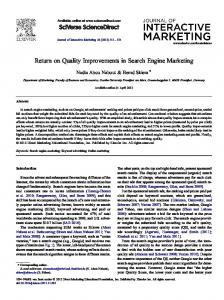
Figure 3. The MUSTANG Data Browser can also display values of metrics for arbitrary lengths of time as requested by a user. The picture above shows the latency for the vertical channel from the GSN station in Albuquerque, New Mexico, USA. The latency is shown for a time range of 14 months in this figure. In the new MUSTANG system latency is estimated once every 4 h that allows most latency problems to be detected and when possible, corrected.
Federation of seismological data centers
Seismological activities have been coordinated globally since the late 1980’s by the FDSN (www.fdsn.org). Driven be coordinated definitions of web services and standardized XML schema (Casey and Ahern, 2011), in Working Groups II and III of the FDSN, identical services have now been deployed at 3 data centers in the United States and 6 centers in Europe. In the US, the participating data centers include (IRIS, the Northern California Earthquake Data Center (NCEDC), and the National Earthquake Information Center (NEIC) of the US Geological Survey (USGS). In Europe the participating centers include the French National Data Center (RESIF), the Swiss Seismological Service in Zurich (ETHZ), the Italian National Center for Geophysics and Volcanology (INGV), the ORFEUS Data Centre in the Netherlands, the GEOFON data center in Germany, and the International Seismological Centre in the UK. Each of these centers has exposed FDSN standard web services that accept identical parameters as a query string in the URL as well as delivering the same FDSN approved XML document resulting from the query. These XML definitions include StationXML for metadata about seismic stations and channels and QuakeML for returning catalogs of earthquakes and other seismic events. Waveform data are returned through identical services in miniseed format defined by the FDSN or as a variety of other formats that include picture files, sound files, or ASCII files. Waveforms are not returned as XML. www.adv-geosci.net/40/31/2015/
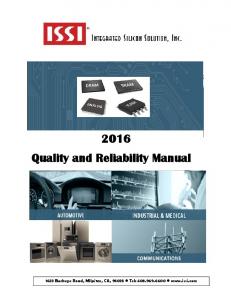
Figure 4. Probability Density Function (PDF) Plots (McNamara and Buland, 2004). The new MUSTANG Data Browser continuously generates estimates of the power spectral density functions. From these raw values, PDFs can be generated for specific networkstation-channels for arbitrary time spans. PDFs are an extremely powerful tool that characterizes the noise across a broad range of frequencies for a given seismic station. When compared to the Low Noise Model (shown by the bottommost grey line in the above figure) a stations performance can easily be ascertained.
The key to the federated services is that other than the leftmost portion of the URL (that points to a specific center), the right portion of the URL is identical and the resulting XML document or miniseed data are also identical. This simplifies the manner in which an external user can interact with all of the federated centers. IRIS is also developing a federator. The federator works as follows. On a routine basis the IRIS federator queries the Adv. Geosci., 40, 31–35, 2015
34
T. Ahern et al.: New Developments at the IRIS DMC
Figure 5. These maps show the various FDSN services that have been placed into operation at various data centers in the US and Europe. The red diamond indicates that time series services are in place; blue indicates that station metadata services are in operation, and yellow means that FDSN event services are in operation.
holdings of all known federated centers to determine the various time series holdings at each center. It databases this information in a PostgreSQL database at the DMC. An external client that could be written in a variety of languages can formulate a request for data in a specific region, bounding box, or within a specific distance of a point. The IRIS federator returns information from which specific URLs to retrieve the waveform and metadata directly from various federated data centers that hold the information.
4
Figure 6. The IRIS Federator Catalog Web Service. The IRIS federator catalog is a web service that enables a client application to recover data of interest from the federated system. Periodically, the IRIS federator queries (red arrows) all of the known external data centers (small yellow circles) and stores the state of data holdings of the federated system in a PostgreSQL database. Using the federator catalog web service to perform client-side federation is a 2-step process: (1) a user client submits a request to the catalog service (blue arrow) to extract a list of data centers and data that match the query and (2) the user client submits the requests directly to the identified data centers. The federator can be queried in a manner whereby all instances of a seismogram can be returned or it can use a powerful set of business rules to return data from the “authoritative” center only. If this system proves effective in meeting data user’s needs it will solve many aspects of accessing the data wanted when those data are managed in multiple centers around the world.
EarthCube and cross disciplinary data integration
As part of an EarthCube Building Block project, IRIS is seeing if the simple web services concepts developed within seismology can be extended to other geoscience communities. Driven by a use case in geodynamics, and working with multiple partners in the US our goal is to ease data discovery, data access, and data usability across several fields in the earth sciences. The Geoscience Web Services (GeoWS) building block, advocates for standard approaches in the development of simple web services that include standardized parameter naming conventions, URL usages, similar documentation styles, and availability of URL builders to show how URLs to access services can be properly formed, Our funded partners include Caltech (GPLATES), Columbia University (marine geoscience data), IRIS (seismology), SDSC (hydrology), UNAVCO (geodesy), and UNIDATA (atmospheric sciences). These six groups will expose their data holdings through similar style web services. Simultaneously, IRIS is working directly with other groups in geoscience to expose their data holdings through simple web services. These include (1) superconducting gravimeter data, (2) gravity data, magnetic data, structural geology data sets, volcanological data and data from three other large facilities including the National Geophysical Data Center, Ocean Observatory Initiative (OOI), and NEON the National Ecological Observatory Network. Adv. Geosci., 40, 31–35, 2015
While we are certain progress will be made we are also aware that it is impossible to make interdisciplinary data seamlessly accessible across these 14 domains. For this reason we are working closely with the Global Earth Observation System of Systems (GEOSS) brokering group that will offer mediation services across a subset of these domains. If successful it will ease the task of integration of data from these 14 domains. Acknowledgements. Much of the work involved in these projects drew heavily upon the work of the FDSN working groups especially Working Groups II and III. In addition to WG II chair Reinoud Sleeman of ORFEUS, we would like to particularly thank Marcelo Bianci at GFZ as well as Luca Trani and Alessandro Spinuso at ORFEUS for their very active involvement and timely comments. We would also like to acknowledge the support received by Steve Bohlen, Bill Walter, and Jennifer Aquillino of Lawrence Livermore National Laboratory of the US Department of Energy for helping with the details of establishing the ADC at LLNL. The developments presented in this paper were supported by several grants from the National Science Foundation including EAR-1261681 (SAGE), ICER-1343709 (EarthCube), and ICER1321600 (COOPEUS) Edited by: D. Pesaresi Reviewed by: two anonymous referees
www.adv-geosci.net/40/31/2015/
T. Ahern et al.: New Developments at the IRIS DMC References Ahern, T. K.: The FDSN and IRIS Data Management System: Providing easy access to terabytes of information, International Handbook of Earthquake and Engineering Seismology, 81, 1645–1655, 2003. Casey, R. and Ahern, T.: Web Services for Seismic Data Archives, Geoinformatics: Cyberinfrastructure for the Solid Earth Sciences, Cambridge University Press, Part V, 13, 210–223, 2011.
www.adv-geosci.net/40/31/2015/
35 McNamara, D. E. and Buland, R. P.: Ambient Noise Levels in the Continental United States, B. Seismol. Soc. Am., 94, 1517–1527, 2004.
Adv. Geosci., 40, 31–35, 2015