Improvements in the visualization of segmented areas of patterns of dynamic laser speckle Lucía I. Passoni, Ana Lucía Dai Pra, Adriana Scandurra, Gustavo Meschino, Christian Weber, Marcelo Guzmán, Héctor Rabal, Marcelo Trivi {lpassoni,daipra,scandu,gmeschin,marcelo.guzman}@fi.mdp.edu.ar,
[email protected],
[email protected],
[email protected] Facultad de Ingeniería. Universidad Nacional de Mar del Plata Centro de Investigaciones Ópticas CIC-CONICET La Plata.
Abstract. This paper proposes a method to visualize different regions into image of biospeckle patterns using Self-Organizing Maps. Images are obtained from sequences of laser speckle images of biological specimens. The dynamic speckle is a phenomenon that occurs when a beam of coherent light illuminates a sample in which there is some type of activity, not visible, which results in a variable pattern over time. Self-Organizing Maps have shown an efficient behavior for the identification of regions according to the activity of the phenomenon involved. In this paper we show results obtained in the segmentation of regions in corn seeds, particularly the detection of the floury zone. Keywords: Dynamic Laser Speckle, Biospeckle, Self-Organizing Maps, Corn seed.
1
Introduction
The laser dynamic speckle is an optical phenomenon produced when a laser light is reflected from an illuminated surface undergoing some kind of activity. The activity is evident when the sample changes its properties due to diverse physical reasons. This behavior can be observed in biological process such as seeds viability [1], bacteria activity [2], fruits bruising [3], and non-biological processes such as drying of paints [4], and corrosion [5]. Dynamic laser speckle patterns have been used to assess issues of interest in different fields, like biology (seed analysis, animal sperm motility), medicine (capillary blood flow), industry (discovering bruising in fruits, painting drying, monitoring of ice cream melting, yeast bread, gels), etc. Different descriptors have been proposed to evaluate the activity; they are characterized by their computational cost and aptitude to detect activity in particular cases [6]. A novel Descriptor based in Fuzzy Granularity (FGD) has been proposed by Dai Pra et al. [7]. It exhibits low computational cost and good performance when applied to discover different dynamic phenomena [4]. Over the years, corn was finding different uses depending on the physico-chemical composition that defines the type of grain. The quality of maize grain is associated with both physical composition, which determines the texture and hardness, as to their adfa, p. 1, 2012. © Springer-Verlag Berlin Heidelberg 2012
chemical composition, which defines the nutritional and technological properties. The kernel of corn consists of four main parts, where the endosperm is 80-85%, 10-12% embryo, the pericarp 5-6% and 2-3 percent aleurone. The chemical composition of the endosperm is what sets different grain shapes and physical characteristics, which enable the commercial rates [8, 9]. There has been an explosion of interest among seed corn buyers about the differences in the type of starch found in hybrids. What these discussions are referring to is the amount of floury (also called soft or dent) endosperm versus vitreous (also called hard or flinty) endosperm [10]. The method commonly used to assess the proportion of hard endosperm is the flotation test [11]. An aqueous solution of sodium nitrate is used, achieving a specific gravity of 1.25 to water kept at a temperature of 35 °C. This method allows comparing the density of various batches of corn kernels; it is based on the principle that the hard grains are of greater density and therefore such grains float in lower proportion than the grains of lower density in the solution of sodium nitrate. Quantifying the floating grains does not allow determine the amount of endosperm starchy endosperm and vitreous grains presenting a given sample. That is why this paper entered the optical field to determine the possibility of using the method of speckle in such a disquisition. Computational Intelligence methodologies have been previously used for processing speckle image sequences. The design of decision models with Artificial Neural Networks, Fuzzy Granular Computation and Genetic Algorithms is addressed in [12]. Self-Organizing Maps (SOM) were used to characterize a chemotaxis assay in [13]; where regions were neatly differentiated according to the bacterial motility within the sample. In [14] SOMs were proposed as clustering methods, when the sensitivity of the activity measurement of dynamic speckle images needs to be improved, by using the mean energy of the wavelet coefficients of the intensity series as a set of descriptors . In this work we propose the use of time domain descriptors together with SOMs to discriminate the speckle dynamic activity of the endosperm embryo. The aim is to provide a tool to be used jointly with digital image processing methodologies to determine areas of the corresponding endosperm fractions. The activity of the endosperm is focused on its two majority parties (floury and vitreous endosperm), and the issue of successfully automating the identification of these areas would be of potential importance for trade and industrialization.
2
Methodology
In this section we propose a SOM-based model that uses several descriptors (features) of laser speckle patterns to identify areas of corn seeds images. 2.1
Equipment setup, signal acquirement, and feature extraction
Assays were performed in the laboratory belonging to the Center of Optical Research (CONICET-CIC CIOp). They were performed on maize grains known at industry as
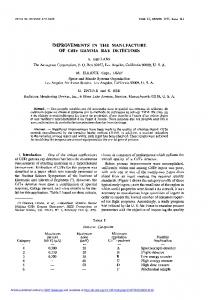
flint, on 10 specimens from the same sample. To carry out the measures, every grain of corn was wet for 12 hours, then cut them lengthwise and cut surface. They were illuminated with an expanded laser attenuated He-Ne (10 mW) at room temperature (approx. 20 °C). Using a CCD camera and a computer with digital image processor, a sequence of 300 images for each sample tested was recorded and filmed at 8 bits resolution and 400 x 400 pixels size, with sampling frequency of approximately 1 Hz. Fig. 1 shows a schematic of the experimental unit used.
Fig. 1. Optical setup
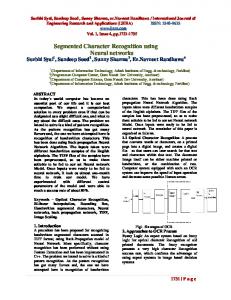
Intensity from each image pixel of the image stack was converted into a time series (Time History Speckle Patterns, THSP) to be processed by computing different descriptors, as shown in Fig. 2. So, the feature extraction was performed over the time series of intensity level in a pixel wise basis, computing numerical descriptors for every pixel location. As stated by Trivi [16] the speckle is a stochastic effect and time series of laser speckle patterns are the measurable evidence of this stochastic process. 200 180 160 140 120 100 80 60 40 20 0
0
50
100
150
200
250
300
Fig. 2. Left: Image stack, where a time series of laser speckle pattern of the (x,y) pixel in N images is pointed. Right: Time series of the intensity variation as the dynamic speckle pattern of a (x,y) pixel
There are many descriptors that have been developed to characterize biospeckle [1]. We propose the use of three descriptors that deal with the time domain, in order to reduce computational cost, compared with those processed signals in the frequency
or time-frequency domains. They are the Average of Subtraction of Consecutive Images, the Dynamic Range Descriptor and the Fuzzy Granular Descriptor. Subtraction Average of consecutive pixel intensities One of the simplest descriptor is the Subtraction Average (SA) of two consecutive elements of the time speckle pattern [6]. N −1
S A= ∑ I k ( x, y) − I k +1 ( x, y) N − 1 ,
(1)
k =1
where ( x, y ) is the image pixel location and N is the amount of images stacked. Dynamic Range Descriptor Dynamic Range descriptor was computed as the difference between the maximum and the minimum value of the intensity in each evaluated time series. The potential of this feature lies in its speed and ability to discriminate regions of coarse different activity [8].
= DR max { I ( x, y ) k } − min { I ( x, y ) k } k =1, N
k =1, N
(2)
Fuzzy Granular Descriptor The Fuzzy Granular algorithm is based on granular computing. It can be applied to both stationary and non-stationary cases, allowing monitoring the phenomenon in almost real time. According to the histogram of the image stack, different types of granules are identified; they are detected and counted, giving a descriptor that weights the series changes through the number of granules in a fixed time lapse [7]. The fuzzy sets theory, making reference to vague and overlapped concepts, allows defining granules with this property. To generate information granules several fuzzy sets are defined into the intensity values domain of the THSP. For intensity values I ( x, y ) , a fuzzy set is defined by a membership function µ ( I ( x, y )) that takes gradual values in the real interval [0,1] (Eq. 3). Trapezoidal functions µ dark , µ medium and µlight with media overlapping are adopted, where:
µc ( I ( x, y )) ∈ [0,1], with c ∈ {dark , medium, light} .
(3)
Each granule of I ( x, y ) signal is defined as a continuous sequence of elements belonging to the same intensity concept. The Fuzzy Granular Descriptor is the result of applying Eq. 4 to each I ( x, y ) signal.
3 = QN = suck , c µc ( I k ( x, y ) ) / N , k 1, 2..., N ∑ c =1 0 1 if µc ( I k −1 ( x, y ) ) ≠ 0 ∧ µc ( I k ( x, y ) ) = suck , c = else 0 2.2
(4)
Pseudo-coloring by Self-Organizing Maps
The Self-Organizing Map proposed by Kohonen [17] is a popular non supervised neural network model. A SOM quantizes the data space of training data and simultaneously it performs a topology-preserving projection of the data space onto a regular neuron (or cell) grid. SOM structure is usually a regular 2-dimensional grid of neurons, though they can be arranged in 1-dimensional (line) or 3-dimensional (space). Considering Ddimensional input data, each neuron i, is connected to the inputs by D weights. From another point of view, these weights can be seen as D-dimensional reference vectors contained into the cells. The set of reference vectors is called the SOM codebook. Neurons of the map are related to adjacent neurons only by a neighborhood functional definition. There are no weights connecting neurons each other. During each training step, one sample vector from the input data set is taken randomly and a similarity measure is computed between the input vector and all the codebook vectors. The cell whose weight vector has the greatest similarity with the input sample is selected as the Best-Matching Unit (BMU). The similarity is usually defined by means of a distance measure, typically Euclidean distance. After finding the BMU, the codebook is updated. The reference vectors of the BMU and its topological neighbors (according to the neighborhood function) are changed in order to be “closer” to the input vector in the input space. This adaptation procedure stretches the BMU and its topological neighbors towards the sample vector. The adaptation is given by:
W j (n + 1) ← W j (n) + η (n) h ji (n) X (n) − W j (n) ,
(5)
where n is the iteration number, j is the neuron index that is considered in the current iteration, W j is the prototype vector of cell j, η (n) is a learning rate, h ji (n) is the neighborhood function defined centered on BMU, and X (n) is the vector of the speckle patterns presented . Usually, both learning rate and the neighborhood function radius are decreasing as iterations progress. Once trained, a SOM offers different ways to be visualized and analyzed. A matrix of distances between the codebook vectors of the cells and their neighbors is widely used [18]. Data samples can be projected onto the SOM by their BMU. Similar data will be projected in near cells. In order to evaluate the quality of the map, two kinds of errors are considered: the quantization error and topographic error [19]. They tend to minimize when the map vectors perform an organized projection of the training pattern according to a similarity criterion.
Once the map is properly trained, colors can be assigned to cells according to the distance between prototype vectors with a palette generated heuristically. The color coding is such that topological nearby cells will have similar colors and those far according to this criterion will have distinct colors. Using this colored map, a color can be assigned to each input data according their BMUs. To assign colors, we followed the next steps: • Data are projected into a 2-dimensional space via the Principal Component Analysis (PCA). • Codebook is projected according to the previous analysis. • PCA codebook coordinates are scaled in the [0, 1] range. • Colors are assigned to each cell of the PCA codebook coordinates using a RGB palette, selected to give a well differenced picture at most of LCD monitors. The k-means clustering algorithm (using k-regions of interest) is performed to evaluate numerically the SOM colored regions [20]. In this way we achieve a colored map that will serve as a reference for coloring a new image based on where the descriptors of the temporal evolution of each ( x, y ) pixel impact as a result of consulting the SOM.
3
Results
Temporal descriptors were computed for all samples. Thus SA, DR and FGD descriptors were obtained for the stack of 300 images of 400x400 pixels, achieving 1,600,000 patterns vectors. In order to balance the type of information, part of the image background was trimmed, given that in the acquisition stage the background was rather oversized. Finally images of 300x300 pixels were computed. Fig. 3 shows images corresponding to descriptors of a specimen. Note that the discrimination ability in the four targeted areas (background, embryo, floury endosperm and vitreous endosperm) is not achieved with any of them.
Fig. 3. Descriptor Images and the four region of interest: Vitreous Endosperm (VE), Floury Endosperm (FE), Embryo region (ER) and background (BG). Left: subtraction Average Descriptor; middle: dynamic Range Descriptor; right: Fuzzy Granular Descriptor
The SOM toolkit for Matlab®, from the Laboratory of Computer and Information Science (CIS) at the Helsinki University of Technology, was used. In order to determine the SOM dimension, a growing configuration for increasing dimensions of the grid size was proposed, with a stopping criterion of minimizing the topographic error, obtaining a good projection of similar vectors in neighboring cells. Linear codebook initialization was performed. The dimension was determined as a 10x10 cell array. The number of iterations was set to 100 and the neighborhood Gaussian function was used. The learning function η(n) (“inverse”) was defined as in Eq 6, with η0=0.5.
η ( n) =
η0
100n 1+ 50
,
(6)
The three inputs vectors components were the Subtraction Average, the Dynamic Range and the Fuzzy Granular Descriptor, all of them normalized according their variance. Definition of map size was made disposing of all data generated by the 10 trials for a total of 90,000 vectors of three variables, generated by the images of 300x300 pixels. We carried out a scheme of training and test by a cross-validation process. Since there were 10 different experimental tests, we performed a leave-one-out scheme, with 10 runs, training with 9 cases and testing with the left out case. Each time, a cluster analysis was performed, with k-means algorithm (k=4, 4 targeted regions of interest) as shown in Fig. 4, achieving a good average of the Davies-Bouldin index. The 10x10 codebook vectors are colored according to the distance between prototype vectors with a RGB palette.
Fig. 4. Left: SOM colored map. Right: K-means partition labeled with regions of interest.
Fig. 5 shows five corn seed images colored according with the labeled regions. To evaluate the goodness of the proposal we used expert's opinion, who considered, observing the prepared seeds and the pseudo-colored images of the processed speckle patterns that endosperm areas were properly identified. Also he noted that the methodology is considered valid to automate the calculation of the fractions of floury and vitreous endosperm of seeds.
Fig. 5. Five specimens of flint corn seed, pseudo-colored according to the regions of interests given by the SOM codebooks.
As shown in Fig. 5, pseudo coloring of corn flinty seeds enables differentiating the background region (blue color), that is highly spaced in the codebook from live parts. Endosperm starchy region is distinguished perfectly in a purple coloration, as also the region of the embryo (yellow-green zone) and the vitreous endosperm (orange zone). Thus, the four classes can be perfectly discriminated, a fact that was not possible using only one of the time domain descriptors.
4
Conclusions
In this work we propose the use of Self-Organizing Maps to visually identify diverse regions in corn seeds. The methodology proposed based in an optic approach is a new method, since the existing is an indirect estimation as a function of the capacity to float of the grains due to grain composition. Particularly, it is addressed the segmentation of regions of the endosperm embryo with the aim to design an automated process to compute fractions of interest. The results obtained by processing a set of specimens of flint corn are very encouraging. This proposal is novel in the field of agricultural technology and aims to provide a methodology for assessing the quality of corn based on the content of the endosperm. In this sense, the conjunction of an optical acquisition process based on the emission of coherent light and Computational Intelligence techniques have shown synergy in the creation of innovative processes applied to real problems of socioeconomic impact.
5
References
1. R. A. Braga, I. M. D. Fabbro, F. M. Borem, G. Rabelo, R. Arizaga, H. J. Rabal, M. Trivi, Assessment of seed viability by laser speckle techniques, Biosystems Engineering 86 (3) (2003) 287 { 294. doi:10.1016/j.biosystemseng.2003.08.005. 2. H. Sendra, S. Murialdo, L. Passoni, Dynamic laser speckle to detect motile bacterial response of pseudomonas aeruginosa, Journal of Physics: Conference Series 90 (1) (2007) 012064. 3. M. Pajuelo, G. Baldwin, H. Rabal, N. Cap, R. Arizaga, M. Trivi, Biospeckle assessment of bruising in fruits, Optics and Lasers in Engineering 40 (12) (2003) 13 { 24, Optics in Latin America part II. doi:10.1016/S0143-8166(02)00063-5.
4. A. L. Dai Pra, L. I. Passoni, H. J. Rabal., Fuzzy granular computing and dynamic speckle interferometry for the identification of different thickness of wet coatings., Infocomp, Journal of Computer Science 8 (4) (2009) 45{51. 5. T. Fricke-Begemann, G. Gulker, K. D. Hinsch, K. Wol_, Corrosion monitoring with speckle correlation, Appl. Opt. 38 (28) (1999) 5948{5955. doi:10.1364/AO.38.005948.12 6. H. J. Rabal, R. A. Braga (Eds.), Dynamic Laser Speckle and Applications, CRC Press, 2008. 7. A. L. Dai Pra, L. I. Passoni, H. Rabal, Evaluation of laser dynamic speckle signals applying granular computing, Signal Processing 89 (3) (2009) 266{274. doi:10.1016/j.sigpro.2008.08.012. 8. Drury, Suzanne M.; Reynolds, Tracey L.; Ridley, William P.; Bogdanova, Natalia ; Riordan, Susan ; Nemeth, Margaret A.; Sorbet, Roy; Trujillo, William A. and Breeze, Matthew L. 2008. Composition of Forage and Grain from Second-Generation Insect-Protected Corn MON 89034 Is Equivalent to That of Conventional Corn (Zea mays L.). J. Agric. Food Chem., 56 (12), pp 4623–46302. 9. Bragachini, M.A., Casini, C., Ustarroz, F., Saavedra, A.E., Mendez, J.A. & Errasquin, L. 2010. La calidad del grano de Maíz. En: Maíz Cadena de Valor Agregado. E.E.A. INTA Balcarce PRECOP II. Actualización técnica Nº 54: 9-10. 10. Bill Mahanna and Ev Thomas https://www.pioneer.com/home/site/us/menuitem. b8381b50868d5c8176f576f5d10093a0/ April 2012 11. Lepes, I.T., R.M. Miotto, A.V. Cedro y O.E. Ruegg; Test de flotación en maíces duros argentinos. I Congreso Nacional de Maiz. 287-298. Pergamino, Argentina (1976). 12. Guzman M, Meschino GJ, Dai Pra AL, Trivi M, Passoni LI, Rabal H; Dynamic laser speckle: decision models with computational intelligence techniques. Speckle 2010. 0001;():738717-738717-8. 13. P. Etchepareborda, A. Federico, and G. Kaufmann, "Sensitivity evaluation of dynamic speckle activity measurements using clustering methods," Appl. Opt. 49, 3753-3761 (2010). 14. Meschino, G.; Murialdo, S.; Passoni, L.; Rabal, H.; Trivi, M.; , "Biospeckle image stack process based on artificial neural networks," Engineering in Medicine and Biology Society (EMBC), 2010 Annual International Conference of the IEEE , vol., no., pp.4056-4059, Aug. 31 2010-Sept. 4 2010 doi: 10.1109/ IEMBS.2010.5627620 15. R.A. Braga, W.S. Silva, T. Sáfadi, C.M.B. Nobre, Time history speckle pattern under statistical view, Optics Communications, Volume 281, Issue 9, 1 May 2008, Pages 24432448, ISSN 0030-4018, 10.1016/j.optcom.2007.12.069. 16. Trivi M, Dynamic Speckle in Dynamic Laser Speckle and Applications. H. J. Rabal, R. A . Braga (Eds.) , CRC Press, 2008Nov 2008 , 21 -51 17. Kohonen, T.: Self-Organizing Map. Springer-Verlag. (1995) 18. Vesanto, J., Sulkava, M.: Distance Matrix Based Clustering of the Self-Organizing Map. Proceedings of the International Conference on Artificial Neural Networks, (2002) 19. Kiang, M.Y.: Extending the Kohonen self-organizing map networks for clustering analysis. Computational Statistics & Data Analysis. 38, 161-80 (2001) 20. Vesanto, J., Alhoniemi, E.: Clustering of the self-organizing map. IEEE Transactions on Neural Networks. 11, 586-600 (2000)