Home
Search
Collections
Journals
About
Contact us
My IOPscience
Improvements to the User Interface for LHCb's Software continuous integration system.
This content has been downloaded from IOPscience. Please scroll down to see the full text. 2015 J. Phys.: Conf. Ser. 664 062025 (http://iopscience.iop.org/1742-6596/664/6/062025) View the table of contents for this issue, or go to the journal homepage for more
Download details: IP Address: 86.85.110.108 This content was downloaded on 13/03/2016 at 21:40
Please note that terms and conditions apply.
21st International Conference on Computing in High Energy and Nuclear Physics (CHEP2015) IOP Publishing Journal of Physics: Conference Series 664 (2015) 062025 doi:10.1088/1742-6596/664/6/062025
Improvements to the User Interface for LHCb’s Software continuous integration system. M.Clemencic, B.Couturier, S.Kyriazi E-mail:
[email protected] Abstract. The purpose of this paper is to identify a set of steps leading to an improved interface for LHCb’s Nightly Builds Dashboard. The goal is to have an efficient application that meets the needs of both the project developers, by providing them with a user friendly interface, as well as those of the computing team supporting the system, by providing them with a dashboard allowing for better monitoring of the build job themselves. In line with what is already used by LHCb, the web interface has been implemented with the Flask Python framework for future maintainability and code clarity. The Database chosen to host the data is the schema-less CouchDB[7], serving the purpose of flexibility in document form changes. To improve the user experience, we use JavaScript libraries such as JQuery[11].
1. Introduction The LHCb Software[1] is built and tested under the continuous integration system of Jenkins[2]. The web page that provides the monitoring of the builds is the LHCb’s Nightly Builds Dashboard[4] summarizing the status of the jobs running in Jenkins[2]. Both the developers and the project managers need to have a quick overview on the status of the nightly builds. The content of the original Nightly Build Dashboard[4] is to support the Nightly Build System[3]. The Nightly Build System[3] configuration is defined in terms of slots, projects and platforms. A slot is a consistent set of inter-related software projects that should be built and tested together. The configuration of a slot includes, in addition to the list of configured projects, the list of platforms the slot should be built for. It was suggested that the Nightly Builds Dashboard[4] should have a summary of the current state of the slots. The Statistics Web Page offers a new way of keeping up with the status of the builds. The content is completely dynamic and it’s direct synchronization with CouchDB[7] guarantees for the reliability of the content. 2. Design & User Interface The design principles that are being followed, are to keep the same pattern on the web pages, in order to promote the concept of a family of web pages. The content would be dynamic and expressed in a more visual way such as images, buttons, boxes and dynamic components to enable the user to interact and exclude extra information, focusing on her desired content. Jenkins is set to produce reports in the form of JSON[8] files. The files get exported in CouchDB[7], while given a special identifier to establish the uniqueness, and a short description to separate the type of content of each file. The Release Web Page[6] is connected with the ”nightlies-release” database and the type of the files is ”lhcb-release”. Under the design Content from this work may be used under the terms of the Creative Commons Attribution 3.0 licence. Any further distribution of this work must maintain attribution to the author(s) and the title of the work, journal citation and DOI. Published under licence by IOP Publishing Ltd 1
21st International Conference on Computing in High Energy and Nuclear Physics (CHEP2015) IOP Publishing Journal of Physics: Conference Series 664 (2015) 062025 doi:10.1088/1742-6596/664/6/062025
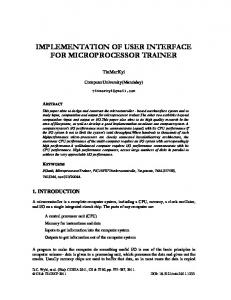
Figure 1. Nightly Builds new applications document of the ”nightlies” database, the process of the documents takes place through the views. The mapping functions are written by the developers and connected with the applications. The Statistics application which is written and developed under Flask[9], maps the returned results of the view functions into model objects, and they end up being processed in the JavaScript part. The Release Web Page[6] is produced following the same code with LHCb’s Nightly Builds Web Page[4]. 2.1. Statistics Web Page The concept was to create a minimal one page application that is related to the Nightly Build Dashboard[4] but can also be used separately by the administrators. 2.1.1. Design The page is now divided into three parts, where each one could express a different piece of information. Those three parts can also be separated into two more general divisions.
Figure 2. Upper half of the page
2
21st International Conference on Computing in High Energy and Nuclear Physics (CHEP2015) IOP Publishing Journal of Physics: Conference Series 664 (2015) 062025 doi:10.1088/1742-6596/664/6/062025
• The upper half part of the page contains two sub-divisions. It is aiming to provide the user a quick view of what is being build or not, and immediately alarm the administrators for dysfunctional slots or abnormal time measurements. – The left-one corresponding to a Pie Chart of today’s builds showing the percentage of the slots finished, started but not finished and those that are unstarted yet. – The right-one, a line chart that shows the completion time of the builds during the past seven days, and today’s time depending on the given status at that day. • The bottom part consists of a slide-show of pie charts showing all the slots. Each piece of the slide-show makes up for an instance of the slot being build at the given day. The original slide-show allows a view of all the slots requested to be build. 2.1.2. Features
The one page application offers many features that the user can explore:
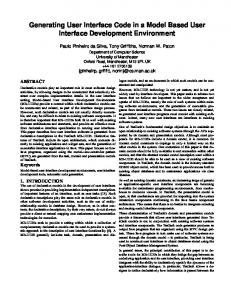
• The user is allowed to load a different type of slide-show if he interacts with the pie-chart, hovering over a piece of the chart and selecting the option ’LOAD SLOTS’. This action changes completely the composition of the slide-show and only pie-charts representing the specified category are shown.
Figure 3. Select a piece of the pie and change the slots in the slide- show • The user can select one of the pie charts depending on her preference and then she will be able to see the chart opening between the right and the left graph of the upper part as a more detailed window.
Figure 4. Choose a slot from the slide-show and focus - Choose one of the platforms and see the timeline with more details.
3
21st International Conference on Computing in High Energy and Nuclear Physics (CHEP2015) IOP Publishing Journal of Physics: Conference Series 664 (2015) 062025 doi:10.1088/1742-6596/664/6/062025
• The window features many components such as the pie chart that the user can interact with by choosing the option to ’LOAD PROJECTS’ and that creates a new slide-show to present the projects. • An other component is the slide-show of the platforms for the specific slot, the user can select a platform and then he can see the projects grouped by that platform and the duration of the project build and the project tests. • The user can also hover the line chart and see details about the duration of the builds. One other feature that the user can interact with is the focusing on one of the slots in the slide -show. The idea of the slide-shows is frequently used to hide unnecessary information. This way the web page has a mode appearance although it is detail-oriented as someone can search for more information as she goes on. 2.2. Release Web Page 2.2.1. Design The Release Web Page[5] is yet another dashboard that is connected to a different type of the LHCb’s Builds, the ”nightlies-release” database. The Release Web Page creates a dynamic content by extracting information from CouchDB[7] using tables to represent each slot.
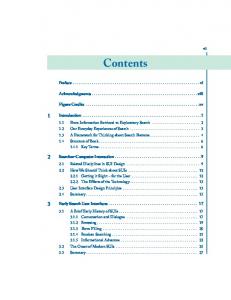
Figure 5. Design and Features on the Release Web Page.
2.2.2. Features
A short description of the page:
• The original layout of the dashboard interface was kept in the same format • In contrast to the Nightlies Dashboard[4] the user is provided with the option to have a control over the slots being built by Jenkins[2]. The button ’Rebuild ’ is connected with the action of triggering a new job to start in Jenkins. • The user can also be redirected to the rpms[15] directory and have access to the build logs. • One other option that the user is provided with is the link icon that filters the rest of the slots that can direct anyone that is provided with the link to a page focusing on the slot selected. This feature was added for a more clear way of communicating and having the same reference point between to different users. 4
21st International Conference on Computing in High Energy and Nuclear Physics (CHEP2015) IOP Publishing Journal of Physics: Conference Series 664 (2015) 062025 doi:10.1088/1742-6596/664/6/062025
3. Implementation The database used for the applications is the powerful CouchDB. The way the dynamic context on the front-end was created was by using the views inside the database with mapping functions. The mapping functionality of CouchDB allows the results to be stored and only newly added documents have to be processed again when another request is being done. Occasionally we used the reduce functions, that perform optimized processing, for more efficiency. The heavy processing took place on the server site to handle the big amount of everyday renewed data. 3.1. Satistics Web Page The Statistics web page is based on Flask[9] in combination with CouchDB[10]. The couchdbpython library combined with Flask[9]. 3.1.1. JS Libraries • The jQuery[11] and the jQuery UI[12] library were used to handle the loading of the content, the animation of the page and the interaction with the user. Many features, such as the progress bars and the optical effects were based on the features it offers. • The Google developers tools[13] were used to create the charts needed for the page. The pie charts are used to simplify statistics. The user is then allowed to dive deeper into more details. Ajax calls are made in the JavaScript part to extract the data in a simplified form. The chart are then automatically created once the object pie chart is given his properties and the options are specified to the match the content. The Timeline chart uses a table and automatically detects duplicates concerning the content, in the case of the timelines representing the projects when focusing, one can see the different colors to express the build and tests duration . The Timeline chart is calculating the duration by default. • The slide-shows were created with the help of the sly.js[14] library, a free library. The library gives the option to load dynamically the content. The slide-show gets initialized, the content is placed in a list and then on that list you apply the slide-show properties. The slide-show can be controlled by the scroll-bar on top of it, either by mouse scrolling when hovering the slide-show or by using the left-right arrows on screen or keyboard. The same library is used to create the total of slots slide-show, plus the platforms one. 3.2. Release Web Page The Release Web Page[5] is a CouchDB[7] application and uses the same structure with the Nightly Build dashboard. The page is not divided by day standards, but an identifier is given to each of the release builds. The user is allowed to interact with Jenkins through this application with the ”Rebuild” button. The parameters of that build are adjusted to another format and the method ”POST” is used to start a new job process. The jQuery UI[12] dialog object that is used to countdown the time remaining for the user to complete his request. 4. Conclusion The group of applications that are related with the LHCb’s Continuous Integration System have on their core the Nightly Build Dashboard[4]. The set of applications assisting the many different flavor and the needs of the people working on the software, while keeping a modern profile and adjusting their content to possible use cases. The flexible structure that is used allows future developers to perform changes in the existing pages and add potential features.
5
21st International Conference on Computing in High Energy and Nuclear Physics (CHEP2015) IOP Publishing Journal of Physics: Conference Series 664 (2015) 062025 doi:10.1088/1742-6596/664/6/062025
References [1] [2] [3] [4] [5] [6] [7] [8] [9] [10] [11] [12] [13] [14] [15]
LHCb Nightly Build System https://twiki.cern.ch/twiki/bin/view/LHCb/LHCbNightlies#Monitoring Jenkins CI http://jenkins-ci.org/ M. Clemencic and B. Couturier, March 4 - 2013, A New Nightly Build System for LHCb LHCb Nightlies Dashboard https://buildlhcb.cern.ch/nightlies/ LbNightlyTools repository http://git.cern.ch/pubweb/LbNightlyTools.git/tree/HEAD:/couchdb/ release LHCb Release Builds https://buildlhcb.cern.ch/nightlies-release/ CouchDB Schema less database http://couchdb.apache.org/ JSON(JavaScript Object Notation) http://json.org/ Flask http://flask.pocoo.org/ Flask-CouchDB https://pythonhosted.org/Flask-CouchDB/ JQuery https://jquery.com/ JQuery UI http://jenkins-ci.org/ Google Developers Chart https://developers.google.com/chart/ SLY http://darsa.in/sly/ The RPM Package Manager http://www.rpm.org/
6