Improving packet synchronization in an NTP server Andrew N. Novick1, Michael A. Lombardi1, Kevin Franzen2, and John Clark2 1 Time and Frequency Division, National Institute of Standards and Technology, Boulder, Colorado, USA 2 Masterclock, St. Charles, Missouri, USA
[email protected] ABSTRACT A computer or dedicated client can use the Network Time Protocol (NTP) to synchronize an internal clock to a server that is synchronized by a 1 pulse-per-second (pps) signal from a national timing laboratory. Measuring an NTP server on a local area network can reveal timing synchronization errors and anomalies that are not nearly as likely to be recognized when NTP is utilized on a wide area network, where network delay asymmetry is the dominant source of uncertainty. We measured a commercially available NTP server by making rapid packet requests with UTC(NIST) as the common reference clock for both the server and client. Analysis of the results revealed repetitive synchronization errors in the packets transmitted by the server. Although these errors were usually too small to be detected by customers who deployed the server or by clients who accessed the server during typical usage, improving packet synchronization would benefit many applications. By collaborating with the server’s manufacturer, the source of the problem was revealed, and firmware changes were made to remove the synchronization errors. This paper describes our measurements and how the results were used to improve the server’s NTP packet synchronization.
1. INTRODUCTION The Network Time Protocol (NTP) is the most common method for synchronizing computer clocks and devices over the public Internet. Time synchronization of a client within 1 ms of a national timing laboratory is possible across a country, or even internationally [1]. The most prevalent source of uncertainty across a packet-switched wide area network (WAN) is the asymmetry of the path delay between the client and server. There are situations where the server clock adds a noticeable offset to the result [2, 3], but because using NTP over a WAN is typically utilized to synchronize a clock to the nearest second, the server clock uncertainty is usually not discernible or of concern to the client. Also, NTP clients on the public Internet often use software that compares results from several NTP servers and discard information from servers with incorrect clocks. The uncertainty of NTP on a local area network (LAN) is usually much smaller, primarily because the smaller round trip path delay limits the potential effects of network asymmetry, which cannot exceed 50% of the path delay. We have previously examined the limitations of using NTP on a LAN by connecting the client computer directly to the server and measuring serverclient time differences of less than 1 µs on average over a 20-day period with a standard deviation less than 10 µs [4]. Adding network components such as routers and switches to reach a different subnet added several microseconds to the average and more than doubled the standard deviation, but the result was still much better than using a WAN. Also, in a comparison of multiple NTP servers with the same reference clock and connected to the same network, the results differed by tens of microseconds [5]. These examples show that when NTP is used on a LAN, the uncertainty of the packet synchronization provided by the server is a significant factor in the uncertainty of the time received by the client. This paper shows how we measured anomalies, outliers, and server offsets, and then shared the results with a server manufacturer, helping them to achieve better NTP packet synchronization. 2. DETECTION OF SERVER ANOMALIES In a previous paper where we compared several NTP servers, our results showed unexplained time steps in data from two servers, made by the same manufacturer, that occurred at the same time [5]. The data from the other servers being measured on the same network did not indicate anything atypical. We began collaborating with the server manufacturer to investigate these results, and set up a test bed with multiple NTP servers using a 1 pulse per second (pps) signal from UTC(NIST) as their reference input.
Proceedings of the 2018 Precise Time and Time Interval Meeting, ION PTTI 2018, Reston, Virginia, January 29-February 1, 2018
256
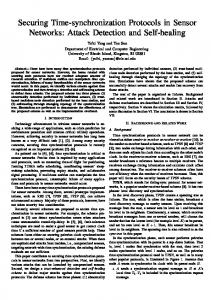
The NTP servers were compared to UTC(NIST) with a client computer measurement system used in previous experiments [1, 4, 5]. Every 10 s, the client software sequentially requests packets from a list of NTP servers and compares the time stamp obtained in the packets to UTC(NIST). Several of the servers on the list are located on the same subnet. Because both the server and client computers are referenced to UTC(NIST), this is a direct test of the uncertainty of the packet synchronization of each server. Figure 1 shows the round trip delay and time difference of Server A for a period of four days. In the middle section of the graph, Server B was added to the same subnet, and it appeared to cause a time step of over 80 µs in the Server A data. The round-trip delay for Server A did not change when Server B was added, so we did not believe that the network path was affected. The servers shared a network hub and it was initially predicted that crosstalk from Server B caused the change in Server A.
Figure 1. Two NTP servers compared to UTC(NIST) on a local network. The presence of Server B appeared to affect the time difference of Server A, but not the round-trip delay. We saw the effect in the data from multiple servers by the same manufacturer. We began to investigate Server B and how it could be the source of the problem. However, we found changing it to any brand of server caused the servers in question to time step, even adding ones with the same make and model. After adding and removing servers, we noticed that the order of the list was significant; adding or removing a server from the list before the ones in question (earlier on the list) caused them to jump, but changes in the list after did not have an effect. Also, adding the same server to the list several times caused the problem and each successive server had a different time offset. So, it appeared that checking the servers slightly earlier or later in the 10 s segment produced different results, but if no changes to the list were made, the results remained consistent for long periods. The root cause of this behavior was not obvious until client software was developed at NIST that made rapid packet requests of a single NTP server. The software makes user datagram protocol (UDP) requests from an NTP server as quickly as possible until it either reaches 100,000 requests or times out due to network or server limitations. The UDP port is only opened and closed once and all the data points are stored in an array and written to disk. Figure 2 shows a graph of the entire dataset and a subset of the first 10,000 points captured by the software. It shows that the NTP timing output has a “sawtooth” shape that repeats about every 1000 points. The software pushes the server to its capacity, which is specified by the manufacturer to be 1000 requests per second, and the number of points in each sawtooth varies around this number. By measuring the time interval of the complete data run, it appeared that the errors repeated every second. Thus, when the measurement system described previously checked the list of servers in the same order every 10 s, the requests to each server occurred at about the same place in the 10s cycle, hiding the true range of possible outputs from the servers in question. If this were not true, we would have seen a larger range in the data from Server A in Figure 1. Typically, an NTP client checks a server at intervals that are longer than 10 s and, on a public network, requests might reach the server at different points during the second, so the results would be spread out across the range of the sawtooth. The range of the data shown in Figure 2 is ~400 µs, and the average time difference in our test is 211.3 µs, which is still less than the 1 ms timing specification of the NTP server and would not be noticeable on a WAN. On a LAN, however, it was apparent that the uncertainty of the transmitted packets was dependent upon when the request was made. After sharing this
257
information with the manufacturer, they performed some independent tests to try to replicate the results to determine the cause of the issue. We also pointed out the occasional outliers and questioned what their expected time offset was, because as was the case with Server A in Figure 1, it was very close to zero at times but that appeared to be coincidental.
a)
b)
Figure 2. a) Time difference data from an NTP server synchronized to UTC(NIST), measured by a client system on the same subnet making rapid packet requests, and compared to UTC(NIST). b) A magnification of the first 10,000 points of 2a), revealing repetitive time steps resulting in a sawtooth shape.
3. MANUFACTURER’S SETUP A logic analyzer was used at the manufacturer’s site to test points on two identical devices, one configured as an NTP server with a Global Positioning System (GPS) input as the timing reference and one configured as an NTP client. The logic analyzer was connected to the Reduced Media Independent Interface (RMII) between the central processing unit (CPU) and the physical layer chip (PHY). This enabled it to capture the time when the NTP packet was sent/received on the Ethernet interface. On the server and the client four signals were monitored: RX time captured (pulse on a CPU pin when an NTP packet is received), RMII TX (a pin that goes high when data are transmitted), RMII RX (a pin goes high when data are received), TX time inserted (pulse on a CPU pin when placing the time stamp into the NTP packet). One channel of the logic analyzer utilized a 1 pps signal from a GPS receiver so that it had the same reference as the server. This setup allowed the analysis of the NTP request/response with 1 µs uncertainty on the logic analyzer. Packet analyzer software was used to save the packet data of each time stamp. With these measurements, they found that there was a rounding/truncation error in the code generating the time stamps.
Figure 3. Block diagram of manufacturer’s measurement setup. The server code had been ported from another platform where the CPU did not have the processing power to use double floating-point math or 64-bit integers, it was limited to using 32-bit integer math. This limited the resolution of the time stamp
258
when converting from NTP fractional seconds to microseconds. The NTP fractional seconds are represented as a 32-bit binary number (with a maximum value of 4,294,967,295), but when this was divided into microseconds, only the integer value of 4,294 microseconds was used. This method discarded relevant values up to 0.967295 µs out of 4,294 counts per second, resulting in an accumulating error up to 225 microseconds during each one second period. This error is reflected in the sawtooth pattern shown in Figure 2. The current platform code was updated to utilize 64-bit integers when converting to microseconds which included all of the relevant values, eliminating the rounding error. Looking at the occasional outliers in the NIST data, such as the outliers from Server A in the ten-minute averages on modified Julian date (MJD) 57914 in Figure 1, the manufacturer worked to minimize these occurrences. They revised thread priorities to improve the consistency and reduce the uncertainty of the NTP time stamps, raised the priority of the NTP thread and, where possible, lowered the priority of other threads so that they would be below NTP in the hierarchy. They developed a firmware update and sent it to NIST for installation and testing. 4. MEASUREMENT RESULTS Once the new firmware was installed at NIST, the rapid packet testing was repeated and the results are shown in Figure 4. The changes removed the sawtooth from the time stamps contained in the packets and thus their uncertainty is no longer dependent on the instant when the request is made. This was confirmed by adding and subtracting servers from the list of IP addresses on the client measurement system, which had no noticeable effect on the measured time differences. The overall range from the rapid packet requests was reduced to 111.0 µs and the time difference average from 10,000 points was reduced to 34.7 µs, a significant improvement compared to Figure 2 in Section 2.
Figure 4. Time differences from an NTP server compared to UTC(NIST) obtained from rapid packet requests for ~12 s after a firmware upgrade.
The manufacturer believed that they made improvements to the packet synchronization beyond the correction of the rounding error, and they were interested in knowing if the outlying points we saw in the ten-minute averages from the client measurement system had been alleviated as well. We did not have an idea of what the uncertainty of the synchronization was before the firmware change, because it could theoretically be anywhere within the range of the sawtooth. The manufacturer created a version of the firmware that repaired the rounding error, but left out all the other improvements to the timing they had added. Figure 5 shows a comparison of the measurements using the firmware with only the rounding error fix and the final version of the firmware. The graph shows an improvement in the average time difference, from 118.0 µs to 29.4 µs for this data set. Also, the range was reduced by more than half, from 32 µs to 14 µs, the data are less noisy, and there are fewer outlying points.
259
Figure 5. A comparison of the NTP server time differences between the original firmware with only the rounding error fixed, and the firmware after several improvements.
5. SUMMARY Recent work at NIST has led to an investigation of distributing UTC(NIST) across local networks using NTP packet synchronization. We have measured the timing limitations and uncertainties caused by elements on the network, including the variation in the outputs of different servers residing on the same network. We found that server clock uncertainty can be a significant contributor to the NTP measurement uncertainty, especially on a LAN. By comparing the packet synchronization of a server referenced to UTC(NIST) to a client also referenced to UTC(NIST), we discovered periodic time steps in the server’s output. When this was reported to the manufacturer, they resolved the problem and developed a firmware upgrade that greatly reduced the uncertainty of the packet synchronization. This paper is a contribution of the U. S. government, and as such, is not subject to copyright. The use of commercial products does not imply endorsement by NIST. 6. REFERENCES [1] M. Lombardi, J. Levine, J. Lopez, F. Jimenez, J. Bernard, M. Gertsvolf, et al., "International Comparisons of Network Time Protocol Servers," Proceedings of the 2014 Precise Time and Time Interval Systems and Applications Meeting, 1-4 December, 2014, Boston, Massachusetts, 57-66. [2] S. Sommars, 2017, “Challenges in Time Transfer Using the Network Time Protocol (NTP),” Proceedings of the 2017 Precise Time and Time Interval Systems and Applications Meeting, 30 January–2 February, 2017, Monterey, California, 271-290. [3] K. Vijayalayan and D. Veitch, 2016, "Rot at the roots? Examining public timing infrastructure," Proceedings of the 35th Annual IEEE International Conference on Computer Communications, 10-14 April, 2016, San Francisco, California, 1-9. [4] A. Novick and M. Lombardi, 2015, “Practical Limitations of NTP Time Transfer,” Proceedings of the 2015 Joint Conference of the IEEE International Frequency Control Symposium and the European Frequency and Time Forum, 1216 April 2015, Denver, Colorado, 570-574. [5] A. Novick and M. Lombardi, 2017, “A comparison of NTP servers connected to the same reference clock and the same network,” Proceedings of the 2017 Precise Time and Time Interval Systems and Applications Meeting, 30 January–2 February, 2017, Monterey, California, 264-270.
260