Hindawi Publishing Corporation International Journal of Distributed Sensor Networks Volume 2015, Article ID 385935, 12 pages http://dx.doi.org/10.1155/2015/385935
Research Article Improving Performance of QoS Applications for Wireless Networks Pingping Dong,1 Jianxin Wang,1 Jiawei Huang,1 Haodong Wang,2 and Yi Pan3 1
School of Information Science and Engineering, Central South University, Hunan 410083, China Department of Electrical Engineering and Computer Science, Cleveland State University, Cleveland, OH 44115, USA 3 Department of Computer Science, Georgia State University, Atlanta, GA 30302-5060, USA 2
Correspondence should be addressed to Jiawei Huang;
[email protected] Received 28 April 2015; Revised 15 September 2015; Accepted 16 September 2015 Academic Editor: Tom H. Luan Copyright © 2015 Pingping Dong et al. This is an open access article distributed under the Creative Commons Attribution License, which permits unrestricted use, distribution, and reproduction in any medium, provided the original work is properly cited. The contention based medium access method of 802.11 standards is a fundamental cause of poor downlink goodput and high latency over wireless networks, which makes it impossible to provide QoS guarantees. The intensive channel contention leads to the performance degradation. The problem exacerbates when the traffic asymmetry between the uplink and the downlink is present. While prior research works proposed various mechanisms to alleviate the issue, little was done to specifically address the appropriate parameter setting in a real world network. This study presents a way to obtain the appropriate access parameters that improves the performance of QoS applications over wireless networks. In particular, we propose AQEDCA, a traffic-aware minimum contention window adjustment algorithm. We validate our scheme by the extensive real world network tests and the results show that our scheme improves the downlink goodput up to 199.13%, decreases the latency up to 54.77%, and can achieve tight QoS guarantees as compared to the existing schemes.
1. Introduction Due to the attractive features including low cost, ease of deployment, and mobility support, the wireless LAN (WLAN) has become the dominant Internet access method and has been widely used in wireless sensor networks (WSNs) [1]. Meanwhile, the number of 802.11 wireless devices, which always contain lots of sensors, such as orientation or acceleration sensors, has grown exponentially in recent years. The rapid growth of the devices and applications often requires WLAN access points (APs) that handle a large number of client stations (STAs) with a variety of application quality of service (QoS) demands [2]. Our empirical study, as reported in Section 5, shows that APs with the default 802.11 protocol underperform in a deployment with dense STAs, for example, a large-scale data collection environment [3, 4]. That is, the observed throughput is much lower than the media access control (MAC) capacity. Our study further reveals that the causes of the above poor performance are as follows. First, in the default Carrier Sense Multiple Access with Collision Avoidance (CSMA/CA) scheme, APs need to
compete for the same wireless channel with their client STAs’ uplink traffic to deliver the downlink messages. When the STA population is getting larger, APs have less chances to win the channel contention and therefore delay the message transmissions to the STAs. As a result, the buffer is quickly filled up and the extra incoming messages are dropped. The packet loss at the AP side will trigger the upper layer retransmissions, for example, TCP, which leads to the poor downlink goodput and large response delay. Second, 802.11 WLAN exhibits the traffic asymmetry [5]. That is, the downlink traffic volume gets much larger than that in the uplink. To achieve the maximum throughput capacity in this traffic pattern, APs need to have more channel accessing time to deliver the response messages to the STAs. However, the default 802.11 CSMA/CA MAC does not give APs any advantages in channel contention. When the STA traffic is saturated in a densely deployed network, for example, a crowded airport or a large conference event, the large downlink data volume will quickly turn APs to be the network bottleneck as APs start to drop packets due to the buffer overflow.
2 This paper aims to address the above performance issues and maximize data throughput in a densely deployed 802.11 wireless network, where the downlink traffic is much greater than uplink traffic, attributable to commonly used clientand-server based applications (e.g., web and email) [5]. We propose AQEDCA, a novel scheme that dynamically tunes the CWmin (minimum contention window) parameter of APs and STAs according to the network conditions. The idea behind AQEDCA is to adjust the 802.11 MAC layer distributed coordination function (DCF) to give APs more network accessing advantages than STAs to avoid the downlink data loss due to the AP buffer overflow. The main challenges of our scheme are the precise mechanism design and the minimum contention window tuning timing, as well as the tuning magnitude. In this work, we use the theoretical analysis to derive the appropriate minimum contention window size. We validate our design by real world experiments and the results show a significant throughput enhancement by up to 199.13% and response delay reduction by up to 54.77%. Besides, AQEDCA also achieves an improved Jain Fairness Index by up to 91.28% and 251.95% compared with EDCA [6] and WiFox [5], respectively. In practice, our scheme is implemented on top of 802.11e [6] protocol. 802.11e is an approved extension to the IEEE 802.11 standard, with a set of quality of service (QoS) enhancements. In 802.11e, an enhanced version of DCF, called enhanced distributed channel access (EDCA), is introduced to differentiate the channel access priority according to the QoS requirements. EDCA ensures that an STA with high priority traffic (i.e., traffic with real-time requirement) has more opportunities to access the wireless medium than the low priority traffic from other STAs. EDCA achieves the service differentiation through setting different MAC layer parameters. While EDCA improves the quality of service of realtime traffic, it cannot provide the best performance since its parameters are set in advance and cannot be adapted to the various network conditions. In a dense and heavily loaded network, the fixed contention window sizes in EDCA may throttle the high priority and delay sensitive traffic due to the difficulty in channel accesses. On the contrary, in a light traffic condition, the vacant channels cannot be fully utilized because of the fixed parameters. As we will show in our evaluation, AQEDCA dynamically adjusts the contention window sizes and therefore achieves the significant throughput enhancement in both conditions. Our experiments further show that the traffic-aware contention window size adjustment scheme provides a much better support for QoS applications, such as VoIP. The rest of the paper is organized as follows. Section 2 discusses the related works. Section 3 describes our system model. Section 4 proposes our algorithm of AQEDCA. Section 5 presents our real world evaluation results and Section 6 concludes the paper.
2. Related Works Prior research works [7] show that CW (contention window) is one of the important factors affecting the WLAN
International Journal of Distributed Sensor Networks performance. Thus, there have been tremendous works on performance enhancement of WLANs by adjusting the minimum contention window like AEDCF [8, 9], Idle Sense [10], and so forth. The survey papers [2, 11, 12] give a more full technical description, among which an analytical model of 802.11 DCF is developed in [13] to study the performance of WLAN with asymmetric nonpersistent traffic, namely, VoIP, and many valuable results are obtained which can be used for effective call admission control to guarantee the quality of voice connections. AAP (Asymmetric Access Point) [9] sets the contention window to a constant value for AP while wireless stations use the Idle Sense access method [10], which ensures that the AP always obtains about fifty percent of channel access probability independently of the number of contending stations. More recently, the authors of [14] derive the proper contention window size to achieve time fairness and optimal throughput. Coincidentally, based on the CW sizes derived under both saturated and nonsaturated conditions, Hong et al. [15] propose a distributed algorithm that enables each station to dynamically adapt its CW according to the channel congestion status. The authors of [16] adjust the transmission attempt rate and the backoff window size of wireless nodes based on the current network status. The scheme proposed in [17] enhances both delay and throughput by scaling the limit parameters of CWmin and TXOP. The authors of [18] configure the contention parameters depending on the number of stations and the traffic they generate based on the multivariable control theory. DCWA [19] dynamically optimizes each active node’s backoff process by adjusting its CW to reach the optimal value in saturated network conditions. Authors of [20] propose a new model to derive the optimal contention window to maximize the throughput for a given network scale. To address the QoS requirements on throughput and delay, a new 802.11e configuration [21] computes the optimal parameters for real-time data traffic. Dynamical updating technology [22] is also proposed to accommodate multiple VoIP clients over a WLAN. Two control theory based adaptive algorithms, namely, the Centralized Adaptive Control (CAC) [23] and the Distributed Adaptive Control (DAC) [18], which dynamically tune the CW configuration to optimize performance, are implemented and evaluated in [24]. BDCF is proposed in [25] to achieve both traffic balancing and throughput enhancement. A novel access scheme [26] was proposed for 802.11e WLANs with the goal of improving the QoS of VoIP over WLAN by differentiating the service between the AP and STAs. In the medium access algorithm proposed in [27], each station selects an appropriate contention window size so as to fairly share the channel occupancy time and maximize the throughput under the time fairness constraint. The above proposals aim to fix or ameliorate the performance degradation problem for 802.11 WLANs. However, the existing solutions do not sufficiently address the problem. The two main limitations of existing solutions are as follows. First, most existing solutions are not practically deployed and are not tested in real networks with realistic network workloads [5, 24]. Nearly all of them are based on simulation or theoretical analysis except the work of Serrano et al. [24].
International Journal of Distributed Sensor Networks
3
There is a significant gap between the results obtained from real network experiments and simulations. Second, these proposals do not fully consider the asymmetric problem. Although some solutions focus on alleviating the WLAN performance problem caused by the network asymmetric traffic pattern, they mainly aim to allocate the channel resource equally to uplink and downlink transmissions [9, 13, 26–28]. However, the network resource should be adaptively distributed between uplink and downlink according to real-time traffic load. In this paper, we argue that the improper contention window size and the asymmetry between the downlink and uplink flows have significant impact on the WLAN performance. Thus, AQEDCA is proposed to solve the problem in real WLAN environment. AQEDCA adjusts STAs’ access probabilities under different traffic conditions based on the object collision probability derived analytically and gives AP a priority based on the queue length. AQEDCA is implemented at the AP and is transparent to STAs. To validate our solutions in real WLAN environment, we implemented AQEDCA in the off-the-shelf commercial IEEE 802.11g and 802.11b AP, constructed a real network testbed of 20 STAs, and tested its performance in terms of throughput and delay following the traffic pattern of real traces [29, 30]. Recently, WiFox [5] was proposed to tackle the problem in a similar way by prioritizing AP’s channel access and was tested in real network environment. Our scheme differs from WiFox in the way of how to adjust AP’s priority. While WiFox only uses AP’s queue length as the reference, AQEDCA also monitors network traffic load. Besides, in AQEDCA, STAs’ contention window is also adjusted based on the network traffic load of every beacon interval with the consideration that, in WiFox, only increasing the chances for AP to contend for the channel may aggregate the collision rate in heavy load WLAN environment. Our arrangement yields a significant performance enhancement as compared to WiFox, as we will show in Section 5.
3. System Model IEEE 802.11e provides quality of service (QoS) enhancement through enhanced distributed channel access (EDCA). With EDCA, traffic flows are classified into four Access Categories (ACs). Each AC is assigned with its own MAC parameters and operates independently. In this study, we consider all nodes that operate at a single AC. We consider a wireless LAN with 𝑛 nodes: one AP and (𝑛 − 1) STAs. Each STA is associated with the AP and shares the channel with other STAs by means of the modified 802.11 DCF access method with adaptive CWmin . Let 𝜏 be the access probability of a node, which is actually the probability that the node transmits in a random time slot. This value can be determined as follows [7]: 𝜏 =
where 𝑊 represents the minimum contention window and 𝑚 denotes the maximum backoff stage. We denote 𝑃𝑠 as the probability of a successful transmission in a randomly chosen time slot. A node can successfully transmit the frame if and only if it is the only node that attempts to transmit. Thus, 𝑃𝑠 can be calculated as 𝑃𝑠 = 𝑛𝜏 (1 − 𝜏)𝑛−1 .
Similarly, the probability of an idle slot 𝑃𝑖 can be expressed: 𝑃𝑖 = (1 − 𝜏)𝑛 .
𝑛−1
1 + 𝑊 + [1 − (1 − 𝜏)
] 𝑊 ∑𝑚−1 𝑖=0
𝑛−1 𝑖
{2 [1 − (1 − 𝜏)]
}
,
(1)
(3)
The collision probability 𝑃𝑐 in a slot then can be expressed: 𝑃𝑐 = 1 − 𝑃𝑖 − 𝑃𝑠 = 1 − (1 − 𝜏)𝑛 − 𝑛𝜏 (1 − 𝜏)𝑛−1 .
(4)
The system throughput can be determined by the fraction of time the channel used to successfully transmit a packet [7]. Let 𝑆 be the normalized system throughput. Then we can have 𝑆=
[payload information transmitted in a slot time] . (5) [length of a slot time]
Let 𝐸[𝑃] be the average packet payload size. The average of successfully transmitted bytes in a given time slot is 𝑃𝑠 𝐸[𝑃]. The length of a slot time can be any of the following three: idle time, successful transmission time, and failed transmission time due to collision. Let 𝜎 be the duration of the idle time slot, let 𝑇𝑠 be the average time of a successful transmission, and let 𝑇𝑐 be the time duration due to a collision. Then we can obtain the value of 𝑆 as follows: 𝑆=
𝑃𝑠 𝐸 [𝑃] . 𝑃𝑖 𝜎 + 𝑃𝑠 𝑇𝑠 + 𝑃𝑐 𝑇𝑐
(6)
4. AQEDCA Scheme The goal of the proposed scheme is to adjust the value of the minimum contention window size, CWmin , of both AP and STAs, to maximize the downlink throughput, while, at the meantime, maintaining the fairness and controllable message response latency. 4.1. Analysis of Collision Probability. We start the discussion by explaining how to obtain the appropriate CWmin to maximize the throughput 𝑆. Note that (6) can be transformed to 𝑆=
𝐸 [𝑃] . 𝑃𝑖 𝜎/𝑃𝑠 + 𝑇𝑠 + 𝑃𝑐 𝑇𝑐 /𝑃𝑠
(7)
According to the definition in [7], 𝑇𝑠 and 𝑇𝑐 with the basic access mechanism can be expressed as 𝑇𝑐 = 𝑇data + SIFS + 𝑇ack + DIFS, 𝑇𝑠 = 𝑇data + DIFS,
2
(2)
(8)
where 𝑇data is the frame transmission time. As described in the equation, 𝑇𝑠 and 𝑇𝑐 are determined by the parameters of
4
International Journal of Distributed Sensor Networks Table 1: Relevant network parameters of 802.11g.
Parameter PHYheader ACKframe Rate Slot SIFS DIFS
Default 192 bits 112 bits + PHYheader 54 Mbit/s 20 𝜇s 10 𝜇s 50 𝜇s
the PHY and MAC layers and the average packet size. Notice that 𝑇data value varies due to the different payload sizes in the real situation. For the sake of simplification, we assume, on average, that the length of the data equals 1000 bytes and then estimate the duration of 𝑇data . As a result, we can assume that 𝑇𝑠 and 𝑇𝑐 are known constants. Thus maximizing 𝑆 is sufficient to minimize the denominator of (7), which is equivalent to minimizing (9). The following analysis adopts the methodology of Idle Sense [10] to derive the object collision rate 𝑃𝑐 (Idle Sense aims to optimize the network throughput based on the optimal number of idle slots calculated with the methodology; however, it does not consider the asymmetric traffic pattern in real WLAN environment): 𝐹 (𝜏) =
(𝑇𝑐 /𝜎) 𝑃𝑐 + 𝑃𝑖 . 𝑃𝑠
(9)
By inserting 𝑃𝑖 , 𝑃𝑐 , and 𝑃𝑠 from (2)–(4), respectively, into (9) and then setting the first derivative of (9) to zero, we have 1 − 𝑛𝜏
opt
𝑛 𝜎 = (1 − ) (1 − 𝜏opt ) , 𝑇𝑐
(10)
where 𝜏opt is the optimal access probability that maximizes the network throughput. Obviously, (1 − 𝜎/𝑇𝑐 ) is a constant when 802.11 MAC parameters are selected. Let us take 802.11g parameters with basic access mechanism as an example. The default parameter values are reported in Table 1. According to (8), we can get that 1−
𝜎 = 0.9. 𝑇𝑐
(11)
Furthermore, we can obtain 𝜏opt by finding the only root of the polynomial in (10). By substituting the obtained 𝜏opt into (4), we then compute the collision probability under 𝜏opt for a given number of competing nodes, and the results are given in Table 2. Now let us consider a crowded WLAN, where the number of nodes, 𝑛, is large enough. When 𝑛 is approaching to the infinite (while it is unlikely that 𝑛 becomes infinitely large in the real world, we merely perform the mathematical derivation here to compute the optimal values as a guidance), (10) can be approximated as follows [10]: 1 − 𝑛𝜏opt = (1 −
𝜎 −𝑛𝜏opt )𝑒 . 𝑇𝑐
(12)
Table 2: Optimal values of the access probability 𝜏opt and the target collision probability 𝑃𝑐 (PHY parameters for 802.11g). 𝑛 2 4 5 6 7 8 9 10 11 12 13 14 15 16 17 18 19 20
𝜏opt 0.2403 0.1068 0.0838 0.0690 0.0586 0.0510 0.0451 0.0404 0.0366 0.0335 0.0309 0.0286 0.0267 0.0250 0.0235 0.0221 0.0210 0.0199
𝑃𝑐 0.0577 0.0591 0.0592 0.0593 0.0592 0.0593 0.0593 0.0592 0.0592 0.0593 0.0594 0.0593 0.0595 0.0595 0.0595 0.0591 0.0595 0.0594
The value of 𝑛𝜏opt can be determined by numerical analysis. Given the value of (1 − 𝜎/𝑇𝑐 ) in (11), the value of 𝑛𝜏opt is 0.5239. Furthermore, when 𝑛 is large, approximately (4) becomes opt
opt
𝑃𝑐 = 1 − 𝑛𝜏opt 𝑒−𝑛𝜏 − 𝑒−𝑛𝜏 .
(13)
The above result leads us to an important conclusion: when the 802.11 MAC parameters are selected, we can immediately compute the target collision probability that maximizes the network throughput. Therefore, the problem of achieving the maximum throughput is reduced to reaching the target collision probability. 4.2. The Algorithm Descriptions. Enlightened by the conclusion made in the previous section, we develop an AP oriented node access scheme so that the CWmin adjustment is transparent to STAs. The CWmin adjustment is based on the value of 𝑃𝑐 derived in (13). We first summarize the basic idea and then give the detailed explanation. We assume the time domain is divided into a number of equal time periods. A natural selection of the period duration is the 802.11 beacon period. It is a configurable parameter in the AP, in a range from 25 ms to 1000 ms in Madwifi driver, and typically configured as 100 ms, as the configuration provides good performance for most applications which have been validated as a good choice by the previous researches [5]. In each time period, the AP calculates the average of collision probability based on the observed network activities, including the successful data transmissions, transmission failures due to the collision, and its frame queue length. The derived current network collision probability is compared with the target value. If the collision probability is larger, indicating a saturated network condition, the CWmin is increased
International Journal of Distributed Sensor Networks
5
(1) Input: 𝑗th iteration, data collision𝑗 , data sent𝑗 , 𝑞len𝑗 𝑗 𝑗 (2) Output: AP CWmin , STA CWmin 𝑗 (3) 𝑓curr ← 𝐸[data collision𝑗 ]/𝐸[data sent𝑗 ] 𝑗 𝑗 𝑗−1 (4) 𝑓avg ← (1 − 𝛼)𝑓avg + 𝛼𝑓avg 𝑗 (5) if 𝑓avg < 𝑃𝑐 then (6) 𝜏 ← 𝜏 + 𝜖 𝑗 ≥ 𝑃𝑐 then (7) else if 𝑓avg (8) 𝜏 ← 𝛽𝜏 (9) end if (10) if AP’s buffer is not empty then (11) 𝜏AP ← (𝜙/𝑄len )𝑞len𝑗 𝜏 (12) end if 𝑗 (13) compute AP’s AP CWmin 𝑗 (14) compute STA’s STA CWmin
Collision rate
0.2
0.0
Algorithm 1: CWmin adjustment algorithm.
𝐸 (data collisions𝑗 ) 𝐸 (data sent𝑗 )
,
0
5
10 15 Number of uplink UDP flows
20
AP Networks
to suppress the nodes’ network accesses. If the derived probability is less, however, the CWmin is reduced to encourage the nodes’ network accesses. STAs receive their updated CWmin in the beacon messages. Meanwhile, the AP’s frame queue length is also monitored and AP’s CWmin is adjusted in a similar fashion with the goal to allow AP to receive sufficient network access opportunities. This strategy is to reduce AP’s queue length and offset the traffic asymmetry. Our CWmin adjustment algorithm is described in Algorithm 1. As we will show in Section 5, our scheme significantly improves the network performance, including throughput, fairness, and response time, in our real world experiment evaluation. We now discuss in detail how to determine the network 𝑗 as the access probability 𝜏 and CWmin . Let us denote 𝑓curr collision probability of the AP in the current period 𝑗. Its value can be computed as follows: 𝑗 = 𝑓curr
0.1
(14)
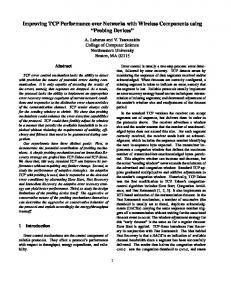
where 𝐸(data collisions𝑗 ) is the number of collisions observed during period 𝑗 and 𝐸(data sent𝑗 ) is the total number of the transmitted packets in the same period. Obviously, 𝑗 ∈ [0, 1]. 𝑓curr 𝑗 It is worth noting that the 𝑓curr calculation omits the states of the STAs. The reason lies in that, as validated through experiments, in downlink dominated network, the collision probability with or without the states of STAs has little difference. Figure 1 shows the results of the collision probability calculated at the AP and that of the whole network when the number of downlink UDP flows keeps at 25. As depicted in the figure, when the number of the uplink UDP flows is below 5, that is to say, when the downlink traffic is 5 times larger than the uplink traffic, the difference between the collision rates is very small. In the real world, the downlink traffic is about 4–10 times greater than uplink traffic [5]. Thus, we utilize the AP’s collision probability for convenience in the estimate procedure. Serrano et al. [24] proposed another way of computing the network collision probability at AP based
Figure 1: Collision rate.
on the observation of the retry flag of successful frames. The solution can be combined with ours to improve the accuracy of the calculation of collision probability in the future. To minimize the bias against transient collisions, we use an estimator of Exponentially Weighted Moving Average 𝑗 be the (EWMA) to smoothen the estimated values. Let 𝑓avg average collision rate in the 𝑗th update period. We compute the smoothened value as the following iterative operations: 𝑗 𝑗 𝑗−1 = (1 − 𝛼) 𝑓avg + 𝛼𝑓avg , 𝑓avg
(15)
where 𝛼 is the smoothing factor. 𝑗 with the target value 𝑃𝑐 , we apply the By comparing 𝑓avg 𝑗 < AIMD control mechanism to the access probability 𝜏: if 𝑓avg 𝑃𝑐 , 𝜏 is increased additively, which encourages the network accesses; otherwise, 𝜏 is decreased in a multiplicative way to quickly relieve the network contention. Note that the value of 𝑗 is equal to 𝑃𝑐 . 𝜏 remains unchanged if the 𝑓avg Furthermore, to solve the asymmetric problem in 802.11, we prioritize the access probability of AP in the linear scaling mode as described in the following. The access probability of the AP, denoted as 𝜏AP , is updated linearly as 𝜏AP =
𝜙 𝑞 𝜏, 𝑄len len
(16)
where 𝜙 is a priority factor which equals the number of competing STAs, 𝑞len is the current queue length of AP, and 𝑄len represents the buffer size of AP. Note that 𝜏 is derived from step (5) through step (9) in Algorithm 1. Finally, by combining (16) with (1), we can calculate the values of CWmin for STAs and the AP, respectively. The computed CWmin values for STAs are eventually broadcasted through the beacon messages.
6
5. Performance Evaluations In this section, we validate the proposed AQEDCA algorithm by performing the extensive real world experiments and compare its performance results with the two existing algorithms: the default 802.11e EDCA and WiFox [5], a recently proposed large-scale 802.11 performance enhancement scheme. 5.1. Implementations. In our experiments, we implement AQEDCA and WiFox as separate Linux drivers on Madwifi, one of the most popular open source device drivers available for Linux. We use the EDCA scheme attached to the default 802.11e driver. Both AQEDCA and WiFox are implemented in the ATH layer, which interacts with net80211 stack layer for exploiting 802.11 functionalities and calls HAL to communicate with the hardware. The jiffies and qdisc length are obtained from the ATH layer to calculate the periods defined in the algorithms and the queue length of AP. Our implementation obtains the key parameters, including the collision probability and CWmin /CWmax in the following. The collision probability is calculated by dividing the number of retried transmissions by the number of transmitted packets. It is worth noting that the above calculation omits the retransmissions due to the transmission errors for the simplification purpose with the consideration that retransmission errors are rare in our controlled lab environment. Given the collision probabilities, the MAC parameters (CWmin , CWmax ) are calculated by Algorithm 1. In the next time period, the recalculated MAC parameters are assigned and updated through 802.11 beacons. 5.2. Testbed Construction and Experimental Methodology. Our experiment testbed is deployed at our lab and consists of two file servers, one AP and 20 client stations (STAs). Both the AP and the STAs are running on Linux computers. As a typical WLAN is single-hop based where a station associates itself with an AP within its direct communication range [15, 26] and most of the existing algorithms are designed for this scenario [5, 13, 19], in our experiments, the 802.11 WLAN is configured in the infrastructure mode. However, it is worth noting that AQEDCA can be easily extended to the multihop case [31, 32]. The architecture of the testbed is shown in Figure 2. The AP is running on a Dell T1500, equipped with the Intel Xeon E5620 (2.4 GHz/12 M), 16 GB RAM, a 600 GB Hard Disk, a DLink DWL-G520 IEEE 802.11b/g wireless card with Atheros chipset, and Centos with kernel version 2.6.32.279.19.1. The STAs are running on the DELL optiplex 745, equipped with Intel Pentium D 3.4 G processor, 512 MB RAM, 160 GB hard disk, and Fedora 9 OS with kernel version 2.6.25.14. The default buffer sizes of the driver Tx and the interface Tx are 50 packets and 199 packets, respectively. We have two file servers that act as the remote servers over the Internet. The STAs access the file servers through the AP. All of the tests are performed using the 802.11g physical maximal transmission rate at 54 Mbit/sec with RTS/CTS disabled. The MAC parameters in our experiments are the 802.11e standard. In addition, based on the CWmin and CWmax calculated in Algorithm 1
International Journal of Distributed Sensor Networks Table 3: Mac parameter calculation rules for different ACs. AC CWmin Background (AC BK) aCWmin Best effort (AC BE) aCWmin Video (AC VI) (aCWmin + 1)/2 − 1 Voice (AC VO) (aCWmin + 1)/4 − 1
CWmax aCWmax aCWmax aCWmin (aCWmin + 1)/2 − 1
File servers: 192.168.0.221 192.168.0.51
AP: 192.168.0.235 192.168.3.1
STAs: 192.168.3.x
Figure 2: Testbed architecture.
of AQEDCA, the parameter computation for different Access Categories (ACs) also follows 802.11e as shown in Table 3. To emulate a WLAN environment with the real world traffic pattern, we use Jmeter and iperf to generate network traffic following the traffic pattern captured from real traces [29, 30]. Jmeter generates web requests and the file servers generate replies by sending random sized web objects. We set the average interarrival time of HTTP requests to one second and arrange running 16 HTTP request generation threads at each STA. In addition, we generate uplink UDP traffic with the rate of 25 kbps from each STA in our experiments as the background traffic. By varying the number of associated STAs, we evaluate the three mechanisms under various workloads. To determine the size of the web objects in our experiments, we conduct the experiments by statistically analyzing the distribution of web object sizes from six typical web sites and plot the corresponding cumulative distribution functions (CDF) as illustrated in Figure 3. These typical web sites include the portal (http://www.yahoo.com/), the government (http://www.usa.gov/), the E-commerce (http:// www.amazon.com/), the company (http://www.cisco.com/), the education (http://www.ieee.org/), and the home page of Yale university (http://www.yale.edu/). The figure shows that most of the web objects are smaller than 160 K bytes. In addition to the above web objects, we also include other large online objects, for example, emails, to have a complete object set. The distribution of the object sizes in our experiments is shown in Table 4. In our experiments, each data point is obtained by computing the average value of the results from three rounds of execution. Each run lasts approximately 300 s. We list the main parameters of our algorithm in Table 5.
International Journal of Distributed Sensor Networks
7 1.0
Table 4: Web object size distribution of AQEDCA. Proportion (%) 48 13 19 13 7
0.8
0.6 CDF
Web object size (KB) 1 16 64 128 256
0.4
Table 5: Parameters of AQEDCA. Parameter 𝛼 𝑚
Value 0.875 3 5 6
𝛽
The maximum backoff stage, 𝑚, as validated in [7], does not practically affect the system throughput as long as 𝑚 is greater than four or five. Thus, in our experiments, we give 𝑚 the value of 7. The parameter of 𝛼, when it is chosen in the range of [0.75, 0.9], can achieve good performance in terms of the goodput and delay as evaluated in the previous work [8]. So we set 𝛼 to 0.875. 𝛽 and 𝜖 are given with the empirical value of 5/6 and 0.01, respectively, in our experiments. We use the following three metrics in our evaluation. (1) Gain of goodput: the throughput of the completed responses is the key to many web applications. We thus consider this metric in terms of the downlink goodput which is the average throughput of the successful transmissions. (2) Response delay: it is the duration between the time of transmission and the time of reception of the response. It is also called “elapsed time.” (3) Jain Fairness Index: this metric is defined as follows: 2
𝐹 (𝑥) =
(∑𝑛𝑖=0 𝑥𝑖 ) , 𝑛 (∑𝑛𝑖=0 𝑥𝑖2 )
(17)
where 𝑛 is the total number of TCP flows and 𝑥𝑖 is the throughput of the 𝑖th connection. Note that the fairness index, with the value ranging from 0 to 1, approaches 1 as the resource is more fairly shared. To calculate this metric, we use iperf to generate symmetric TCP traffic where the NIC card works in dual mode; that is to say, the NIC card sends (receives) TCP packets to (from) the file servers simultaneously. 5.3. Experimental Results. As reduced response time for a HTTP request is considered as a more critical metric to users compared with improved goodput for applications such as web [33], we first investigate the response time of the STA’s HTTP requests and the corresponding queue length at the AP which is closely related to the response delay. Figure 4(a) plots the average response delay and Figure 4(b) shows the average interface Tx queue length of
0.2
0.0
0
40000 80000 120000 Size of the web objects (bytes) http://www.amazon.com http://www.ieee.org http://www.yahoo.com
160000
http://www.usa.gov http://www.cisco.com http://www.yale.edu
Figure 3: Size distribution of web objects.
the AP. As AQEDCA ensures higher channel access priority to APs and higher effective channel utilization, the scheme is able to keep small queue length, avoiding queue saturation (as indicated in Figure 4(b)) and consequently achieving low response delay. Figure 4(a) shows that AQEDCA scheme incurs less than 50% response delay compared to that of EDCA and WiFox. In order to illustrate the metric more precisely, Figure 5 is plotted to illustrate the cumulative response delay with respect to the distribution of completed requests when the associated STAs are 20. It clearly shows that the response time in AQEDCA is significantly lower than that of EDCA and WiFox, and more than 80% of the replies are received within 12 ms. By comparing Figure 4(a) with Figure 4(b), we find that the AP’s queuing length in EDCA is holding at a constant value (approximately 170) when the number of STAs changes from 5 to 20, while its response time increases from 1586.74 ms to 15546.13 ms. The reason is, to our observation, that when there are 5 STAs, AP’s queue is almost full in the steady state as shown in Figure 6. As the number of STAs grows, the saturated queue causes more severe packet losses, which is also witnessed in Figure 4(c). As a result, the STAs are experiencing longer response delay in the EDCA mechanism as more STAs join the network. In Figure 4(d), we plot the gain on goodput as a function of the varying numbers of the STAs. As described above, the main reason for the poor performance of EDCA is due to the saturated queue caused packet loss and the overhead of dealing with contention. As AQEDCA is designed to solve the problems, the gain on goodput of AQEDCA always outperforms WiFox and the default EDCA. AQEDCA obtains significant goodput performance gains by up to 199.13% and 154.34% compared to the default EDCA and WiFox, respectively.
8
International Journal of Distributed Sensor Networks
AP’s average queue length (packets)
16000
Response delay (ms)
12000
8000
4000
0
5 STAs
10 STAs 15 STAs Number of STAs
160
120
80
40 5 STAs
20 STAs
10 STAs
15 STAs
20 STAs
Number of STAs
AQEDCA WiFox EDCA
AQEDCA WiFox EDCA (a) Response delay
(b) AP’s average queue length
Per station downlink goodput (Mbytes/s)
30
Retransmission ratio (%)
25
20
15
10
5 5 STAs
10 STAs
15 STAs
20 STAs
0.4
0.3
0.2
0.1
0.0
5 STAs
10 STAs 15 STAs Number of STAs
Number of STAs AQEDCA WiFox EDCA
20 STAs
AQEDCA WiFox EDCA (c) Retransmission ratio
(d) Downlink goodput
Figure 4: HTTP performance with varying stations.
Figure 7 plots the Jain Index of the competing TCP flows. It demonstrates that the downlink goodput improvements are not achieved at the cost of fairness. In the same figure, there is a sharp decline of the EDCA scheme when the STAs change from 5 to 10. The reason can be clearly explained by Figure 4(c), which shows the retransmission rate increases rapidly with the number of STAs changing from 5 to 10. It is the large number of retransmissions that causes the severe throughput drop on the downlink TCP flows. Our data shows that the ratios of the downlink throughput to the uplink throughput, under 5, 10, 15, and 20 STAs, are 0.568490597, 0.040656595, 0.032953373, and 0.01027193, respectively.
Furthermore, we conducted experiments with varying buffer sizes which are reset with the 𝑖𝑓𝑐𝑜𝑛𝑓𝑖𝑔 command, where iperf is used to generate bidirectional TCP streams. Figures 8(a) and 8(b) plot the gain of the goodput and the average RTT of the downlink TCP streams, respectively. From the figures, we can see that AQEDCA is sustainable with varying buffer sizes and always outperforms WiFox and EDCA. In the data analysis process, we found that both AQEDCA and WiFox can control the AP’s queue length effectively, giving lower TCP retransmission rate, where AQEDCA performs better. The TCP retransmission rate of AQEDCA almost keeps at 10% whatever the size of the buffer is, while
International Journal of Distributed Sensor Networks
9
70000
1.0
60000
40000
Jain Index
Response delay (ms)
0.8 50000
30000
0.6
0.4
20000 0.2
10000 0 10
0.0 20
30
40 50 60 Requests (%)
70
80
90
AQEDCA WiFox EDCA
AP’s queue length (packets)
150 100 50 50
100
150 Time (s)
200
250
300
150
142
15 STAs
Figure 7: Jain Index with varying stations.
200
0
10 STAs Number of STAs
AQEDCA WiFox EDCA
Figure 5: Requests serve rate when 20 STAs associated.
0
5 STAs
144
146
Figure 6: AP’s queue length varies with elapsed time under EDCA when 5 STAs associated.
WiFox has a small fluctuation from 10% to 15%. However, when it comes to EDCA, no matter how big the buffer is, it always overflows the buffer. Although the larger buffer size leads to a smaller TCP retransmission ratio (29.17%, 31.86%, and 33.13% with buffer sizes 200, 100, and 50, resp.), it gives a small increase with downlink goodput. However, in EDCA, the lower channel access probability of the AP compared to the STAs makes the downstream severely suppressed by the upstreams under varying buffer sizes. 5.4. Performance of QoS Applications. Since 802.11e is a standard that supports QoS data communications, we are curious about the impact of QoS applications with our algorithm. In this test, we use VoIP as an example to examine the performance of delay sensitive applications. Based on our testbed,
we set up a VoIP environment as follows. We first deploy a VoIP gateway by using Asterisk on one of our file servers and then use one STA and the other file server acting as two VoIP clients, both running Zoiper SIP softphone. Meanwhile, our 15 STAs are generating bidirectional TCP traffic with iperf as the background traffic. The VoIP traffic consists of a GSM codec stream from the initiator to the recipient and a G.711 codec stream on the reverse direction. Both G.711 and GSM streams have 20 ms frame size with fixed payload (160 bytes and 33 bytes, resp.). During the test, each voice conversation lasts 240 s. Thus, in total, 12000 packets are sent on each direction. We use two performance metrics, packet loss rate and jitter, to evaluate the quality. The packet loss rate is the ratio of lost packets to the total packets transmitted. The jitter, denoted as 𝐽(𝑖), is calculated according to RFC3550 (RTP): 𝐷(𝑖−1,𝑖) − 𝐽𝑖−1 , 𝐽𝑖 = 𝐽𝑖−1 + 16
(18)
where 𝑖 is the packet sequence number and 𝐷 is the packet interarrival delay. Given two packets 𝑖 and 𝑗 with their transmission timestamps 𝑆𝑖 , 𝑆𝑗 and receipt timestamps 𝑅𝑖 , 𝑅𝑗 , the interarrival delay is defined as 𝐷(𝑖,𝑗) = (𝑅𝑗 − 𝑅𝑖 ) − (𝑆𝑗 − 𝑆𝑖 ) = (𝑅𝑗 − 𝑆𝑗 ) − (𝑅𝑖 − 𝑆𝑖 ) . (19)
Figure 9(a) illustrates the VoIP packet loss rate under three different schemes. It clearly shows that the AQEDCA scheme achieves the lowest packet loss rate on both downlink and uplink, compared to WiFox and EDCA. Again, the reason is that our scheme effectively controls the AP’s queue length and thus avoids the buffer overflow in a saturated network scenario. In addition, AQEDCA also achieves a much better balance between the downlink and uplink VoIP traffic, which is crucial for the quality interactive communications.
10
International Journal of Distributed Sensor Networks 3
Average RTT (s)
Gain of goodput (Mbit/s)
2
1
0
50
100 Buffer size (packets)
2
1
0
200
50
100
200
Buffer size (packets)
AQEDCA WiFox EDCA
AQEDCA WiFox EDCA (a) Downlink goodput
(b) Average RTT
Figure 8: Performance obtained of different algorithms under varying buffer sizes with bidirectional TCP streams generated by iperf. 30
Mean jitter (ms)
Packet loss ratio (%)
30
20
10
0 AQEDCA
WiFox Algorithms
EDCA
20
10
0
AQEDCA
WiFox Algorithms
EDCA
Downlink Uplink
Downlink Uplink (a) Packet loss ratio
(b) Mean jitter
Figure 9: VoIP performance obtained of different algorithms.
Figure 9(b) plots the average jitter of downlink and uplink VoIP traffic. AQEDCA scores balanced jitter values with less than 12 ms in both directions. The performance of WiFox is the worst with the downlink jitter of 27 ms and uplink jitter of 15 ms. The reason is that WiFox does not support QoS and therefore the VoIP stream has to compete with background traffic for the channel access. One may notice that EDCA gives the best jitter performance on its uplink. The only reason is that the uplink suppresses the downlink and thus causes a much larger jitter on its downlink. The unbalanced jitter
values between the two directions normally bring intolerable phone conversation quality.
6. Conclusions In the paper, we proposed a novel access scheme for 802.11 WLANs with the goal of maximizing the downlink goodput and reducing the access latency. We first presented the theoretical analysis that reveals the relation between the throughput and the access probability. Then, we derived the optimal
International Journal of Distributed Sensor Networks access probability that maximizes the throughput. We developed a practical scheme, AQEDCA, that enables the nodes to achieve the optimal access probabilities by adjusting their CWmin parameters. We implemented the scheme on off-theshelf wireless network interface cards and extensive experiments were conducted to verify the efficiency of the proposed AQEDCA scheme. Future investigations will focus on extending our algorithm to the multihop situation. Besides, exploring relationship between the CWmin and the access probability in different traffic patterns as well as other effective ways to estimate the network conditions more accurately is also an important future work.
Conflict of Interests The authors declare that there is no conflict of interests regarding the publication of this paper.
11
[9]
[10]
[11]
[12]
[13]
Acknowledgments The authors would like to acknowledge that this work was supported by the National Natural Science Foundation of China (Grant nos. 61502540 and 61572530), the China Hunan Provincial Science & Technology Program (Grant no. 2012GK4106), the International Science & Technology Cooperation Program of China (Grant no. 2013DFB10070), and the National Science Foundation of USA (Grant no. 1338105).
References [1] S. Sendra, J. V. Lamparero, J. Lloret, and M. Ardid, “Underwater communications in wireless sensor networks using WLAN at 2.4 GHz,” in Proceedings of the 8th IEEE International Conference on Mobile Ad-Hoc and Sensor Systems (MASS ’11), pp. 892–897, IEEE, Valencia, Spain, October 2011. [2] M. Dong, T. Kimata, K. Sugiura, and K. Zettsu, “Quality-ofexperience (QoE) in emerging mobile social networks,” IEICE Transactions on Information and Systems, vol. 97, no. 10, pp. 2606–2612, 2014. [3] L. Jiang, A. Liu, Y. Hu, and Z. Chen, “Lifetime maximization through dynamic ring-based routing scheme for correlated data collecting in WSNs,” Computers and Electrical Engineering, vol. 41, pp. 191–215, 2015. [4] Y. Hu and A. Liu, “An efficient heuristic subtraction deployment strategy to guarantee quality of event detection for WSNs,” The Computer Journal, vol. 58, no. 8, pp. 1747–1762, 2015. [5] A. Gupta, J. Min, and I. Rhee, “WiFox: scaling WiFi performance for large audience environments,” in Proceedings of the 8th ACM International Conference on Emerging Networking EXperiments and Technologies (CoNEXT ’12), pp. 217–228, Nice, France, December 2012. [6] IEEE std 802.11e-2005, 2005. [7] G. Bianchi, “Performance analysis of the IEEE 802.11 distributed coordination function,” IEEE Journal on Selected Areas in Communications, vol. 18, no. 3, pp. 535–547, 2000. [8] L. Romdhani, Q. Ni, and T. Turletti, “Adaptive EDCF: enhanced service differentiation for IEEE 802.11 wireless ad-hoc networks,” in Proceedings of the IEEE Wireless Communications and Networking Conference: The Dawn of Pervasive Communication
[14]
[15]
[16]
[17]
[18]
[19]
[20]
[21]
[22]
[23]
(WCNC ’03), pp. 1373–1378, New Orleans, LA, USA, March 2003. E. Lopez-Aguilera, M. Heusse, Y. Grunenberger, F. Rousseau, A. Duda, and J. Casademont, “An asymmetric access point for solving the unfairness problem in WLANs,” IEEE Transactions on Mobile Computing, vol. 7, no. 10, pp. 1213–1227, 2008. M. Heusse, F. Rousseau, R. Guillier, and A. Duda, “Idle sense: an optimal access method for high throughput and fairness in rate diverse wireless LANs,” ACM SIGCOMM Computer Communication Review, vol. 35, no. 4, pp. 121–132, 2005. M. Natkaniec, K. Kosek-Szott, S. Szott, and G. Bianchi, “A survey of medium access mechanisms for providing QoS in ad-hoc networks,” IEEE Communications Surveys and Tutorials, vol. 15, no. 2, pp. 592–620, 2013. E. Charfi, L. Chaari, and L. Kamoun, “PHY/MAC enhancements and qos mechanisms for very high throughput WLANs: a survey,” IEEE Communications Surveys and Tutorials, vol. 15, no. 4, pp. 1714–1735, 2013. L. X. Cai, X. Shen, J. W. Mark, L. Cai, and Y. Xiao, “Voice capacity analysis of WLAN with unbalanced traffic,” IEEE Transactions on Vehicular Technology, vol. 55, no. 3, pp. 752–761, 2006. Y. Le, L. Ma, W. Cheng, X. Cheng, and B. Chen, “Maximizing throughput when achieving time fairness in multi-rate wireless LANs,” in Proceedings of the IEEE Conference on Computer Communications (INFOCOM ’12), pp. 2911–2915, IEEE, Orlando, Fla, USA, March 2012. K. Hong, S. K. Lee, K. Kim, and Y. H. Kim, “Channel condition based contention window adaptation in IEEE 802.11 WLANs,” IEEE Transactions on Communications, vol. 60, no. 2, pp. 469– 478, 2012. A. Jamali, S. M. S. Hemami, M. Berenjkoub, and H. Saidi, “An adaptive MAC protocol for wireless LANs,” Journal of Communications and Networks, vol. 16, no. 3, pp. 311–321, 2014. S. H. Nguyen, H. L. Vu, and L. L. H. Andrew, “Service differentiation without prioritization in IEEE 802.11 WLANs,” IEEE Transactions on Mobile Computing, vol. 12, no. 10, pp. 2076– 2090, 2013. P. Patras, A. Banchs, P. Serrano, and A. Azcorra, “A controltheoretic approach to distributed optimal configuration of 802.11 WLANs,” IEEE Transactions on Mobile Computing, vol. 10, no. 6, pp. 897–910, 2011. Q. Yu, Y. Zhuang, and L. Ma, “Dynamic contention window adjustment scheme for improving throughput and fairness in IEEE 802.11 wireless LANs,” in Proceedings of the IEEE Global Communications Conference (GLOBECOM ’12), pp. 5074–5080, Anaheim, Calif, USA, December 2012. C.-E. Weng and C.-Y. Chen, “The performance study of optimal contention window for IEEE 802.11 DCF access control,” in Proceedings of the 75th IEEE Vehicular Technology Conference (VTC Spring ’12), pp. 1–5, IEEE, Yokohama, Japan, May 2012. P. Serrano, A. Banchs, P. Patras, and A. Azcorra, “Optimal configuration of 802.11e EDCA for real-time and data traffic,” IEEE Transactions on Vehicular Technology, vol. 59, no. 5, pp. 2511–2528, 2010. K. Kenichi, H. Takefumi, and O. Mamoru, “Technique for dynamically updating EDCA access parameters for WLANs,” Tech. Rep., NTT Access Network Service Systems Laboratories, 2012. P. Patras, A. Banchs, and P. Serrano, “A control theoretic approach for throughput optimization in IEEE 802.11e EDCA WLANs,” Mobile Networks and Applications, vol. 14, no. 6, pp. 697–708, 2009.
12 [24] P. Serrano, P. Patras, A. Mannocci, V. Mancuso, and A. Banchs, “Control theoretic optimization of 802.11 WLANs: implementation and experimental evaluation,” Computer Networks, vol. 57, no. 1, pp. 258–272, 2013. [25] Y. Gao and L. Dai, “Optimal downlink/uplink throughput allocation for IEEE 802.11 DCF networks,” IEEE Wireless Communications Letters, vol. 2, no. 6, pp. 627–630, 2013. [26] P. Dong, J. Wang, H. Wang, and Y. Pan, “Boosting VoIP capacity via service differentiation in IEEE 802.11e EDCA networks,” International Journal of Distributed Sensor Networks, vol. 2015, Article ID 235648, 11 pages, 2015. [27] Y. Le, L. Ma, W. Cheng, X. Cheng, and B. Chen, “A time fairnessbased MAC algorithm for throughput maximization in 802.11 networks,” IEEE Transactions on Computers, vol. 64, no. 1, pp. 19–31, 2015. [28] J. Huang, J. Wang, and J. Ye, “A buffer management algorithm for improving up/down transmission congestion protocol fairness in IEEE 802.11 wireless local area networks,” International Journal of Communication Systems, vol. 27, no. 10, pp. 2228– 2240, 2012. [29] M. Rodrig, C. Reis, R. Mahajan, D. Wetherall, and J. Zahorjan, “Measurement-based characterization of 802.11 in a hotspot setting,” in Proceedings of the Workshop on Experimental Approaches to Wireless Network Design and Analysis (ACM SIGCOMM ’05), pp. 5–10, Philadelphia, Pa, USA, August 2005. [30] A. Schulman, D. Levin, and N. Spring, “On the fidelity of 802.11 packet traces,” in Passive and Active Network Measurement: 9th International Conference, PAM 2008, Cleveland, OH, USA, April 29-30, 2008. Proceedings, vol. 4979 of Lecture Notes in Computer Science, pp. 132–141, Springer, Berlin, Germany, 2008. [31] L. X. Cai, H. V. Poor, Y. Liu, T. H. Luan, X. Shen, and J. W. Mark, “Dimensioning network deployment and resource management in green mesh networks,” IEEE Wireless Communications, vol. 18, no. 5, pp. 58–65, 2011. [32] L. X. Cai, Y. Liu, T. H. Luan, X. S. Shen, J. W. Mark, and H. V. Poor, “Sustainability analysis and resource management for wireless mesh networks with renewable energy supplies,” IEEE Journal on Selected Areas in Communications, vol. 32, no. 2, pp. 345–355, 2014. [33] S. Radhakrishnan, Y. Cheng, J. Chu, A. Jain, and B. Raghavan, “TCP fast open,” in Proceedings of the 7th ACM International Conference on Emerging Networking EXperiments and Technologies (CoNEXT ’11), December 2011.
International Journal of Distributed Sensor Networks
International Journal of
Rotating Machinery
Engineering Journal of
Hindawi Publishing Corporation http://www.hindawi.com
Volume 2014
The Scientific World Journal Hindawi Publishing Corporation http://www.hindawi.com
Volume 2014
International Journal of
Distributed Sensor Networks
Journal of
Sensors Hindawi Publishing Corporation http://www.hindawi.com
Volume 2014
Hindawi Publishing Corporation http://www.hindawi.com
Volume 2014
Hindawi Publishing Corporation http://www.hindawi.com
Volume 2014
Journal of
Control Science and Engineering
Advances in
Civil Engineering Hindawi Publishing Corporation http://www.hindawi.com
Hindawi Publishing Corporation http://www.hindawi.com
Volume 2014
Volume 2014
Submit your manuscripts at http://www.hindawi.com Journal of
Journal of
Electrical and Computer Engineering
Robotics Hindawi Publishing Corporation http://www.hindawi.com
Hindawi Publishing Corporation http://www.hindawi.com
Volume 2014
Volume 2014
VLSI Design Advances in OptoElectronics
International Journal of
Navigation and Observation Hindawi Publishing Corporation http://www.hindawi.com
Volume 2014
Hindawi Publishing Corporation http://www.hindawi.com
Hindawi Publishing Corporation http://www.hindawi.com
Chemical Engineering Hindawi Publishing Corporation http://www.hindawi.com
Volume 2014
Volume 2014
Active and Passive Electronic Components
Antennas and Propagation Hindawi Publishing Corporation http://www.hindawi.com
Aerospace Engineering
Hindawi Publishing Corporation http://www.hindawi.com
Volume 2014
Hindawi Publishing Corporation http://www.hindawi.com
Volume 2014
Volume 2014
International Journal of
International Journal of
International Journal of
Modelling & Simulation in Engineering
Volume 2014
Hindawi Publishing Corporation http://www.hindawi.com
Volume 2014
Shock and Vibration Hindawi Publishing Corporation http://www.hindawi.com
Volume 2014
Advances in
Acoustics and Vibration Hindawi Publishing Corporation http://www.hindawi.com
Volume 2014