Multi-Scale Classification Tasks By Using Visual Words. J. A. dos Santos1,2, ... To create a visual dictionary and, then, an image rep- resentation based on visual ...
Improving Texture Description in Remote Sensing Image Multi-Scale Classification Tasks By Using Visual Words J. A. dos Santos1,2 , O. A. B. Penatti1 , R. da S. Torres1 , P-H. Gosselin2 , S. Philipp-Foliguet2 , A. Falc˜ao1 1 RECOD Lab – Institute of Computing, University of Campinas, Brazil 2 ETIS, CNRS, ENSEA, University of Cergy-Pontoise, France {jsantos,penatti,rtorres,afalcao}@ic.unicamp.br, {gosselin,philipp}@ensea.fr
Abstract Although texture features are important for regionbased classification of remote sensing images, the literature shows that texture descriptors usually have poor performance when compared and combined with color descriptors. In this paper, we propose a bag-of-visualwords (BOW) “propagation” approach to extract texture features from a hierarchy of regions. This strategy improves efficacy of feature as it encodes texture information independently of the region shape. Experiments show that the proposed approach improves the classification results when compared with global descriptors using the bounding box padding strategy.
1
Introduction
The use of high resolution images has allowed the extraction of texture features, in addition to the widely used spectral information. Although texture features are commonly extracted by using techniques developed to generic applications, its extraction on arbitrary-shaped regions obtained by segmentation algorithms is still a problem. Usually, the regions are extended to a rectangular area [7] which can be performed either by obtaining the inner rectangle from the region or by using the region bounding box. The first strategy cannot usually represent the property of the entire region well. The strategy using region bounding box consists of filling the outside area between the region and its box with a pre-defined value to reduce the interference of external pixels in the extracted texture pattern. This process is known as padding [7] and the most common approach is to assign zero to the external pixels (ZR-Padding). Liu et al. [8] have tested different padding techniques. However, there is no analysis about the impact of using the padding strategy in the final classification results. Recently, the use of different texture descriptors in remote sensing image (RSI) classification has been evaluated. In [3], an evaluation of seven successful global descriptors that encode texture information in
RSI applications was performed. In another study [4], three of those descriptors were used by employing a padding strategy. The objective was to evaluate a Multiscale Classification (MSC) approach used to combine texture- and color-based weak classifiers. Experiment results with global descriptors obtained in both works lead to two main conclusions: (1) texture features produce worse results than spectral information in our coffee crop recognition application; and (2) texture features have small contribution to the classification accuracy when combined with descriptors that encode spectral information. Although these conclusions are not surprising, we believe that texture information could be better exploited if its extraction is independent of segmentation. In this paper, we propose a solution based on bag of visual words to extract features from regions independently of their shape. We have also extended this idea to deal with hierarchy of regions [6]. The strategy starts by extracting features from interesting points in the “image level”. Then, starting from the finer scale to the coarser one, the features are propagated to all regions of the hierarchy without having to extract the low-level features again for each hierarchy level. The propagation is performed by grouping into histograms the features that belong to points inside the regions. This approach establishes a relationship between the features of the regions that belong to the same branch of the hierarchy.
2
Bag-of-Visual Words
In this article we use the notion of global and local descriptor that is normally employed in content-based image retrieval. Global descriptors consists in describing an object (image or region, for example) by using all available pixels. Local descriptors, in turn, are extracted from predefined points of interest in the object. Hence, if an object has more than one point of interest in its interior, it can be described by more than one feature vector. A very efficient way to combine the characteristics that describe an object is to group them through the
visual word concept. To create a visual dictionary and, then, an image representation based on visual words, the bag-of-visualwords (BOW), several steps need to be performed and many variations can be employed in each step. Initially, local low-level features are extracted from images. Interest-point detectors or simply a dense grid over the image are used to select images local patches. Literature presents better results for dense sampling in classification tasks [10]. Each local pacth is described by an image descriptor, being SIFT the most popular one. The feature space is then quantized originating the visual words. In spite of the fact that k-means is still a common technique for feature space quantization, due to the curse of the dimensionality, a simple random selection generates dictionaries of similar quality [12]. Given the visual dictionary, image representations are created using it. The feature vectors of images local patches are assigned to one or more visual words in the dictionary. Hard and soft assignment can be used, being soft assignment more robust to feature space quantization problems [11]. While hard assignment assigns to a local patch the label of the nearest visual word in the feature space, soft assignment considers all the visual words near to a local patch, proportionally to their distance. Soft assignment of a local pacth pi to a dictionary of k words can be formally given by Equation 1 [11]: Kσ (D(pi , wj )) αi,j = Pk l=1 Kσ (D(pi , wl )) where j varies from 1 to k, Kσ (x) =
(1)
√ 1 2π×σ
×
2
exp(− 12 σx2 ), and D(a, b) is the distance between vectors a and b. We have used soft assignment in our experiments (σ = 60). The assignment step results in one k-dimensional vector αi for each point in the image. To summarize the set of image local descriptions into one single feature vector, a pooling step is applied. Average and max pooling are popular strategies employed, with an advantage to the latter [1]. Average pooling can PN be formally defined as follows: hj = ( i=1 αi,j )/N . Max pooling is given by the following equation: hj = max αi,j . In both equations, N is the number of points i∈N
in the image and j varies from 1 to k. Bag-of-visual-words (BOW) has been used to encode features in remote sensing applications in other recent works [2, 5, 9]. However, our work differs from them as it considers the problem of extracting features in a hierarchy of regions. Another difference of our work is concerned with the evaluation of several different parameters related to the bag-of-words representation. Finally, we discuss the problems that concern the efficient extraction of texture information in arbitraryshaped regions.
3
Proposed Feature Extraction Model
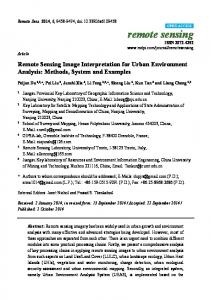
The Multiscale Classification (MSC) approach [4] aims to combine different features at multiple scales of segmentation to perform remote sensing image classification. The strategy is based on the paradigm of boosting, whose principle is to combine weak classifiers to build an efficient global one. MSC exploits a hierarchy of regions, obtained by using the Guigues algorithm [6]. Figure 1 illustrates the process of feature extraction using global descriptors, which is the approach initially adopted to extract texture from the hierarchy in the MSC. At the beginning, several partitions Pλ of hierarchy H at various scales λ are selected. Then, at each scale λ, a set of features is computed for each region R ∈ Pλ . To extract texture features, the bounding box is computed by using the “mean value padding”, as suggested in [8].
Figure 1. Feature extraction using global descriptors. Figure 2 illustrates the strategy of feature extraction using visual words that we propose in this paper. The first step is to define points of interest in the image. Local features are computed for each point of interest. Therefore, the feature extraction is independent of segmentation. At the finer scale λ1 , for each region R ∈ Pλ1 we compute the histogram of visual words based on the features extracted from the interest points that belong to R. Then, from the finer scales to the coarser ones, the features are “propagated” to all regions in the hierarchy. We called “propagation” the process of computing histograms (i.e., bags) of visual words for each region R ∈ Pλi by combining the histograms of its R children. The combination of histograms is performed by adapting the pooling strategies described in Section 2. In the case of max pooling, the histogram of the region R is composed by the maximum values present in the children histograms. Concerning average pooling, we have to keep the amount of points of interest used to compute the histogram of each child. The histogram of the region is a weighted average of its children histograms, where the weight is the amount of points of interest used to compute each child histogram. Note that the process of propagation produces the same histograms that if they are calculated directly from the points of interest. The propagation advantage is that is faster to combine children histograms than directly compute the histograms from the points of interest.
Table 1. Classification results for BOW representation parameters (S=Sampling; DS=Dictionary Size; P=Pooling). S
DS 102
6
Figure 2. Proposed approach to feature extraction using BOW propagation.
4
Experiments
103 104 102
4
103 104
We carried out experiments aiming to address the following questions: What is the impact of extracting features depending on the arbitrary-shaped regions? Which are the best set of parameters to encode texture information using visual words? Are bag-of-visualwords more suitable for RSI classification tasks than using successful global descriptors with padding?
4.1
Setup
RSI Data: The image used was captured by the SPOT satellite and corresponds to the Monte Santo de Minas county, in the State of Minas Gerais, Brazil, a traditional place of coffee cultivation. To evaluate the accuracy, we use a ground-truth mask that indicates all coffee crops in the image. We divided the image into a grid of 3 × 3, generating 9 subimages with dimensions equal to 1000×1000 pixels. We performed experiments with 10 different combinations of the 9 subimages used (3 for training, 3 for validation, and 3 for classification). Classifiers: We use support vector machines with no kernels for each extracted descriptor. Effectiveness measure: To analyze the results, we compute the overall accuracy (O. A.), Kappa index, and Tau index for the classified images. Description: Every region in the RSIs is described by bags-of-visual-words (BOW). We have performed a large evaluation on the parameters of the BOW representation to verify their impact in the final classification. Details are provided in Section 4.2. We have also used QCCH, SID, and Unser as global descriptors baselines. They are selected based on previous results [3].
4.2
Study of BOW Parameters
We have performed experiments to evaluate the impact of BOW parameters. Results are shown in Table 1. We have used dense sampling as it presents better results than interest point detectors in classification experiments [10]. The dense grid samples every image part avoiding not taking points in homogeneous regions or in regions with low contrast, what usually happens with interest point detectors. We have used a very dense
P avg max avg max avg max avg max avg max avg max
O.A. (%) 73.69 ± 2.77 72.71 ± 2.73 71.24 ± 3.46 70.80 ± 3.19 73.48 ± 3.00 73.40 ± 3.48 72.93 ± 2.82 73.22 ± 2.53 71.32 ± 2.96 71.68 ± 2.91 73.74±2.73 72.66 ± 3.74
Kappa (κ) 0.25 ± 0.04 0.22 ± 0.04 0.23 ± 0.06 0.25 ± 0.05 0.18 ± 0.04 0.32 ± 0.06 0.21 ± 0.04 0.21 ± 0.04 0.23 ± 0.05 0.28 ± 0.05 0.20 ± 0.04 0.32 ± 0.06
Tau (τ ) 0.38 ± 0.04 0.37 ± 0.03 0.42 ± 0.03 0.44 ± 0.03 0.29 ± 0.03 0.48 ± 0.04 0.35 ± 0.04 0.34 ± 0.04 0.41 ± 0.03 0.45 ± 0.03 0.31 ± 0.03 0.49 ± 0.04
sampling in the experiments, by overlapping circles of radius 4 and 6 pixels [10], as in the remote sensing images the use of some interest regions can be very small. The difference in classification is very small between the two sampling scales, however we have noticed that the number of regions represented in the finest regions scale is larger for the circles of radius 4. This happens because in our RSIs there are very small regions. The SIFT features extracted from each region in the dense sampled images were used to generate the visual dictionary. We have used a random selection of points, instead of k-means, due to the curse of the dimensionality [12]. We have tested dictionaries of 102 , 103 , and 104 visual words. If very few differences among feature vectors need to be encoded, a large visual dictionary is recommended. However, if some small differences in local textures must be ignored, smaller dictionaries can be useful. The results in Table 1 show that larger dictionaries are more representative, specially considering Kappa and Tau measures. We have also evaluated the impact of different pooling strategies. Average pooling tends to smooth the final feature vector, because assignments are divided by the number of points in the image. If we have many points in the image strongly assigned to some visual words, this information is going to be kept in the final feature vector. However, if only a few points have large visual words associations, they can become very small in the image feature vector. This effect is good to remove noise, but it can also eliminate rare visual words, which could be important for the image description. Average pooling tends to work badly with very soft assignments and large dictionaries, due to the fact that points may have a low degree of membership to many visual words, and computing their average is going to generate a too soft vector. We can see this phenomenon in the low values of Kappa and Tau measures for the dictionary of 104 words in Table 1. Max pooling captures the strongest assignment of each visual word in the image. Therefore, if only one point has a high degree of membership to a visual word, this information will be hold in the image feature vector. Max pooling tends to present better
5 Table 2. Classification results comparing BOW-ZR-Padding and BOW-Propagation. Method ZR-Pad. Propag.
O.A. (%) 64.39 ± 1.78 72.66 ± 3.74
Kappa (κ) 0.0016 ± 0.02 0.3289±0.06
Tau (τ ) 0.2684 ± 0.02 0.4912±0.04
Table 3. Classification results comparing “BOW-Propagation” with the best tested Global Descriptors using “ZR Padding”. Method BOW QCCH SID Unser
O.A. (%) 72.66 ± 3.74 70.36 ± 2.71 69.35 ± 2.52 69.77 ± 3.11
Kappa (κ) 0.3289±0.06 0.1400 ± 0.03 0.0092 ± 0.02 0.1636 ± 0.04
Tau (τ ) 0.4912±0.04 0.3062 ± 0.02 0.1336 ± 0.03 0.3387 ± 0.03
performance for larger dictionaries with softer assignments. In our experiments, max pooling presents better performances with the largest dictionaries. The overall analysis over the results in Table 1 is thatthe largest dictionary size with max pooling produced the best results, specially if we consider the Kappa and the Tau indexes.
4.3
BOW ZR-Padding vs BOW Propagation
Table 2 presents the results comparing BOW with ZR-Padding and BOW with Propagation. The first approach is the well-known region bounding box with outside padding [8]. We use zero padding because it uniforms the value used in all regions of the image. The other approach is the BOW “propagation00 that we propose in this paper (Section 3). Our objective is to investigate the impact of the segmentation in the feature extraction. As we can observe, the Propagation strategy yields better results than the ZR-Padding. We can say that in these experiments, the padding strategy caused a loss of 8.37% in the accuracy of the BOW descriptor. Regarding Kappa index, ZR-Padding produces results with almost no agreement when compared with the ground truth.
4.4
BOW vs Global Descriptors
Table 3 presents the classification results for the BOW and three successful global texture descriptors [3]. The BOW descriptor was used with the BOWPropagation strategy while the global descriptors were extracted by using ZR-Padding. The BOW descriptor yields slightly better overall accuracy than global descriptors. The difference is more perceptible regarding the Kappa and Tau indexes. The BOW descriptor achieves 0.3289 of agreement while the best global descriptor (Unser) achieves Kappa index equals to 0.1636. Observing Tau index, BOW yields results almost 50% better than a random classification, while Unser produces classification 34% better than the random.
Conclusions
In this paper we proposed a new approach to extract texture features from arbitrary-shaped regions by using bag-of-visual-words (BOW) “propagation”. We have carried out experiments: to analyze the BOW parameters in the context of remote sensing image classification; to investigate the impact of using zero-padding to extract texture features; and to compare the efficiency of BOW descriptor using the proposed strategy against successful global texture descriptors. Experiments showed that the proposed approach improves the classification results when compared with global descriptors using the bounding box padding strategy. Future work includes the investigation of the BOW strategy combined with other global descriptors.
6
Acknowledgements
We thank FAPESP (2008/58528-2 and 2009/105548), CAPES, and CNPq for the financial support, and Cooxup´e for the dataset.
References [1] Y.-L. Boureau et al. Learning mid-level features for recognition. CVPR, pages 2559–2566, 2010. [2] L. Chen, W. Yang, K. Xu, and T. Xu. Evaluation of local features for scene classification using vhr satellite images. In JURSE, pages 385 –388, 2011. [3] J. A. dos Santos et al. Evaluating the potential of texture and color descriptors for remote sensing image retrieval and classification. In VISAPP, pages 203–208, 2010. [4] J. A. dos Santos et al. Multiscale classification of remote sensing images. IEEE Trans. on Geoscience and Remote Sensing, PP(99):1–12, 2012. [5] J. Feng, L. Jiao, X. Zhang, and D. Yang. Bag-of-visualwords based on clonal selection algorithm for sar image classification. GRSL, 8(4):691 –695, July 2011. [6] L. Guigues et al. Scale-sets image analysis. IJCV, 68:289–317, 2006. [7] Z. Li et al. Evaluation of spectral and texture features for object-based vegetation species classification using support vector machines. In ISPRS Technical VII Symposium, pages 122–127, 2010. [8] Y. Liu et al. Study on texture feature extraction in region-based image retrieval system. In Multi-Media Modelling, 2006. [9] H. Sun et al. Automatic target detection in highresolution remote sensing images using spatial sparse coding bag-of-words model. GRSL, 9(1):109 –113, 2012. [10] K. van de Sande et al. Evaluating color descriptors for object and scene recognition. TPAMI, 32(9):1582– 1596, 2010. [11] J. C. van Gemert et al. Visual word ambiguity. TPAMI, 32:1271–1283, 2010. [12] V. Viitaniemi et al. Experiments on selection of codebooks for local image feature histograms. In Int. Conf. on Visual Inf. Systems: Web-Based Visual Inf. Search and Management, pages 126–137, 2008.