Texture Feature Neural Classifier for Remote Sensing Image Retrieval Systems MAURICIO POZZOBON MARTINS1, LAMARTINE N. FRUTUOSO GUIMARÃES2, LEILA MARIA GARCIA FONSECA3 1
INPE - Instituto Nacional de Pesquisas Espaciais, Laboratório Associado de Computação e Matemática Aplicada, Av. dos Astronautas, 1.758 - Jd. Granja - CEP 12227-010 São José dos Campos, SP, Brasil.
[email protected] 2 IEAv - Instituto de Estudos Avançados, CTA – Centro Técnico Aeroespacial, Rod. dos Tamoios km 5,5, 12228-840, São José dos Campos, SP, Brasil.
[email protected] 3 INPE - Instituto Nacional de Pesquisas Espaciais, Divisão de Processamento de Imagens, Av. dos Astronautas, 1.758 - Jd. Granja - CEP 12227-010 São José dos Campos, SP, Brasil.
[email protected] Abstract. Texture information is useful for image data browsing and retrieval. The goal of this paper is to present a texture classification system for remote sensing images addressed to the administration of great collections of those images. The proposed classifier is a hybrid system composed by an unsupervised neural network and a supervised one. Starting from a small portion of the image (pattern) the system should recognize the most similar class to a pattern in a database as well as to identify the images that contain similar patterns. The texture feature vectors used to characterize the patterns are obtained from the images processed by a bank of Gabor Filters. Some experimental results using textures of the Brodatz album, multi-spectral and radar images are presented here.
1. Introduction In the last few years a large amount of digital image data has been collected every day. Therefore, it is important the existence of an easy way to store, to organize and to retrieve those image data. Systems developed to organize and to retrieve large digital image collections in a database are called image retrieval systems. Research in this subject can be divided in two major groups: Database Management and Computer Vision [1]. They have studied image data retrieval from two different points of view: text-based and visual-based systems. Text-based image retrieval system use image content annotation and Database Management System (DBMS) to accomplish the image search and recovery through keywords. The data processed by these systems are not the image itself but information related to the image content. This information is represented by concatenated alphanumeric characters (strings) and the queries are performed by traditional languages like SQL (Sequence Query Language). The main drawback is that the manual image annotation and the human perception subjectivity can affect the annotation precision. Two comprehensive surveys on this topic are presented in [2] and [3]. Computer vision researchers have attempted to overcome the difficulties found in the text-based image retrieval process [4, 5, 6]. Instead of using text-based
keywords, the images are indexed by their own visual content data such as color, texture, shape etc. [1]. Aerial and satellite images have become very important for public and private institutions due their various remote sensing applications. One may wish to locate, for instance, all images that contain a certain region such as parking lots, agriculture, train stations, popular house set, highway crossings, bridges, clandestine mines, factories etc. Few works have been focused on remote sensing image retrieval systems [7, 8, 9, 10]. It is evident that there are many difficulties or even the impossibility to perform the manual image browsing and retrieval in a reasonably short time acceptable by the user. This work proposes the development of an image texture classification system addressed to the administration of great remote sensing image collections. The classification system identifies similar objects that belong to the same class that is characterized by texture features. Each object has its specific texture pattern that characterizes the class that it belongs. Besides the texture, other features such as color and shape can also be used to characterize the classes. In this work a texture descriptor based on a multiresolution decomposition using Gabor wavelets has been proposed. Several works have considered the use of texture information for image data retrieval [10, 11, 12, 13, 14]. Manjunath and Ma [11, 12] have performed an evaluation using Gabor filters for texture analysis, but they performed
tests only with aerial photographs. In this work tests with multispectral and radar images, besides aerial photographs, were performed to verify the system robustness in providing suitable texture feature for different kinds of remote sensing images. A brief description of Gabor filters is presented in Section 2. In order to facilitate the pattern retrieval task we propose to use a neural networks that learns how to recognize the similarities among the objects in the feature space. The proposed system is composed by two processing steps: (1) an unsupervised neural network (Kohonen's Self-Organizing Map – SOM and (2) a supervised neural network (Learning Vector Quantization LVQ). The former generates the initial classification map, while the later one refines the initial classification accuracy. The Kohonen’s Self-Organizing Map divides the feature space in different regions. Each region belongs to a specific class that is characterized by a texture feature vector. SOM algorithm is a kind of code and compression system [15] similar to a vector quantization process [16]. Section 3 describes the neural network operation for the proposed system. The network training phase and the region-based feature space representation named “contextual map” are also described in Section 3. The method has been tested on Brodatz’s textures album [17]. Section 4 presents some preliminary results obtained for remote sensing images. 2. Gabor Filter Bank Edge detection is an important step in many computer vision process because edges contain the bulk of information within an image [18]. Another important aspect is that the most interesting features in the images are usually present in many different sizes and orientations. An efficient way of analyzing such features is using multiresolution decompositon based on Gabor wavelets. Wavelets are families of basis functions obtained through dilations and translations of a basic wavelet. This decomposition provides a compact data structure for image representation [19]. The image representation obtained by convolving the original image with Gabor filters has been shown to be an optimum solution in the sense of minimizing the joint two-dimensional uncertainty in the space and frequency [20]. These filters can be used to detect lines and edges of different sizes and orientations. Besides, statistic measures obtained from filtered images can also be used to characterize the underlying texture information.
2.1 Gabor Functions Gabor function describes a complex sinusoid with frequency W modulated by a Gaussian envelope with duration σ. A two-dimensional Gabor function and its Fourier transform can be written as [20]: 2 2 1 exp− 1 x + y + 2πjWx g ( x, y ) = 2 2 2πσ σ 2 σ σ x y y x
(1)
1 (u − W )2 v 2 G (u, v) = exp− + 2 2 σ v 2 σ u
(2)
where σu = 1/2πσx, σv = 1/2πσy and j=(-1)1/2. A selfsimilar filter dictionary can be obtained by appropriate dilations and translations of g(x,y) through the generation function [11]: g mn ( x, y) = a − m g ( x, , y , )
a > 1,
m, n = int eger
x , = a − m ( x cosθ + y sin θ ),
y , = a − m (− x sin θ + y cosθ ),
(3)
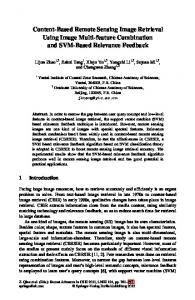
where θ=nπ/K and K is the total number of orientations. The scale factor a-m in (3) is meant to ensure that the energy is independent of m. This set of functions form a non-orthogonal basis of functions for the multiresolution decomposition [20]. Figure 1 shows an example of the real part in the spatial domain of a filter in a certain scale and orientation (eq. 1). The elements of the filter are presented in gray levels to facilitate the wavelet form identification. Figure 2 shows the 3D profile of the same Gabor filter. The amplitude axis indicates the value of the elements.
Figure 1 - The real part of a 64x64 pixels Gabor filter.
amplitude
initial partition of the feature space into clusters of similar patterns. No previous knowledge of similar pattern groups is necessary. Afterwards the neural network weight vectors are submitted to the LVQ process for a fine adjustment. Figure 3 shows the schematic diagram of the classification procedure. Gabor feature vectors
column
SelfOrganizing Map (SOM)
Learning Vector Quantization (LVQ)
Class labels
line Teacher
Figure 2 - The Gabor filter 3D profile.
Figure 3- Texture Neural Classifier.
2.2 Texture Feature Vector Extraction Let I(x, y) and gmn(x, y) be the image and the filter, respectively. The filtered image is [20]: * Wmn ( x, y ) = ∫ I ( x, y ).g mn ( x − x1 , y − y1 )dx1dy1 ,
(4)
where * indicates the complex conjugate. The statistic measures used to generate the texture feature vectors are the mean (µmn) and the standard deviation (σmn) of the Gabor transform coefficient values [11]. Four scales and six orientations have been used in all experiments. Therefore, 24 Gabor filters and feature vectors with 48 elements each one are created as following: f = [µ11 , σ 11 , µ12 , σ 12 ,..., µ 46 , σ 46 ]
(5)
The subscript of each vector component in (5) represents the scale and the orientation numbers. 3. Neural Network and Texture Pattern Recognition According to Haykin [19], artificial neural networks were conceived based on the knowledge that the brain process information in a different way that a digital computer does. The main characteristic of an artificial neural network is its generalization ability. Generalization refers to the fact that the neural network produces appropriate exits for entrances that were not in the training phase (or learning). This makes the neural network an efficient procedure to solve complex problems that, in some cases, are untreatable by conventional methods. Kohonen’s Self-Organizing Map (SOM) and Learning Vector Quantization (LVQ) compose the proposed classification system. Texture features extracted by Gabor filters are input to the SOM algorithm that performs an
A “conscience factor” is used in the training phase in order to perform a correct representation of neurons in the feature map concerning to the statistical distribution of the classes into the original feature space. 3.1 Kohonen's Self-Organizing Map The Kohonen's Self-Organizing Map (SOM) [21] is a special class of unsupervised neural network. These networks are formed by one or two-dimensional neuron grids (larger dimensions are possible but it is not common) that modify their synaptic weights in a competitive learning process. This work proposes a two-layer network to transform high-dimensional input features into a twodimensional discrete map. The topological relationship between different features is preserved. The first neuron layer receives the input features and the second one presents the decision results in a 2-D map. This network can adaptively separate clusters in the feature space. The output neurons are topologically ranked so that neighboring neurons correspond to similar clusters in the high-dimensional feature space [12]. In the competitive learning process, the neurons calculate their respective Euclidean distance values. The closest neuron to the input pattern is declared winner. Starting from the winner neuron, it is established a neuron neighborhood that will receive reinforcement in its synaptic connections. That will build a cooperation base among the neighbors to correlate the input pattern with an area of the neuron grid. Excited neurons modify their individual values through appropriate adjustments. The winner neuron response (and its neighborhood) gets better whenever a similar pattern to the one that previously excited it is applied to the net. A lateral interaction in the winner neuron neighborhood is necessary to influence the neighboring neurons and therefore to recognize similar patterns. This
excitation area is function of the distance between the winner neuron and others: as the larger distance the weaker adjustments are applied [21]. It is also important that this lateral interaction includes the entire neuron grid in the initial learning stage (ranking phase) and only a few or just one neuron is included in the final processing (converging) phase [15]. A Gaussian function has been used to perform the lateral interaction process. Figure 4 shows a Gaussian neighborhood function at three different learning stages, from the beginning (left) to the end (right).
A fine-tuning process is performed in a second phase using a Learning Vector Quantization (LVQ) algorithm [20]. The LVQ improves the feature space partition by “moving” the weight vectors away from the decision borders. Kohonen has developed three algorithms named LVQ1, LVQ2 and LVQ3 [21]. The later one has presented better results than the others have and it was chosen to be implemented [8, 20]. 4. Results Discussion Initial tests were performed to evaluate if the feature vectors can efficiently represent their respective texture patterns for the Euclidean distance-based classification. This method has been tested on the Brodatz’s album [17] as well as on remote sensing images. The neural classification system was tested only for the Brodatz’s album (Figure 5).
Figure 4- Gaussian neighborhood function in 3 stages. 3.2 Conscience Factor on Kohonen's Map The Kohonen’s map fails in representing the feature space statistical distribution. Computational simulations have demonstrated that the SOM algorithm represents lowdensity input features excessively whereas high-density input features are poorly represented [15]. The conscience factor in Kohonen net aims to get a probability about 1/N of a neuron in the output layer to be chosen to represent an input pattern [22]. In other words, the conscience algorithm is a modification of the SOM algorithm that forces the density matching to be exact [23]. The conscience algorithm registers how many times each neuron wins the competition [15]. If a neuron wins frequently it “feels guilty” and leaves the competition preventing poor representations of high-density input features and favoring the better proportion between the feature space and its representation map. 3.3 Learning Vector Quantization The SOM algorithm provides an unsupervised initial partition of the feature space into a number of distinct clusters. The patterns belonging to each cluster are topologically similar. After this first phase, the output neurons are labeled using the training feature vectors. The output neurons are assigned to different classes by majority voting. The feature map aims to approximate the input feature vectors or their probability density function [8]. A network fine-tuning phase is necessary to improve the classification accuracy.
Figure 5- Textures classes from Brodatz’s album.
4.1 Feature Vector Validation Some experiments were performed using the Brodatz's album with 32 classes [17]. The idea is to evaluate the suitability of the texture feature for the classification process. The distance between the feature vectors that belong to the same class should present the smallest value. Each class has 16 patterns. Euclidean distances between each two different patterns were calculated. The retrieval system evaluation has been accomplished by verifying how many feature vectors belonging to the same class are among the first 16 retrievals. If all of the 16 first retrievals belong to the pattern class one has 100% of success. Figure 6 presents the success percentages for each one of the 32 classes using texture features and Euclidean distance normalized by the standard deviation.
100 80 60 40 20 0
Figure 6- Success percentage in classification.
Figure 8- Radar image. Query texture (left). Returned ones (rigth).
Another way to evaluate the classification system performance is through the kappa coefficient [24]; the larger the value of Kappa the better the classification system performance (kappa