IMPUTATION OF RAMP FLOW DATA USING THE ASYMMETRIC CELL TRANSMISSION TRAFFIC FLOW MODEL
Ajith Muralidharan ∗
Roberto Horowitz
Department of Mechanical Engineering University of California Berkeley, California 94720 Email:
[email protected]
Department of Mechanical Engineering University of California Berkeley, California 94720 Email:
[email protected]
ABSTRACT The Asymmetric Cell Transmission model can be used to simulate traffic flows in freeway sections. The model is specified by fundamental diagram parameters- determined from mainline data, and on-ramp and off-ramp flows. The mainline flow/density data are usually efficiently archived and readily available, but the ramp flow data are generally found missing. This paper presents an imputation technique based on iterative learning control to determine these flows. The imputation technique is applied sequentially on all the segments of the freeway, and the ramp flows, which minimize the error between the model calculated densities/flows and measurements are investigated. The stability and convergence of the density and flow errors using the imputation updates is also presented. Finally an example is shown to illustrate its use in a practical scenario.
1 INTRODUCTION Traffic flow simulations using models provide cheap and tunable tools to study the operation of a freeway. These models can be used to study benefits of different improvement strategies like ramp metering and demand management. First order models, especially the Cell transmission models (CTM) [1] are used frequently to simulate traffic flows and design control strategies. The asymmetric cell transmission model [2] is a modified version of the CTM, particularly suited to simulating traffic flows in freeways. CTMSIM [3] is an interative tool in Matlab which simulates the freeway operation using the ACTM. ∗ Address
all correspondence to this author.
Traffic flow simulations using the ACTM requires the freeway model to be specified with parameters and inputs. The essential parameters includes the fundamental diagram for the freeway sections while the inputs are typically on-ramp flows and off-ramp flows/split ratios. Typically the model is specified / calibrated to re-create the basic operation of the freeway observed on any particular day. The veracity of the model/simulation technique is usually established by good conformation of different simulated quantities (E.g. Flows and speeds) with the measured data. California freeways are equipped with loop detector based vehicle detector stations, which record flow, density and occupancy data at their location. PeMS [4] is an online archival tool that stores these data. The fundamental diagram can be specified using the flow and density measurements from the mainline vds (positioned along the freeway). The onramp flows and offramp flows are specified by the flow data obtained from the ramp detector data, if available. Ramp flow data is typically found missing over some segments and sometimes even over entire critical sections of the freeway. Thus, in order to specify a simulation model, imputation (estimation) of these ramp flows gain importance. Traditionally, short term prediction/imputation of missing data in loop detectors has been investigated using various techniques like time series analysis [5] and Kalman filters [6]. Recently, Chen et.al [7] have used a linear regression based imputation procedures to successfully predict missing data in freeway mainline loop detector stations over long periods. This method cannot be applied to impute missing data in on-ramp or off-ramp vehicle detector stations, since we cannot guarantee a high correlation of data between neighboring ramp loop detector stations.
Hence, model based imputation procedures are required to determine missing ramp flow data. In [8], ramp flow imputation algorithms have been proposed using the Link Node Cell Transmission model. [9] proposes a imputation algorithm using the ACTM. Though these algorithms have been successfully applied for ramp flow imputation, no proof of stability/convergence is currently available for these algorithms. This paper introduces a new iterative learning based adaptive identification of the ramp flows using the ACTM. A rigorous stability/convergence proof of the proposed algorithm is presented using a Lyapunov functional approach. The proof is constructive in that a points to a number of significant additions and modifications that must be introduced to the algorithm presented in [9] in order to satisfy the conditions imposed by the stability/convergence analysis, which in turn enhance the performance of the algorithm. Section 2 contains a short review of the ACTM used for freeway corridor simulation. Section 3 presents the imputation algorithm used for determining ramp flows. Section 4 analyzes the stability and convergence of the imputation procedure. Finally, section 5 demonstrates the imputation algorithm on data from a small section of the I-210W freeway in the Los Angeles area.
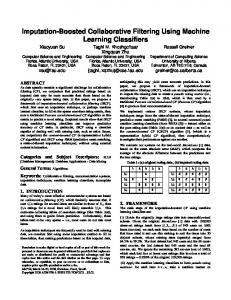
2 ASYMMETRIC CELL TRANSMISSION MODEL This section presents a short summary of the ACTM [2]. The freeway is specified as a sequence of segments, each with a onramp near the beginning of the section and an off-ramp near the end of the section. Figure 1 shows the freeway divided into N sections or cells, where vehicles move from left to right. Boundary conditions can be specified in different ways. Vehicles can be specified to enter the freeway through an on-ramp while the downstream end is assumed to be in free-flow (BC-1). Another variation of BC-1 assumes the downstream to be in free-flow, while the upstream flow is directly fed into the freeway through a queue. Density of the cells upstream of the first section and downstream of the last section can also be specified as the boundary conditions for simulation (BC-2). While BC-2 is appropriate to simulate the base scenario, BC-1 is preferred for simulation, especially under ramp control, since the control strategy usually modifies the densities at the boundaries. It must be noted that BC-1 places restrictions on the freeway sections chosen for simulation, since the beginning and end of the freeway section simulated should always be in free-flow. Table 1 lists the model variables and parameters. Each section of the freeway is characterized by a fundamental diagram (Figure 2) which specifies its traffic flow characteristics. The section length are absorbed in the fundamental diagram parameters for convenience. The ACTM is a time and space discretization of the LWR equation. Thus the ACTM can also be represented as a continuous
Figure 1.
FREEWAY WITH N SECTIONS.
Symbol
Name
Fi
maximum flow (capacity) of section i
vi
free flow speed of section i
wi
congestion wave speed of section i
nci
critical density of section i
nJi
jam density of section i
fi (k)
flow from section i to i − 1 at time/period k
si (k),ri (k)
off-ramp, on-ramp flow in section i at time/period k
ni (k)
number of vehicles in section i at time/period k
Q(k)
number of vehicles in the input queue to section 1 at time/period k
fin (k)
input flow at upstream queue at time/period k Table 1. MODEL VARIABLES AND PARAMETERS.
Figure 2.
FUNDAMENTAL DIAGRAM OF SECTION i.
time spatially discretized model, as presented here. Also, the general model can be specified with off-ramp flows or off-ramp split ratios. We will consider the version with off-ramp flows, as these flows can also be converted easily to split ratios. Also, we will consider a variation of BC-1 where the upstream flow is directly fed into the freeway through a queue.
The following equations describe the model. n˙ i (k) = fi−1 (k) − fi (k) + ri (k) − si (k),
1≤i≤N
= min(vi ni (k) − si (k), wi+1 [nJi+1 − ni+1(k)], Fi )
fi (k) fN (k) = min(vN nN (k) − sN (k), FN )
1≤i≤N
process considered. In this case, since the freeway flows, densities and ramp flows are assumed 24 hour periodic, T = 24hours. Some typical kernel functions include a impulse or a gaussian window centered at time k.
f0 (k) = min(w1 [nJ1 − n1 (k)], Q(k) + fin (k)) Q(k + 1) = Q(k) + fin (k) − f0 (k)
(1)
When density boundary conditions (n0 and nN+1 ) are specified, the model is specified as n˙ i (k) = fi−1 (k) − fi (k) + ri (k) − si (k)
Figure 3.
1≤i≤N
fi (k) = min(vi ni (k) − si (k), wi+1 [nJi+1 − ni+1(k)], Fi ) 1 ≤ i ≤ N (2) where wN+1 and nJN+1 are the congestion wave speed and jam density of the cell directly following the boundary. The flow fi (k) is said to be in free-flow if vi ni (k) − si (k) < min[wi+1 [nJi+1 − ni+1(k)], Fi ]
(3)
and otherwise it is in congestion. Thus with respect to each section, the input flow (from upstream) can be either in free-flow or in congestion and the out flow (to downstream section) can also be either in congestion/freeflow. Thus in each of the four cases, the density and the flow equations can be combined to a single update equation. Thus the model can also be represented using a four mode model.
3 IMPUTATION ALGORITHM Ramp flow imputation is based on the ACTM. Typically the vehicle detector stations report the flow and density profiles. Ramp flows are imputed such that the density and flow profiles with the estimated ramp data match the actual measurements from the freeway. The procedure has been extended from the adaptive iterative identification technique described in [10, 11]. It is assumed that the density and ramp flow profile is 24 hour periodic, and the on-ramp and off-ramp flows are represented as a convolution of a kernel on a constant periodic ramp parameter (influence) vector.
r(k) =
Z T 0
Kr (τ, k)cr (τ)dτ,
s(k) =
Z T 0
Ks (τ, k)cs (τ)dτ
(4)
where Kr (τ, k) and Ks (τ, k) represent periodic, time dependent kernel functions with period T , which is also the period of the
IMPUTATION PARAMETERS AND CELL DEFINITIONS
The structure of the ACTM allows us to decouple the estimation of ramp flows. The imputation proceeds section by section sequentially, starting from the most upstream section 1. For estimation of section i ramp flows, we consider the immediate upstream section i − 1 and the immediate downstream section i + 1. The upstream section is specified with the subscript up and the downstream section is specified with the subscript dn. The superscript i denotes the current section that is imputed. Figure 3 shows the parameters and measurement data used for imputation of ramp flows in section i. The upstream boundary conditions includes the upstream density, fundamental diagram parameters as well as the off-ramp flow siup . The imputation proceeds sequentially from upstream to downstream and either siup or its estimate is available. Since all the parameters and variables carry the superscript i, for clarity, we we drop the superscript in the following equations. Traffic data nup (k), n(k), ndn (k), sup (k) and fdn (k) are assumed to be periodic with period T = 24hours . Ramp flows ri (k) and si (k) are also assumed to be periodic. These assumptions are not restrictive, as the freeway is observed to be in free flow, with low densities at midnight.Thus, unknown on-ramp and/or off-ramp flows are estimated indirectly by estimating their respective influence coefficients cˆr and cˆs using a repetitive adaptive learning algorithm [10, 11], which runs continuously cycling through the 24 hour traffic data. For each section, the imputation procedure assumes initial estimates for the ramp parameter functions cˆr and cˆs . These estimates are then adapted so that the model calculated densities match with the density profile recorded in the vehicle detector station. Let P represent Plant (i.e the actual system described using the ACTM) while M represent the Model, calculated using the estimates. The model variables and the estimates are represented with a ˆ (n, ˆ rˆ etc.) and the errors with a ˜ (e.g. n(k) ˜ = n(k) − n(k), ˆ where n(k) is the section’s measured number of vehicles and n(k) ˆ is the number of vehicles generated by the model at instant k). The actual variables are represented without
any accent. Table 2 presents the various modes considered in the imputation where w¯ dn (k) = min(
F , w) nJdn − ndn(k)
(5)
The modes considered here only refer to the flow conditions downstream (i.e out of the section considered), i.e P − F and P − C correspond to free-flow and congested flow conditions downstream respectively.
(d) P-F , M-C (plant is in free flow and model is in congestion downstream)
Case(i)
n(k) ˜ w¯ dn (k)[nJdn − ndn (k)]
cˆ˙r (τ, k) = G1 Kr (τ, k)n(k) ˜ cˆ˙s (τ, k) = −G2 Ks (τ, k) f˜dn (k)
The mode dependent adaptation laws for the parameters at each step are given by (a) P-F , M-F (plant and model are both in free-flow downstream)
n(k) ˜ = n(k) − n(k) ˆ ˙ˆ = fˆu − fˆd + rˆ(k) − s(k) n(k) ˆ − an(k) ˜
rˆ(k) =
Z T 0
(6)
(b) P-C , M-C (plant and model are both in congestion downstream)
(7)
(c) P-C , M-F (plant is in congestion and and model is in free flow downstream) Case(i)
n(k) ˜ >0
c˙ˆr (τ, k) = G1 Kr (τ, k)n(k) ˜ f˜dn (k) + | f˜dn (k)| c˙ˆs (τ, k) = −G1 Ks (τ, k)n(k) ˜ − G2 Ks (τ, k) 2 Case(ii)
n(k) ˜ ≤0
c˙ˆr (τ, k) = G1 Kr (τ, k)n(k) ˜ ˙cˆs (τ, k) = −G2 Ks (τ, k) f˜dn (k)
(8)
(10)
fˆu = min(nup (k)vup − sup (k), Fup , w(nJ − n(k))) ˆ J ˆfd = min(n(k)v ˆ − s(k), ˆ w¯ d n(k)(ndn − ndn(k)))
s(k) ˆ =
Z T 0
cˆ˙r (τ, k) = G1 Kr (τ, k)n(k) ˜ cˆ˙s (τ, k) = −G1 Ks (τ, k)n(k) ˜
(9)
where G’s are user defined positive gains.The model density update at each steps is given by
Table 2. PLANT AND MODEL MODES.
cˆ˙r (τ, k) = G1 Kr (τ, k)n(k) ˜ cˆ˙s (τ, k) = −G2 Ks (τ, k) f˜dn (k)
n(k) ˜ ≥0
Kr (τ, k)cˆr (τ, k)dτ Ks (τ, k)cˆs (τ, k)dτ
f˜dn (k) = fdn (k) − (n(k)v − s(k)) ˆ
(11)
The parameter a in (10) is chosen so as to make the error equations asymptotically stable. In the update equations, on-ramp flows are always updated to decrease the density error, and hence the update are proportional to the current density error. The offramp flows are either adapted using the the density error (terms with gain G1 ) and/or downstream flow error (terms with gain G2 ), depending on the mode. This ensures that the downstream flow error also decreases during the imputation.
While the parameter and model density update equations are given in continuous time, the model is implemented in discrete time with a small time step and small gains, so that the imputation procedure as well as the model are stable. Typically the time step ∆t is chosen such that Vmax ∆t < 1, where Vmax ≥ vi for i = 1, · · · N and vi is the free flow speed at section i. The adaptation is carried out for the entire density profile multiple times, so i i as to reduce the ‘errors’ ∑ |ni (k) − nˆ i (k)| and ∑ | fdn (k) − fˆdn (k)|. This procedure is repeated until the error becomes insignificant or stops decreasing.
4 STABILITY AND CONVERGENCE
Case (b) : Plant upstream (F), Model upstream (C)
In this section, we will study the stability and convergence of the density errors under the adaptation laws given in Section 3. The error equations are given by
fu (k) = min(Fup , nup (k)vup − sup (k))) fˆu (k) = w(nJ − n(k)) ˆ
˙˜ = f˜u (k) − f˜d (k) + r˜(k) − s(k) n(k) ˜ − an(k) ˜ r˜(k) =
Z T 0
s(k) ˜ =
Z T 0
0≤ζ≤1
f˜u (k) = −ζwn(k) ˜ since
(12)
w(nJ − n(k)) > min(Fup , nup (k)vup − sup (k))) > w(nJ − n(k)) ˆ
Kr (τ, k)c˜r (τ, k)dτ
(14)
Ks (τ, k)c˜s (τ, k)dτ
Case (c) : Plant upstream (C), Model upstream (C) fu (k) = w(nJ − n(k)) fˆu (k) = w(nJ − n(k)) ˆ
We will also show that the downstream flow converges in all the modes.
f˜u (k) = −wn(k) ˜ The condition stated below will be used in the following lemma and theorems.
Condition 4.1. For the system described in Figure 3, the following conditions apply: (1) sup (k) = sˆup (k) when the plant upstream is in free-flow. (2) w(nJ − n(k)) < min(Fup , nup (k)vup − sˆup (k))) when the plant upstream is in congestion.
(15)
Case (d) : Plant upstream (C), Model upstream (F) fu (k) = w(nJ − n(k)) fˆu (k) = min(Fup, nup (k)vup − sˆup(k))) 0≤ζ≤1
f˜u (k) = −ζwn(k) ˜ since
w(nJ − n(k)) < min(Fup , nup (k)vup − sˆup(k))) < w(nJ − n(k)) ˆ (16)
Condition 4.1 guarantees that the upstream off ramp estimation error s˜up (k) = sup (k) − sˆup (k) is either zero or it does not affect the estimation errors in the current section. For the freeway described in Figure 1, this condition is easily achieved for the first cell (i=1) and as it will later be shown by induction in Theorem 4.2, it will apply to all cells.
Lemma 4.1. For the system described by Figure 3, given nup, sˆup , ndn , fdn , n and the fundamental diagram parameters for all the cells, under Condition 4.1, f˜u (k) = fu (k) − fˆu (k) is given by f˜u (k) = −ζwn(k) ˜ where 0 ≤ ζ ≤ 1
Proof. Depending on the upstream flow condition in the model and plant, the system falls into four modes. Case (a) : Plant upstream (F), Model upstream (F)
Theorem 4.1. For the system described in Figure 3, given nup, sˆup , ndn , fdn , n, and the fundamental diagram parameters for all the cells, the parameter updates laws in Section 3 stabilize the error equations (8) when Condition 4.1 applies. Moreover, s(k) = s(k) ˆ when the plant downstream is in free-flow and w¯ dn (nJdn − ndn (k)) ≤ min(Fup , nup (k)vup − sˆup (k))) otherwise. Proof. Consider the Lyapunov functional V (k) (and its time derivative) given by 1 1 V (k) = n(k) ˜ 2+ 2 2G1
Z T
˙˜ + V˙ (k) = n(k) ˜ n(k)
˙ c˜r (τ, k)G−1 1 c˜r (τ, k)dτ
+
fu (k) = min(Fup , nup (k)vup − sup (k))) fˆu (k) = min(Fup , nup (k)vup − sup (k))) f˜u (k) = 0
Hence f˜u (k) = −ζwn(k) ˜ where 0 ≤ ζ ≤ 1, i.e it is a stabilizing term for the error equations.
Z T 0
(13)
Z T 0
0
c˜r (τ, k)2 dτ +
˙ c˜s (τ, k)G−1 1 c˜s (τ, k)dτ
1 2G1
Z T 0
c˜s (τ, k)2 dτ
(17)
We need to show that V˙ (k) is negative semi-definite, for the error equations to be stable.
From lemma 4.1, we see that f˜u (k) = −ζwn(k) ˜ for some 0 ≤ ζ ≤ 1, irrespective of the mode of the plant/model with respect to upstream flow. Hence, the error equations can be simplified into four cases corresponding to the downstream flow. The following equations show that V˙ (k) ≤ 0 in all the four cases.
In this case n(k)v ˆ − s(k) ˆ ≤ w¯ dn (nJdn − ndn(k)) ≤ n(k)v − s(k), ˙˜ = −(ζw + a)n(k) n(k) ˜ − w¯ dn (nJdn − ndn(k)) + n(k)v ˆ − s(k) ˆ +
Z T 0
Kr (τ, k)c˜r (τ, k)dτ −
Z T 0
Ks (τ, k)c˜s (τ, k)dτ
= −(ζw + a + v)n(k) ˜ − w¯ dn (nJdn − ndn(k)) + n(k)v − s(k) (i) P-F, M-F +
Z T 0
˙˜ = −ζwn(k) n(k) ˜ − vn(k) ˜ +
Z T 0
(a) n(k) ˜ >0 Kr (τ, k)c˜r (τ, k)dτ c˙˜r (τ, k) = −G1 Kr (τ, k)n(k) ˜
c˙˜r (τ, k) = −G1 Kr (τ, k)n(k) ˜ ˙c˜s (τ, k) = G2 Ks (τ, k) f˜dn (k) = −G2 Ks (τ, k)s(k) ˜ V˙ (k) = −(a + v + ζw)n(k) ˜ 2 + n(k) ˜ n(k) ˜
Z T 0
Kr (τ, k)c˜r (τ, k)dτ
Kr (τ, k)c˜r (τ, k)dτ −
Z T 0
Kr (τ, k)c˜r (τ, k)dτ−
G2 s(k) ˜ 2≤0 G1
(18)
(ii) P-F, M-C In this case n(k)v ˆ − s(k) ˆ ≤ w¯ dn (nJdn − ndn(k)) ≤ n(k)v − s(k), ˙˜ = −(ζw + a)n(k) n(k) ˜ − n(k)v + s(k) + w¯ dn(nJdn − ndn(k)) + r˜(k) − s(k) ˜ = −(ζw + a + v)n(k) ˜ − n(k)v ˆ + s(k) ˆ + w¯ dn (nJdn − ndn (k)) + r˜(k)
f˜dn (k) + | f˜dn (k)| c˙˜s (τ, k) = G1 Ks (τ, k)n(k) ˜ + G2 K(k) 2 V˙ (k) = −(a + ζw)n(k) ˜ 2 − n(k)( ˜ w¯ dn (nJdn − ndn(k)) − n(k)v ˆ + s(k)) ˆ + n(k)˜ ˜ r (k) − n(k) ˜ s(k) ˜ − n(k)˜ ˜ r (k) + n(k) ˜ s(k) ˜ ˜ ˜ G2 fdn (k) + | fdn (k)| + s(k) ˜ ≤0 G1 2 (b) n(k) ˜ ≤0 c˙˜r (τ, k) = −G1 Kr (τ, k)n(k) ˜ ˙c˜s (τ, k) = G2 Ks (τ, k) f˜dn (k) ≥ 0 Also, 0 ≥ n(k)v ˜ ≥ s(k) ˜ V˙ (k) = −(a + ζw + v)n(k) ˜ 2 − n(k)( ˜ w¯ dn (nJdn − ndn(k)) − n(k)v + s(k)) + n(k)˜ ˜ r (k) − n(k) ˜ s(k) ˜ + s(k) ˜ f˜dn (k) ≤ 0 (20)
(a) n(k) ˜