Journal of the Eastern Asia Society for Transportation Studies, Vol. 6, pp. 2629 - 2638, 2005
INCIDENT DETECTION USING A FUZZY-BASED NEURAL NETWORK MODEL Daehyon KIM Assistant Professor Transportation & Logistics System Eng. Yosu National University Dundeok-Dong, Yeosu-Si, Jeollanam-Do, Korea Fax: +82-61-659-3349 E-mail:
[email protected]
Seungjae LEE Associate Professor Dept of Transportation Eng. University of Seoul Dongdaemun-Ku, Seoul, Korea Fax: +82-2-2210-2653 E-mail:
[email protected]
Abstract : Incidents on the freeway disrupt traffic flow and the cost of delay caused by the incidents is significant. To reduce the impact of an incident a traffic management center needs to quickly detect and remove it from the freeway. In this vein quick and efficient automatic incident detection has been the main goal of the transportation research for many years. Also many algorithms based on loop detector data have been developed and tested for automatic incident detection. However, many of them have a limited success in their overall performance in terms of detection rate, false alarm rate, and the mean time to detect an incident. The objective of this paper is to propose a robust and reliable method for detecting an incident on the freeway using a fuzzy based neural network model, Fuzzy ARTMAP which is a supervised, self-organizing system claimed to be more powerful than many expert systems, genetic algorithms, or other neural network models like Backpropagation. The experiments have been done with simulated data, and the results show that Fuzzy ARTMAP has the potential for the application of automatic incident detection in the real world, where a large number of incident data is not always available for training. Key Words: Incident detection, Backpropagation, Fuzzy ARTMAP
1. INTRODUCTION An incident is non-recurrent event that causes a severe reduction or an abnormal increase in the demand of a transportation facility. The function of Automotive Incident Detection (AID) is to automatically identify the occurrence of unpredictable incidents that affect the capacity of freeways so that appropriate response and clearance procedures can be executed to minimize the effects of the incident on traffic operation. Since the 1970s, there has been growing interest in the incident detection, and a variety of algorithms have been developed (Dudek, et al. 1974; Ahmed and Cook, 1982; Busch and Fellendorf, 1990; Chassiakos, et al. 1993). Unfortunately, the algorithms developed to date have had only limited operational success, and it is clear that improved algorithms are needed to make loop data based incident detection technology operationally effective. Specifically, existing algorithms have been largely ineffective in maintaining the high degree of reliability required in practice (e.g., high detection rate and low false alarm rate).
2629
Journal of the Eastern Asia Society for Transportation Studies, Vol. 6, pp. 2629 - 2638, 2005
In order to achieve the better performance on the incident detection, some researches (Ritchie and Cheu, 1993; Payne, Payne and Thompson, 1997) have used Artificial Neural Networks which hold considerable potential for recognizing and classifying spatial and temporal patterns in traffic data. The findings of previous researches indicates that neural network models have the potential to achieve significantly better performance in terms of detection rate and false alarm rate, as well as operational improvements in real-time incident detection over more conventional algorithms such as a series of California algorithms and McMaster algorithm(Hall, et al., 1993). Even though there are currently many different types of neural network models available, the multilayer feedforward with backpropagation learning algorithm, usually called Backpropagation (Rumelhart, et al. 1986), has been the most popular neural network for the incident detection. However, the Fuzzy ARTMAP(Carpenter et al, 1992) has been claimed to have better performance than the Backpropagation, in terms of predictive accuracy, in experiments with benchmark data (Carpenter et al., 1994 a, 1994b) and with signal processing data (Young, 1995). For the automatic incident detection, Fuzzy ART(Carpenter et al., 1991a), the previous version of Fuzzy ARTMAP, has been used and shown to have better performance than the Backpropagation(Ishak, 1999). In this research, Fuzzy ARTMAP(Carpenter et al, 1992) has been applied for automatic incident detection. The network performance of the Fuzzy ARTMAP has been compared with the results of the Backpropagation to investigate how the network performance, in terms of detection rate and false alarm rate, would be different. Another important issue in this research is to see how the number of incident and non-incident data sets available for training would effect the network performance on two different neural network models.
2. BACKPROPAGATION AND FUZZY ARTMAP Backpropagation is an error-correcting learning procedure that generalizes the delta rule (Rumelhart et al., 1986a) to multilayer feedforward neural networks with hidden neurons between the input and output vectors. Up to now, feedforward network with the error backpropagation learning rule has been the most popular neural network. It has been applied in various problems successfully. However, there remain some problems associated with their use. First, Backpropagation can only learn slowly in an off-line setting with an essentially stationary environment (Carpenter, 1989; Grossberg, 1987; Rumelhart et al., 1986). Second, the computing cost for training in the Backpropagation is very high. Even though the computing cost is not currently high with rapid improvement of computer technology, it may still be a problem when we deal with a large number of data sets and input units. Third, There is no rule for the proper selection of the network topology. The number of hidden units to use in the hidden layer(s) cannot be easily determined beforehand. Fourth, there is the possibility of being trapped at a local minimum during the training process, preventing the network from converging to a more desirable error value. Gradient descent methods are in general very susceptible to local minima and flat spots, and the Backpropagation algorithm is not immune to this. Despite the unsolved issues as described above, Backpropagation has been used as a representative model with which to compare newly developed neural network model because of its popularity and a good performance on various problems. On the other hand, Fuzzy ARTMAP has an on-line learning mechanism and the superior performance with very low computing costs for training. Fuzzy ARTMAP is a combination of 2630
Journal of the Eastern Asia Society for Transportation Studies, Vol. 6, pp. 2629 - 2638, 2005
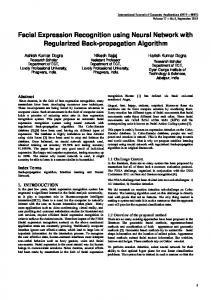
fuzzy logic and Adaptive Resonance Theory (ART). Since ART1 (Carpenter and Grossberg, 1987a) has been developed, a series of ART models, which are based on ART1 module, have been developed. They include ART2 (Carpenter and Grossberg, 1987b) which handles analogue inputs, Fuzzy ART (Carpenter et al., 1991a) which incorporates computations from fuzzy set theory in to ART1 model, ARTMAP (Carpenter et al., 1991b) which is supervised learning system on ART modules, and Fuzzy ARTMAP which is supervised learning system and achieves a synthesis of fuzzy logic and ART neural network. Fuzzy ARTMAP consists of two fuzzy ART modules, ARTa and ARTb, connected by an inter-ART module, Fab, called the map field. ARTa and ARTb create stable recognition categories in response to arbitrary sequences of input patterns. Each module receives either the input or output component of each pattern pair to be associated. The main function of the map field is to associate representations of the pattern pair components. When there is mismatch between the prediction by ARTa and actual ARTb input, the map filed subsystem, match tracking, is activated, The match tracking raises the ARTa vigilance ρa by just the amount needed to cause a mismatch and reset in the ARTa module. Then, the ARTa search system is activated to have either an ARTa category that correctly predicts an actual ARTb input or a previously uncommitted ARTa category node. The algorithm can be summarized as follows: Summary of Fuzzy ARTMAP Algorithm Step 0. Let m be the number of input units, n be the number of output units, M be the number of units on F2a , and N be the number of units on F2b . Initially, all the adaptive weights Wja , Wkb and Wjkab are set equal to 1, i.e. W ja1 ( 0) =... = W ja2 m ( 0) = 1
Wkb1 ( 0) =... = Wkb2 n ( 0) = 1 W jkab ( 0) = 1 where j = 1, ..., M and k =1,..., N Initialize all category nodes of ART modules, ARTa and ARTb, by making them uncommitted. Set the parameters: the choice parameter α > 0; the learning rate parameter β∈[0,1]; and the vigilance parameters ρ a , ρ b , ρ ab ∈[0,1] . Set the ARTa vigilance parameter, ρ a , to the baseline vigilance, ρ a . Step 1. Present a binary or analogue vector a and the corresponding class vector b. The vector a is input to module ARTa and the vector b is input to module ARTb. All input values of vector a must be within the range [0,1]. If not, i.e. the inputs to the ARTa are analogue, then the input vector a should be normalized( Kim, 1999a for more details in normalization). The complement coding is also required to preserve amplitude information, then the complement coded input vector A = (a , a c ) = (a1 ,... a m , a1c ,..., a cm ) is input to the field F1a and the input vector B = (b, b c ) = ( b1 ,... b n , b1c ,..., b cn ) to the field F1b . These are 2m -dimensional and 2ndimensional vectors respectively. Complement coding and normalization of input vectors solve the category proliferation problem (Carpenter et al , 1991).
2631
Journal of the Eastern Asia Society for Transportation Studies, Vol. 6, pp. 2629 - 2638, 2005
Step 2. For each input A and B, the jth node in the layer, F2a , and kth node in the layer, F2b , are given by
T j (A ) =
A ∧ W ja
α + W ja
and Tk ( B) =
B ∧ Wkb
α + Wkb
,
where the fuzzy MIN operator ∧ is defined to be ( x ∧ y ) i = min( xi , yi ) , α is a choice
parameter, and the norm | . | is defined to be x = ∑ xi for any vectors x and y. i
Step 3. Use a winner-take-all rule to select the winner. This yields the maximum weighted sum. The winners of ARTa and ARTb are indexed by J and K respectively, where J = max T j (A ): j = 1,..., M and K = max{Tk ( B): k = 1,..., N }
{
}
If more than one node is maximal on each module, the node with the smallest index is chosen to break the tie. Step 4. Check the vigilance criteria. If nodes J and K satisfy the conditions A ∧ WJa
B ∧ WKb
≥ ρ a and ≥ ρb A B then nodes J and K are chosen to represent the input patterns A and B, and proceed to Step 5. After the categories represented by nodes J and K are selected for learning, they become committed. If they violate the above condition, then node J and K are reset, and move back to Step 3. Search for another node in the F2a and F2b that satisfies vigilance criterion respectively.
Step 5. Check to see whether the match tracking criterion is satisfied. If
y b ∧ W Jab yb
≥ ρ ab
then we have achieved the desired mapping and continue to Step 6 for LTM (Long Term Memory) learning. If y b ∧ W Jab 〈 ρ ab yb then the mapping between J and K is not the desired one. In this case, the vigilance parameter ρa is increased until it is slightly larger than A ∧ W Ja A ; this leads to an immediate reset of node J in ARTa and a move to Step 3 with the new vigilance parameter for the selection of another node in F2a that will achieve the desired mapping. Step 6. The weights W Ja and WKb are updated by the equations W J (t ) = β (A ∧ W J (t − 1)) + (1 − β )W J (t − 1) and WK (t ) = β ( A ∧ WK (t − 1)) + (1 − β ) WK (t − 1) , where the learning rate β is chosen in the range [0,1]. In the fast learning mode, β is set to 1. The weights W ja , j ≠ J and Wkb , k ≠ K of non-winning nodes are not updated. For efficient
2632
Journal of the Eastern Asia Society for Transportation Studies, Vol. 6, pp. 2629 - 2638, 2005
coding of noisy input sets, fast-commit and slow recording , which is to set β = 1 when J is an uncommitted node and take β < 1 after the category committed, is normally being used. Map field weights with fast learning are determined by ⎧1 if j = J , k = K ⎪ W (t ) = ⎨0 if j = J , k ≠ K ⎪W ab (t − 1) otherwise ⎩ jk ab jk
Step 7. Go to Step 1 and present a next pattern pair.
ab
Wjk
map field Fab x ab
ARTa
ARTb
a
ρab
ya
F2
reset
a Wj a F1
a
F0
ρa
xa
c
match tracking
reset b Wk
b
F1
b
A = ( a, a )
yb
b
F2
F0
ρb
xb
c
B = ( b, b )
b
a
Figure 1. Fuzzy ARTMAP Architecture
3. EXPERIMENT AND RESULTS 3.1. Experimental Data Traffic flow parameters associated with an incident can be quantitatively expressed by values of traffic flow characteristics such as traffic volume, speed and occupancy. In automatic incident detection algorithms, these variables have been used as useful information and abrupt changes have activated the incident warning system. Even though incident and incident-free traffic data are currently available from the loop detectors installed on freeways, data are not reliable because of the malfunction of detectors and network disconnection. More importantly, it is very difficult to get exact incident data regarding incident time and location in the real world. In this research, simulation data, which was obtained by using traffic simulator, INTEGRATION, to obtain incident and incident-free
2633
Journal of the Eastern Asia Society for Transportation Studies, Vol. 6, pp. 2629 - 2638, 2005
traffic flow data. The INTEGRATION traffic simulator provides three major traffic parameters, volume, speed and occupancy. However, the recorded occupancy in this simulator is computed as a function of a derived density(volume/speed) and the detection length. For this reason, only volume and speed can be useful for experiments, even though occupancy is an important measurement for an automatic incident detection system. Figure 2 shows the location of detectors and an incident occurrence on the two lanes of the freeway. Detector stations 1 through 3 are located on the eastbound freeway and positioned 2.5 km, 3 km and 3.5 km from the upstream end of the link. It is assumed that the incident blocks the median lane starting at a location 3.2 km from the upstream end of the link. In order to represent various traffic flow situations from the free flow to the congested flow in the experiments, the O-D demand for traffic generation ranges from 1000pc/h/ln to 2500pc/h/ln. The input data for the application of Neural Network models are average speed and volume measurements recorded at each station during every 30 seconds of polling cycle. The traffic volume and speed from the median lane detector in Station 2 are zero when the incident blocked the median lane. This means that a simple detection system could detect an incident in very easily with the extreme value of traffic parameters. For the study, an average speed and volume for each station has been used to develop more a reliable detection system, which may distinguish incident traffic flow from recurrent traffic congestion.
INCIDENT
Figure 2. Loop Detector Locations and Incident Occurrence
Table 1 represents the number of incident and incident-free data which have been used for training and testing. In this study, four different experiments have been done to see the network performance in terms of the incident detection according to the number of incident and incident-free data sets for training. For the application of Backpropagation, the training sets size of 120 on the Exp. 4 is much smaller than the suggested by Baum and Haussler (1989) and Widrow’s rule of thumb (Widrow, 1987). The experimental results show that this rule is not always acceptable (Kim, 1999b).
2634
Journal of the Eastern Asia Society for Transportation Studies, Vol. 6, pp. 2629 - 2638, 2005
Table 1. The Number of Data Sets For Training and Testing
Incident Incident-Free Total
Training data Exp. 1 Exp. 2 Exp. 3 Exp. 4 250 125 60 60 120 120 120 60 370 245 180 120
Test data 400 180 580
3.2. Experiment and Results In this study, all experiments with the standard Backpropagation network were implemented on the three-layer network with 25 hidden neurons, 6-25-1. The input vector property is the average 30-seconds volume and the speed between two detectors at each detector station. The network has been learned with a learning rate of 0.01 and a sequential learning mode, since the sequential learning mode is much more efficient than the batch mode learning (Kim, 1999b). The error goal of a RMSE(Root Mean Squared Error) for stopping network training was approximately 0.1 . In comparison, the Fuzzy ARTMAP parameters used for the simulation are shown on the Table 2. The ARTa baseline vigilance is set to 0, and the ARTb baseline vigilance is set to 1, i.e. ρa = 0 and ρb =1. The input for the ARTb module is the pattern category, which we need to learn and predict correctly, corresponding to the output vectors of the supervised neural network model, as in the Backpropagation network. In order to achieve the maximum generalization for the training patterns, the baseline vigilance of ARTa is set to 0. If the ARTa baseline vigilance is set to the high value initially, the generalization will be very low since those patterns which are only slightly different will have their own winning vector on the F2a . For the learning algorithm, fast-commit and slow recording is used with a learning rate parameter β = 0.001 for all experiments in this research. For the experiment in this research, 5 votes have been used. In terms of computing cost for training, Fuzzy ARTMAP is superior to the standard Backpropagation. Table 3 shows the performance in terms of prediction accuracy of two different neural network models on the incident and incident-free test data sets. The prediction accuracy of Fuzzy ARTMAP on the test data sets ranges from 89.1% to 91.6% according to the number of training data set. For Backpropagation, it ranges from 83.4% to 93.6%. For the Exp. 1 and 2 which have been trained with a large number of incident-free and incident data sets, Backpropagation produced a little better performance in terms of detection rate than the Fuzzy ARTMAP. However, for the small number of incident and incident-free data sets as on Exp. 4, Fuzzy ARTMAP yields much better performance than Backpropagation. Even though some previous research showed the better performance of Fuzzy ARTMAP compare to Backpropagation, this paper shows that the network performance can be vary
2635
Journal of the Eastern Asia Society for Transportation Studies, Vol. 6, pp. 2629 - 2638, 2005
according to the number of training set size. The experimental results show that the Fuzzy ARTMAP algorithm may produce better performance than Backpropagation in terms of detection rate and false alarm rate, especially with small numbers of incident data sets available. Otherwise, Backpropagation would be more efficient than the Fuzzy ARTMAP. In addition, Fuzzy ARTMAP may be much efficient when training data sets are significantly different since it has the ability of a network to learn patterns without forgetting the old ones, i.e. Fuzzy ARTMAP can recognize any significantly different new pattern as well as the previously trained ones. There is, however, a need to retrain the network with the new pattern plus all of the previous patterns in order to recognize new patterns for Backpropagation. This process may effect the previously trained ones seriously if it is significantly different from old ones.
Table 2. Fuzzy ARTMAP Parameters Used for the Simulation Parameter ε = 0.001 α = 0.001 βa = 0.001 βb = 1.0 βab = 1.0 ρa =
0.0 ρb = 1.0 ρab = 1.0
Description Match tracking parameter ( increase ARTa vigilance ) Choice parameter for the search order of fuzzy ART modules Fuzzy ARTa learning rate Fuzzy ARTb learning rate Map field learning rate Baseline Fuzzy ARTa vigilance Baseline Fuzzy ARTb vigilance Map Field vigilance
Table 3. Performance on the two neural network models Performance Errors on Incident-free data Errors on Incident data Total error (%)
Exp. 11) BP F.A 12/180 16/180
Exp. 22) BP F.A 25/180 22/180
Exp. 33) BP F.A 26/180 33/180
Exp. 44) BP F.A 26/180 25/180
25/400 45/400 24/400 28/400 66/400 20/400 70/400 37/580 61/580 49/580 50/580 92/580 53/580 96/580 (6.4%) (10.5%) (8.4%) (8.6%) (15.9%) (9.1%) (16.6%) Detection Rate(%) 93.8 88.8 94.0 93.0 83.5 95.0 82.5 False Alarm Rate(%) 6.7 8.9 13.9 12.2 14.4 18.3 14.4 1) Experiment has been done with 250 for incident-free and 120 for incident training data sets 2) Experiment has been done with 125 for incident-free and 120 for incident training data sets 3) Experiment has been done with 60 for incident-free and 120 for incident training data sets 4) Experiment has been done with 60 for incident-free and 60 for incident training data sets
36/400 63/580 (10.9%) 91.0 13.9
2636
Journal of the Eastern Asia Society for Transportation Studies, Vol. 6, pp. 2629 - 2638, 2005
Error (%) Fuzzy ARTMAP
18 16 14 12 10 8 6 4 2 0
Backpropagation
120
180
245
370
Training Sets
Figure 3. Performance with Different Training Set Size
4. CONCLUSIONS In this research, a fuzzy-based neural network model, Fuzzy ARTMAP, has been explored for incident detection. The performance of Fuzzy ARTMAP was found to be competitive with the Backpropagation which has been the most popular neural network for the incident detection in terms of the detection rate and the false alarm rate. In the real world, it is difficult to obtain a large number of incident and non-incident data sets for training and so the Fuzzy ARTMAP could be more reliable especially when the small numbers of training data sets are available. In addition, the Fuzzy ARTMAP has a built-in mechanism for the network to be able to recognize the novelty of the input, if a previously unseen input pattern is introduced. As a result, if there is significantly different types of incident and incident-free traffic parameter data are given, then the Fuzzy ARTMAP would be much more efficient than any other neural network models. However, if a large number of training sets for incident and incident-free data are available and the noise on the real world data is not serious, Backpropagation could be much more efficient because of its powerful generalization.
REFERENCES Ahmed, S. A. and Cook, A. R. (1982) Application of time series analysis techniques to freeway incident detection, Proceedings 61st Annual Meeting of TRB, Washington. D. C. Busch, F. and Fellendorf, M. (1990) Automatic Incident Detection on Motorways, Traffic Engineering and Control, Vol. 31, No. 4, 221-227.
2637
Journal of the Eastern Asia Society for Transportation Studies, Vol. 6, pp. 2629 - 2638, 2005
Baum, E. B. and Haussler, D. (1989) What size net gives valid generalisation?. Neural Computation, Vol. 1, 151-160. Carpenter, G. A., Grossberg, S. (1987a) A massively parallel architecture for a selforganizing neural pattern recognition machine, Computer Vision, Graphics, and Image Processing, Vol. 37, 54 – 115. Carpenter, G. A. and Grossberg, S. (1987b) ART 2: Stable self-organization of pattern recognition codes for analog input patterns, Applied Optics, Vol. 26, 4919-4930. Carpenter, G. A., Grossberg, S. and Rosen, D. B. (1991a) Fuzzy ART: Fast stable learning and categorization of analog patterns by an adaptive resonance system, Neural Networks, Vol. 4, 759-771. Carpenter, G. A., Grossberg, S., and Reynolds, J. H. (1991b) ARTMAP: Supervised real time learning and classification by a self-organizing neural network, Neural Networks, Vol. 4, 565-588. Carpenter, G. A., Grossberg, S., Markuzon, N., Reynolds, J. H., and Rosen, D. B. (1992) Fuzzy ARTMAP: A neural network architecture for incremental supervised learning of analog multidimensional maps, IEEE Transactions on Neural Networks, Vol. 3, No. 5, 698-712. Chassiakos, A. P. and Stephanedes, Y. J. (1993) Smoothing Algorithms for Incident Detection, Transportation Research Record 1394, 8-16. Dudek, C.L., Messer, C.J. and Nuckles, N.B. (1974) Incident Detection on Urban Freeways. Transportation Research Record 495, 12-24. Hall, F. L., Shi, Y., and Atala, G. (1993) On-Line Testing of the McMaster Incident Detection Algorithm Under Recurrent Congestion, Transportation Research Record 1394, 1-7. Ishak, S. S. and Al-Deek, H. M. (1999) Performance evaluation of ANN-based freeway incident detection algorithms, 78th TRB Annual Meeting, Washington D.C. Kim, D. (1999a) Normalization Methods for Input and Output Vectors in Backpropagation Neural Networks, International Journal of Computer Mathematics, Vol. 71, No. 2, 161171. Kim, D. (1999b) Problems Encountered During Implementation of the Backpropagation, ITS Journal 5(1), 71-86. Payne, H. J. and Thompson, S. M., (1997) Development and Testing of Operational Incident Detection Algorithms: Technical Report R-009-97, US Department of Transportation, Washington, DC. Payne, H. J. and Tignor, S. C. (1978) Freeway Incident-Detection Algorithms based on Decision Tree with States, Transportation Research Record 682, 30-37. Ritchie, S. G. and Cheu, R. L. (1993) Simulation of Freeway Incident Detection using Artificial Neural Networks, Transportation Research –C 1(3), 203-217. Rumelhart, D.E., McClelland, J. L. and the PDP Research Group, (1986) Parallel Distributed Processing: Explorations in the Microstructure of Cognition, Volume 1: Foundations, MIT Press, Cambridge, Massachusetts. Widrow, B. (1987) ADALINE and MADALINE – 1963, Proceedings 1st IEEE International Conference on Neural Networks, Vol. 1, pp. 143-157. Young, C. D. P. (1995) A Fuzzy ARTMAP neural network speech recognition system based on formant ratios. Master’s thesis, Royal Military College of Canada, Kingston, Ontario, Canada.
2638