Incremental Clustering for Semi-Supervised Anomaly Detection applied on Log Data Markus Wurzenberger, Florian Skopik, Max Landauer, Philipp Greitbauer, Roman Fiedler
Wolfgang Kastner Vienna University of Technology, Austria
[email protected]
Austrian Institute of Technology, Austria
[email protected]
ABSTRACT
1
Anomaly detection based on white-listing and self-learning has proven to be a promising approach to detect customized and advanced cyber attacks. Anomaly detection aims at detecting significant deviations from normal system and network behavior. A well-known method to classify anomalous and normal system behavior is clustering of log lines. However, this approach has been applied for forensic purposes only, where log data dumps are investigated retrospectively. In order to make this concept applicable for on-line anomaly detection, i.e., at the time the log lines are produced, some major extensions to existing approaches are required. Especially distance based clustering approaches usually fail building the required large distance matrices and rely on timeconsuming recalculations of the cluster-map on every arriving log line. An incremental clustering approach seems suitable to solve this issues. Thus, we introduce a semi-supervised concept for incremental clustering of log data that builds the basis for a novel on-line anomaly detection solution based on log data streams. Its operation is independent from the syntax and semantics of the processed log lines, which makes it generally applicable. We demonstrate that that the introduced anomaly detection approach allows to achieve both a high recall and a high precision while maintaining linear complexity.
ACM Reference format: Markus Wurzenberger, Florian Skopik, Max Landauer, Philipp Greitbauer, Roman Fiedler and Wolfgang Kastner. 2017. Incremental Clustering for Semi-Supervised Anomaly Detection applied on Log Data. In Proceedings of ARES ’17, Reggio Calabria, Italy, August 29-September 01, 2017, 6 pages. DOI: 10.1145/3098954.3098973
In recent years the Internet and its network traffic have been growing exponentially. This trend is likely to continue in the future, since the interconnectivity and digitalization in economy and private life is continuously increasing. All activities that take place in a network and on connected devices are potentially protocoled in log files. Hence, these log files provide a detailed overview of what events occur in a network environment. Therefore, verbose log data is a valuable information source for security analysis that is represented in human-readable text format. Thus, the provided information can be easily and fast accessed, without any time-, computational- and resource-intensive preprocessing, which is required to extract high level information from network packets. This allows processing log lines on-line, i.e. at the time they are produced. In this paper, we introduce an anomaly-based detection approach that is designed to identify anomalous events on-line. Note, an anomaly can be related to an attack, mis-configuration or any other misuse of the system that violates the normal system behavior. Hence, we demand high performance (large throughput of log lines per second), and high scalability, so that the approach becomes applicable to large-scale ICT networks. We propose a semi-supervised clustering approach to detect anomalous system behavior. Clustering has been proven to be a feasible method to define a behavior model of an ICT system based on log data. This model characterizes the normal system behavior, and new occurring log lines can be compared against this baseline to detect anomalies. Log data exposes two major properties, which make clustering challenging: (i) the amount of log data is rapidly growing – modern ICT networks produce millions of log lines every day – and (ii) log data is rather dynamic – ICT network infrastructures and user behavior change quickly. Hence, clustering approaches that are applied for on-line anomaly detection have to fulfill some essential requirements: (i) process data timely, i.e. in real-time, (ii) adopt the cluster-map promptly and (iii) deal with large amounts of data. Nevertheless, existing approaches, that usually process all clustered data at once, suffer from three major drawbacks, which make them unsuitable for on-line anomaly detection in log data:
Permission to make digital or hard copies of all or part of this work for personal or classroom use is granted without fee provided that copies are not made or distributed for profit or commercial advantage and that copies bear this notice and the full citation on the first page. Copyrights for components of this work owned by others than ACM must be honored. Abstracting with credit is permitted. To copy otherwise, or republish, to post on servers or to redistribute to lists, requires prior specific permission and/or a fee. Request permissions from
[email protected]. ARES ’17, Reggio Calabria, Italy © 2017 ACM. 978-1-4503-5257-4/17/08. . . $15.00 DOI: 10.1145/3098954.3098973
• Static cluster-maps: Adapting/updating a cluster-map is time consuming and computational intensive. If new data points occur that account for new clusters, the whole cluster-map has to be recalculated. • Memory intensive: Distance-based clustering approaches are limited to the available memory, because large distance matrices have to be stored – depending on the applied 2 distance metric, n 2 or n2 elements are stored.
CCS CONCEPTS • Security and privacy → Intrusion detection systems; Systems security; Network security; • Information systems → Data mining; • Computer systems organization → Embedded systems; Redundancy; Robotics; • Networks → Network reliability;
KEYWORDS log line clustering; anomaly detection; intrusion detection
1
INTRODUCTION
ARES ’17, August 29-September 01, 2017, Reggio Calabria, Italy
M. Wurzenberger et al.
• Computational intensive: Log data is stored as text data. Therefore, string metrics are applied to calculate the distance (similarity) between the log lines. Their calculation is usually computationally intensive.
summarized in Sect. 1 and therefore it is primarily used for forensic analysis to investigate data retrospectively. Some algorithms that have been used for clustering log data are SLCT, CLIQUE, MAFIA, CACTUS, and PROCLUS [11].
To solve this issues, we introduce an incremental clustering approach that processes log data on-line in streams to enable online anomaly detection in ICT networks. We propose a concept with the following novel features:
3
The following section describes the proposed concept of incremental clustering for anomaly detection in ICT networks. In this paper, we define two models to realize this concept. Figure 1 visualizes those two models and their differences. Model I (M I ) deals with string metrics that are applied to compare two log lines. Filters reduce the computational complexity and speed up the clustering. Model II (M I I ) follows a numerical distance based approach. First the textual log data is transformed into the Euclidean space; Principal Component Analysis (PCA) [9] is applied to reduce the amount of insignificant information; finally, the Euclidean distance1 – a numerical distance metric – between two transformed log lines is calculated to compare them with each other. In both models, the last step decides whether a processed log line is anomalous or not. Both models are described in detail in the following. The section is structured as follows: First the concept of incremental clustering is explained in details. Then model M I and different string metrics are defined. Afterwards model M I I is described.
• The processing time of incremental clustering grows linearly with the rate of input log lines, without rearrangement of the cluster-map. The distances between all log lines do not need to be stored. • Fast filters reduce the number of distances that have to be calculated. A semi-supervised approach based on selflearning reduces the effort for a system administrator. • The modularity of our approach allows the application of different existing metrics to build the cluster-map and carry out the anomaly detection. We compare the most promising string distance metrics, against each other and a method based on principal component analysis (PCA), adopting a numeric distance metric. • Our approach enables detection of point anomalies – single anomalous log lines – by outlier detection. Collective anomalies – anomalous number of occurrences of normal log lines, that represent a change in the system behavior – could be detected through time series analysis.
3.1
Incremental clustering
Incremental clustering focuses on high performance in order to support on-line clustering of fast growing data, such as log data. One advantage is to prevent recalculation of the whole cluster-map every time a new data point – log line – occurs. In opposite to classic clustering approaches, data is processed in streams and not at once. In the proposed incremental clustering approach, every cluster C is defined by a cluster representative c. The cluster representative is the log line l that triggered the creation of the cluster. We define C as the set of all cluster representatives. In our approach the log data is processed line by line. First, line l is sanitized. This means that, among others, indentations are homogenized because they are represented differently in different systems. For example tabs are represented by different numbers of spaces. Hence, multiple spaces are removed. Furthermore the time stamp is removed or blacked out, because it is unique for each log line and is not relevant for the clustering. A more realistic time stamp treatment would consider the day and the hour, since the system behavior changes between days and daytimes, e.g. nobody might be working in the night or on weekends. A set of cluster candidates Cl ⊆ C is built; the processed log line l is compared to all existing cluster representatives c i ∈ C. If the distance d between l and c i is smaller than a predefined threshold t, i.e. d (l, c i ) ≤ t, c i is added to Cl . After Cl is built, l is added to the closest cluster, i.e. the cluster with the representative c i ∈ Cl , with the smallest distance d (l, c i ). In case multiple clusters share the same distance, the one first found is used. If Cl = ∅ a new cluster is added to C holding the cluster representative c = l.
The paper is structured as follows: Section 2 summarizes background related work. Section 3 provides a detailed explanation of our approach for incremental clustering for detecting anomalies in log data, and defines the applied models. The approach is evaluated in Sect. 4 and finally, Sect. 5 concludes the paper.
2
MODEL DESIGN
BACKGROUND AND RELATED WORK
Using information and communications technology (ICT) networks – among all advantages it offers – also poses a threat for both individuals and companies that cross-connect their devices. In order to reduce the risk of incidents, for example, if someone unnoticed gaining access, intrusion detection systems (IDS) have been developed and enhanced over years. There are three main techniques that IDS use to detect incidents: (i) Signature-based detection, which compares the current unit of activity with known malicious signatures, (ii) anomaly-based detection that uses especially statistical methods to identify anomalous behavior that differs from normal system behavior, and (iii) stateful protocol analysis, which relies on vendor-developed universal rules for protocols [8]. In this paper we present anomaly detection [3] based intrusion detection approach. According to [5], there are three different ways to perform anomaly detection: (i) unsupervised – this technique does not require any labeled data and is able to learn by analyzing the data it processes and, based on the findings, classify any other given data, (ii) semi-supervised – this method implies that the training set only contains data without anomalies, and (iii) supervised – this technique requires a labeled training set containing both normal and malicious data. Clustering [1] is a well established method for classifying data. The major drawbacks of common clustering approaches have been
1 d (x,
2
y) =
qP
n i =1 (x i
− yi ) 2
Incremental Clustering for Semi-Supervised Anomaly Detection
1
Model MI
Model MII
2
Sanitize log line
Check for identical cluster representatives
1
2 Transform log line into Euclidean space
Sanitize log line
ARES ’17, August 29-September 01, 2017, Reggio Calabria, Italy
3
4
Apply length filter
5
6a
Apply short word filter
Calculate string metrics
3
4
5
Training: Use PCA to calculate transformation matrix
Transform log line into lower dimensional subspace
6b
Training: dt create new cluster
6a
6b
Training: dt create new cluster
Calculate numeric distances
Detection: dt anomaly detected
Detection: dt anomaly detected
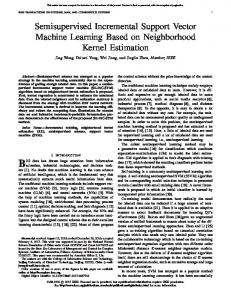
Figure 1: Work-flow of model M I and model M I I . Steps only needed in the training phase are framed with a dashed line. Given that we apply this concept of incremental clustering to perform semi-supervised anomaly detection, thus the process comprises a training and a detection phase. During the self-learning training phase the cluster-map C is built as described before. C describes a baseline of normal system behavior, the so-called groundtruth, against which, log lines are tested for detecting anomalies. During the detection phase every processed log line l, for which Cl = ∅ holds, after l was compared to all c ∈ C, is considered anomalous. Since in the detection process log lines are tested against a predefined baseline of normal system behavior the proposed method represents a white-listing approach. We assume that the log data processed during the training phase is free of anomalies. Hence, the proposed approach can be categorized as semi-supervised. However this is not realistic: The training phase run on real data could already contain anomalies. To reduce the negative effects of possibly anomalous log lines, clusters that only contain a single line or an amount of lines that does not exceed a certain threshold after the training phase, are considered anomalous and are removed from the detection phase. This reduces the risk that during the training phase anomalous behavior is learned as normal. Since the normal system behavior is defined after the training, the maximum number of comparisons during the detection phase is constant.
For each remaining cluster representative c i ∈ Cl the distance d (l, c i ) is calculated using a string metric (step 5). Some of the existing string metrics suitable for this task are listed in the following section. If for a cluster representative c i the distance d (l, c i ) exceeds the predefined threshold t, the cluster is removed from Cl . Finally (step 6a/6b), the considered log line l is added to the cluster Ci with the smallest distance d (l, c i ). In case Cl = ∅ at the end of the process: (i) during the training phase a new cluster is created with representative l (step 6a), (ii) during the detection phase, an alarm is raised since l represents an anomaly (step 6b).
3.2
3.3
pos: 01 02 lineA: # 1 | | lineB: # 1 2-mer 1 3-mer 4-mer 5-mer
03 2 X 4
04 3 | 3 2 1 1 1
05 06 q | | q 3 4 2 3 2 3 2 3
07 u | u 5 4 4
08 e | e 6 5
09 r | r 7
10 y | y
Listing 1: Example for the short word filter: Two lines are compared that differ in position 03 which is highlighted with ‘X’. The matching k-mer for k = 1, 2, 3, 4, 5 are marked with numbers. For example, to reach a similarity of 90% at least 7 2-mer must match (cf. Eq. (1)) . M = L − k + 1 − (1 − p)kL
Description of model M I
(1)
String metrics
In order to compute the distance d (la , lb ) or similarity s (la , lb ) between two log lines la and lb with their respective lengths |la | and |lb |, we applied the metrics defined in the following sections and compared the results regarding detection capability, scalability and computation time described in Sect. 4. The normalized distance d˜(la , lb ) lies in the interval [0, 1] and can be expressed through a normalized similarity s˜ (la , lb ) by calculating d˜(la , lb ) = 1 − s˜ (la , lb ). In the proposed approach, we applied s˜ (la , lb ) to calculate the distances d (l, c i ), because the normalized values are more suitable for comparison, which makes it easier to predefine a similarity threshold t. For our experiments we considered the following metrics and compared them [6]: (1) Levenshtein (edit-distance), (2) Jaro, (3) Sorensen-Dice, (4) Needleman-Wunsch, (5) Longest Common Subsequence (LCS).
Model M I (cf. Fig. 1) implements the concept of incremental clustering introduced in Sect. 3.1 based on string metrics. The processed log line l is first sanitized (step 1), then the set of cluster candidates Cl ⊆ C is generated. First, we check if the processed log line already exists in C (step 2). If so, the line is assigned to the corresponding cluster. Otherwise a length filter (step 3) is applied. Clusters C are kept in Cl only if the length of their cluster representative, |c |, lies within a predefined range of |l |, for example ±10%. The resulting set of cluster candidates Cl is then filtered applying a short word filter (step 4) that compares the amount of matching kmer (substrings of length k) between l and cluster representatives c i ∈ Cl and removes cluster candidates that have less than the required number of matches [4]. This method is often used to cluster biological sequences. Equation (1) calculates the number of required matching k-mer M to reach a specific amount of similarity between two lines. L is the length of the shorter line, k the length of the k-mer and p the similarity threshold in percent. Listing 1 shows the short word filter.
3.4
Description of model M I I
Model M I I (cf. Fig. 1) implements the concept of incremental clustering introduced in Sect. 3.1 based on numerical distance metrics. 3
ARES ’17, August 29-September 01, 2017, Reggio Calabria, Italy
M. Wurzenberger et al. 00:00 - 04:00 Training phase
Here, the log data is stored as text data and has to be transformed into the Euclidean space (step 2). There are different reasonable methods to achieve this transformation. For the sake of simplicity, we count the number of unique characters in each log line l and define k as the number of unique characters, which is equal to the dimension of the considered Euclidean space. We observed that log files mostly contain between 80 and 100 unique characters, because they are usually written in English and only contain specific special characters. Also the use of ASCII characters, which is based on the English alphabet and consists of 95 printable symbols, is widespread. The correct number of unique characters k has to be previously known and can be derived during the training phase. Furthermore, during the detection phase it must be ensured that unknown characters are left out. Lines where previously unknown characters occur should be considered anomalous. A common problem that arises when clustering high dimensional data based on distance measures is called the curse of dimensionality [2]. When increasing the dimension, the difference between the largest and the smallest distance, between points of the considered data, converges towards zero. As a result, output of distance based algorithms becomes unusable. In order to overcome this problem we decided to apply principal component analysis (PCA; step 3). A detailed description of this method can be found in [9] and in other related work. PCA allows to reduce the number of dimensions while as much information as possible is kept. The method uses an orthogonal transformation and projects the sample set from a k-dimensional space into a mdimensional subspace (with m ≤ k). The dimension m is equal to the number of considered principal components (PC). The PC are sorted by their variance starting with the largest and thus each added PC contributes less information than the one before. The used transformation is defined in Eq (2), where X ∈ Rn×k is a data set of n elements with k attributes, Γ ∈ Rk ×m is the matrix that stores the first m eigenvectors of the covariance matrix of X , which is required for the transformation that projects X on the first m PC and Y ∈ Rn×m which holds the projection of X onto the basis Γ. Y = XΓ (2) The transformation matrix Γ is calculated during the training phase and then reused to transform new occurring log lines during the detection phase. Therefore, the detection phase is less computational intensive than the training phase. During the training phase n log lines are used to calculate Γ. Determining the best choice for the number of PC m is not trivial and depends on the data as well as the dimension k. Our empirical studies showed that 6 is an appropriate amount of PC for our anomaly detection approach. A number m lower than 4 resulted in a low number of true positives and therefore in a large number of false negatives. Before a log line l is clustered it is transformed into a numerical data point l x ∈ Rk in the k-dimensional Euclidean space applying the previously described method (step 2). Then l x is transformed into ly ∈ Rm (cf. Eq. (3)) in the m-dimensional subspace (step 4) by applying Eq. (2). ly = l x Γ (3)
04:00 - 06:00 Detection phase
05:00 06:00 04:30 04:00 SQL-DumpSQL-Inj. 05:30 Refl. XXS Brute Force
00:00
Figure 2: Time-line describing the test data generation. The red crosses mark the four attacks. c used in model M I I are defined as the transformation ly (cf. Eq. (3)) of the log line l from which cluster C was obtained. qP As distance m (a − b ) 2 . metric (step 5) we use the Euclidean distance d 2 = i i=1 i Again, to achieve modularity, also other numerical metrics can be used.
4
EVALUATION
This section describes the conducted evaluation of the proposed incremental log line clustering approach for anomaly detection in log data. We assess the detection capability of our models defined in Sect. 3 with different parameters. Additionally, an overview of the runtime performance is given. The section is structured as follows: First the evaluation environment and its configuration is specified, then the test data used for the evaluation as well as the different attack scenarios are outlined, finally the evaluation measures are described and the observed results are discussed.
4.1
Evaluation environment
The test environment was deployed on a general purpose workstation with an Intel Xeon CPU E5-1620 v2 at 3.70GHz 8 cores and 16 GB memory, running Ubuntu 16.04 LTS operating system and Oracle Java 8u102. The workstation runs virtual servers for an Apache Web server hosting the MANTIS Bug Tracker System2 , a MySQL database and a reverse proxy. The log messages of these systems are aggregated using syslog.
4.2
Testdata
To evaluate the presented approach, we used log data from a real system. We generated the log data in a staged process with designed scenarios. This allowed us to control the actual content and extract the log lines caused by attacks. To create realistic attacks, we exploited known vulnerabilities of the MANTIS Bug Tracker System, listed in CVE database3 . For generating the data, we applied a slightly modified version of the approach presented in [10]. With this method it is possible to generate log files of any size/time interval for a given system by running virtual users in virtual machines. In our case, we created four user machines that exhibit a typical behavior on a bug tracker system, for example, logging in and out, submitting and editing bug reports. We generated log data over a time window of six hours. After four hours, one of the users changes his behavior and performs four attacks, each in a 30 minute interval (see Fig. 2). We used the first four (anomaly free) hours of the obtained log data as training data, and the remaining two hours to evaluate the detection process.
After the transformation matrix Γ is calculated (step 3), the incremental clustering (step 6a) and the anomaly detection (step 6b) are carried out as described in Sect. 3.1. The cluster representatives
2 https://www.mantisbt.org/ 3 CVE
4
list search: https://cve.mitre.org/cve/cve.html
Incremental Clustering for Semi-Supervised Anomaly Detection
4.3
ARES ’17, August 29-September 01, 2017, Reggio Calabria, Italy
Attack scenarios
thresholds, where the F 1 -score is above 0.99. This can be explained by the anomalous length of the script lines, which are already sorted out by the line length filter, and the high amount of special characters. For the Jaro distance [7], for example, we obtained F 1 scores between 0.75 and 1 for threshold t ∈ [0.2, 0.5], which means that more small clusters have to be build to detect the XSS attack. The Needleman-Wunsch metric, instead, reaches the same F 1 -score for thresholds t ∈ [0.5, 0.95], which means that a lower number of clusters is required to detect the anomalous log lines. In contrast to that, the SQL-Dump lines required a smaller threshold to be successfully detected. All metrics reach F 1 -scores between 0.8 and 0.96 for threshold t ∈ [0.12, 0.35]. The lines of the SQLInjection were also detected opportunely, however a large variability can be observed, with some F 1 -scores falling below 0.1 for certain thresholds. An expected effect was that the F 1 -scores show peaks between 0.7 and 0.82 for thresholds t ∈ [0.2, 0.6] and decrease for thresholds t lower than 0.2 and higher than 0.6. This can be explained by the fact that a smaller threshold leads to an increase of false positives causing a small value for Precision, while a higher threshold leads to fewer true positives identified causing a small value for Recall. Only in the region where both of these scores reach a high value, the F 1 -score maximizes. Finally, the brute force login attack shows the deficits of anomaly detection based on string metrics. Almost all F 1 -scores of the string metrics yield zero, meaning that not a single true positive was found. Unlike the string metrics, the Euclidean metric is able to detect this kind of attack and showed at least for thresholds t ∈ [0.2, 0.35] an F 1 -score between 0.6 and 0.75. As no administrator logged in during the training phase, the brute force attack with administrator credentials leads to a point in the PCA-transformed space that lies just far enough away from the normal user logins to be identified by the Euclidean distance based anomaly detection. While the string metrics consider these lines normal as most of the line is identical except from the username, the number of different characters in the name is weighted higher by the PCA causing this effect. 4.4.2 ROC-curve. A common method for evaluating the performance of a classification system is the Receiver Operating Characteristic (ROC) displayed as a curve of the true positive rate P T PR = T PT+F N (identical to Recall) against the false positive rate F P . Further, the first median is added as a base line F PR = F P +T N that distinguishes a good anomaly detection from a bad one. The closer the points are to the top left corner of the plot, the more accurate the detection results are. Points under the first median mean that randomly guessing provides better detection than the tested algorithm. The ROC-curves obtained in our experiment are shown in Fig. 3, they display the results for each metric and the different attacks. Figures 3(a) and 3(b) show the values for the SQL-Dump and the SQL-Injection. All the points are located in the origin or above the first median and most of them are located far in the top-left corner (notice that the scale of the x-axis was set to a value that facilitates the visualization). The results show that the evaluated approach is able to detect the simulated attacks with a high probability. The ROC-curve of the brute force attack in Fig. 3(c) displays that the detection of these anomalies with the string metrics has a low accuracy as many of the points are located below the first median. The Euclidean metric proves to be a good choice in this scenario.
In order to evaluate our anomaly detection approach in a realistic context, we searched for known security vulnerabilities of software used in our test environment. In case of the MANTIS Bug Tracker System version 1.2.18, we found multiple CVE entries that hinted at bugs and exploits of the system. Out of them, we selected two vulnerabilities appropriate for our use casesne resembling an SQL-Injection (CVE-2014-9573) and another one that resembles a reflective XSS attack (CVE-2016-6837). The SQL-Injection is performed by adding a cookie whose value is not sanitized correctly before appending it to the query. This attack can be seen in the log file as an anomalous SQL-Query and is not trivial to identify. In the same time interval also an ssh connection and some crontab statements occured which we also considered anomalous as nothing similar was present in the training data. The reflective XSS attack inserts a rather large script into a URL the user visits and the corresponding log lines should thus be easy to detect. Furthermore, we added a scenario where an insider with direct access to the SQL server executes a SQL-Dump. This generates several hundreds of SQL-Query lines in the log data; some of them looking suspicious, and some of them looking rather normal. Only parts of these will be identified as anomalous. Moreover we simulated a brute force attack which consists of repeated attempts to log into the admin account with random passwords. We expect this to be difficult to identify as logging in with wrong credentials is part of the normal user behavior that is included in the training phase. We are aware of the fact that these anomalies could also be discovered by signature-based approaches, but: (i) the appropriate signatures are required and need to be frequently updated, (ii) they need to be set up correctly, and (iii) no zero-day detection is possible. Our proposal is more generally applicable, more flexible and not relying on predefined signatures.
4.4
Results
In the following the evaluation results are presented. The F 1 -score and the ROC are considered as indicators for accuracy. For the sake of brevity we discuss the results we obtained for the F 1 -score but only show the ROC plots. We also asses the scalability of the system. 4.4.1 F 1 -score. In order to compare the different metrics and their ability to identify anomalies in the aforementioned attack scenarios, we measure the amount of true positives (T P), false positives (F P), true negatives (T N ) and false negatives (F N ). We computed P TP the Precision = T PT+F P and the Recall = T P +F N . The so-called r ecision∗Recall F 1 − score = 2∗P P r ecision+Recall combines these two values and rates the accuracy of the evaluated anomaly detection approach. It takes a high value if both Precision and Recall are close to 1 and a low value if at least one of them is near 0. We calculated the F 1 -scores for each metric and each attack scenario varying the similarity threshold t in the unit intervall [0, 1]. A threshold set to t = 0 implies that every new line generates a new cluster and a threshold set to t = 1 indicates that all lines are assigned to one single cluster. Note that when using the PCA, which applies a numerical distance, the threshold t can be varied in the interval [0, ∞). The result show that the reflective XSS attack is easily detected by all metrics and for every string metric there is an interval of 5
ARES ’17, August 29-September 01, 2017, Reggio Calabria, Italy
(a) SQL-Dump
M. Wurzenberger et al.
(b) SQL-Injection
(c) Brute Force Login Attack
Figure 3: ROC curves of metrics in different attack scenarios. 4.4.3 Runtime and Scalability. The runtime of the classification is of high importance for most practical applications. The chosen threshold has a large influence on the detection performance and the runtime increases exponentially for an increasing similarity threshold. This can be easily explained considering that a higher threshold leads to a higher number of clusters and thus more computation time is needed to calculate the distances between all cluster candidates. The string metrics, especially the Needleman-Wunsch metric, require a higher computational effort. In contrast to that, with the Euclidean metric we are able to find the clusters very fast as each line only requires a single matrix multiplication for the computation of the point in the PCA-transformed space, and the runtime only depends on the amount of clusters that this point needs to be compared to. We further studied the scalability of our algorithm using different metrics. Our algorithm is able to process log lines at constant time rate, i.e., the run time increases linearly with the number of log lines, allowing on-line anomaly detection that can be used in practical application scenarios.
5
word occurrences instead of characters or splitting every log line into k-mer could be valid alternatives. We plan to extend our approach with a concept of time series analysis for anomaly detection to identify structural changes in the system behavior over time. This can be achieved by comparing clusters over time. Furthermore, we plan to implement an adaptive version of our algorithm, so that it is able to automatically adapt to changes in the network, such as new hardware and software.
ACKNOWLEDGMENTS This work was partly funded by the FFG project synERGY (855457) and carried out in course of a PhD thesis at the Vienna University of Technology funded by the FFG project BAESE (852301).
REFERENCES [1] Pavel Berkhin. 2006. A survey of clustering data mining techniques. In Grouping multidimensional data. Springer, 25–71. [2] Kevin Beyer, Jonathan Goldstein, Raghu Ramakrishnan, and Uri Shaft. 1999. When is “nearest neighbor” meaningful?. In International conference on database theory. Springer, 217–235. [3] Varun Chandola, Arindam Banerjee, and Vipin Kumar. 2009. Anomaly detection: A survey. ACM computing surveys (CSUR) 41, 3 (2009), 15. [4] Mohammadreza Ghodsi, Bo Liu, and Mihai Pop. 2011. DNACLUST: accurate and efficient clustering of phylogenetic marker genes. BMC bioinformatics 12, 1 (2011), 271. [5] Markus Goldstein and Seiichi Uchida. 2016. A comparative evaluation of unsupervised anomaly detection algorithms for multivariate data. PloS one 11, 4 (2016), e0152173. [6] Wael H Gomaa and Aly A Fahmy. 2013. A survey of text similarity approaches. International Journal of Computer Applications 68, 13 (2013). [7] Matthew A Jaro. 1989. Advances in record-linkage methodology as applied to matching the 1985 census of Tampa, Florida. J. Amer. Statist. Assoc. 84, 406 (1989), 414–420. [8] Karen A. Scarfone and Peter M. Mell. 2007. SP 800-94. Guide to Intrusion Detection and Prevention Systems (IDPS). Technical Report. Gaithersburg, MD, USA. [9] Jonathon Shlens. 2014. A tutorial on principal component analysis. arXiv preprint arXiv:1404.1100 (2014). [10] Florian Skopik, Giuseppe Settanni, Roman Fiedler, and Ivo Friedberg. 2014. Semisynthetic data set generation for security software evaluation. In Privacy, Security and Trust (PST), 2014 Twelfth Annual International Conference on. IEEE, 156–163. [11] Risto Vaarandi. 2003. A data clustering algorithm for mining patterns from event logs. In IP Operations & Management, 2003.(IPOM 2003). 3rd IEEE Workshop on. IEEE, 119–126.
CONCLUSION AND FUTURE WORK
We introduced an incremental clustering approach for anomaly detection applied on log data. Separating the computationally intensive training phase from the faster detection phase is an advantage for real-world applications. During the training phase, the clustermap is built, which represents the normal system behavior. In the detection phase each line is compared against the existing clusters and identified as an anomaly if it cannot be assigned to one of the existing clusters. We applied and compared different string metrics and an Euclidean PCA-based method. Different attack scenarios were simulated and assessed in the evaluation. The results showed that the tested metrics are able to reach both a high precision and recall. The runtime is linearly dependent on the number of processed log lines. Our decision to count the characters of each line to transform a string into the Euclidean space before applying PCA could be replaced by another suitable transformation. For example, counting 6