Incremental Anomaly Detection Approach for Characterizing Unusual Profiles Yi Fang1,*, Olufemi A. Omitaomu2, and Auroop R. Ganguly2 2
1 Department of Computer Science, Purdue University, West Lafayette, IN 47907 Oak Ridge National Laboratory, One Bethel Valley Road, Oak Ridge, TN 37831, USA
[email protected], {omitaomuoa,gangulyar}@ornl.gov
Abstract. The detection of unusual profiles or anomalous behavioral characteristics from sensor data is especially complicated in security applications where the threat indicators may or may not be known in advance. Predictive modeling of massive volumes of historical data can yield insights on usual or baseline profiles, which in turn can be utilized to isolate unusual profiles when new data are observed in real-time. Thus, an incremental anomaly detection approach is proposed. This is a two-stage approach in which the first stage processes the available historical data and develops statistics that are in turn used by the second stage in characterizing the new incoming data for realtime decisions. The first stage adopts a mixture model of probabilistic principal component analyzers to quantify each historical observation by probabilistic measures. The second stage is a chi-square based anomaly detection approach that utilizes the probabilistic measures obtained in the first stage to determine if the incoming data is an anomaly. The proposed anomaly detection approach performs satisfactorily on simulated and benchmark datasets. The approach is also illustrated in the context of detecting commercial trucks that may pose safety and security risk. It is able to consistently identified trucks with anomalous features in the scenarios investigated. Keywords: Transportation security, radioactive knowledge discovery, PPCA, chi-square statistics.
materials,
incremental
1 Introduction The effective detection of unusual profiles or anomalous behavioral characteristics from sensor data for real-time decisions is a problem in several security-related applications including truck weigh stations. At truck weigh stations, the ability to effectively detect commercial trucks that are transporting illicit radioactive materials using radiological and nuclear (RN) data is a challenge. The current inspection strategy uses radiation portal monitor (RPM) to analyze only one type of RN data called the gross count (radiation) data. When a truck is identified as possible security risk during the primary inspection process, the inspection officer requests that the truck be taken through a secondary inspection process and possibly a tertiary *
This author contributed to this work while he was a post-Master research associate at the Oak Ridge National Laboratory.
M.M. Gaber et al. (Eds.): Sensor-KDD 2008, LNCS 5840, pp. 190–202, 2010. © Springer-Verlag Berlin Heidelberg 2010
Incremental Anomaly Detection Approach
191
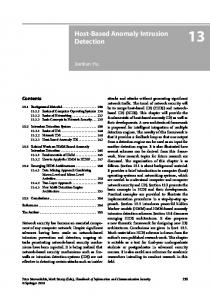
inspection process. The additional inspection processes include the collection of some supplementary data such as spectroscopy data for further analyses, cargo manifest, driver’s metadata, and possibly manual inspection. These additional processes cause truck delays and an increase in the operating costs of the weigh stations. The value of the secondary and tertiary inspection processes is then not clear under the current strategy since most of the initial alarms are false alarms. A flow chart representation of the inspection processes is depicted in Fig. 1a.
(a)
(b) Fig. 1. Truck inspection flowchart at weigh station test-beds
The initial false alarm has been attributed to several factors [1] – [8]: Firstly, there are several legitimate cargoes, such as kitty-litter and fertilizer in commerce and medical isotopes in hospitals that contain naturally occurring radioactive material (NORM) or technologically-enhanced naturally occurring radioactive material (TENORM) respectively. Cargoes that contain NORM and TENORM will trigger alarms, and constitute false alarms, even though they are generally not the target [1]. Secondly, RPM uses plastic scintillator material (PVT), which makes it applicable to only gross count data [2]. However, the gross count data by itself may be insufficient to determine whether or not a vehicle is a security risk. Thirdly, trucks transporting illicit radioactive materials are rare; therefore, no known cases or threat indicators of anomalous trucks are available. In other words, there is an inherent difficulty in precisely defining and quantifying what constitutes anomalies. Therefore, an incremental approach may be more appropriate; such that the availability of more examples of trucks transporting legitimate cargoes can enhance the anomaly detection process over time. Fourthly, there are several sources of variability in the data such as
192
Y. Fang, O.A. Omitaomu, and A.R. Ganguly
the speed of the truck, the distance of the truck from sensors, and the loading patterns of the truck. These factors may affect the performance of any anomaly detection approach especially in applications with zero training datasets. Our approach to enhance the detection process is to use multiple sensor data during the primary inspection process. The data includes static scale data, gross count, spectroscopy data, drivers’ information, and others depicted in the Fig. 1b. The strategy then is to detect anomalies from multiple sensor data, with the hope that all the data sources would capture the important features that could lead to a reliable detection. This approach could significantly reduce the number of false alarm during the primary inspection process and eliminate (or drastically reduce) unnecessary truck delays during the secondary and tertiary inspection processes as well as the costs associated with such delays. The approach, however, requires techniques for analyzing each sensor data and a methodology for quantifying their outcomes in terms of a single risk factor. In addition, the final decision must be available to aid the inspection officers within a few seconds because commerce cannot be interrupted unnecessarily or delayed indefinitely. These requirements motivate the incremental anomaly detection approach presented in this paper. The rest of this paper is organized as follows. The proposed approach and a review of the fundamental techniques behind it are presented in Section 2. We discuss an application of our approach to simulated and benchmark datasets in Section 3. In Section 4, we present an application of our approach to weigh station static scale data. A short summary concludes the paper.
2 Incremental Anomaly Detection Approach In this section, we review the concept of Latent variable models underlining techniques for our approach and describe our proposed approach. 2.1 Latent Variable Models A latent variable model is a statistical model that investigates the dependence of observed variables on a set of latent variables [9]. The most well-known latent variable model is factor analysis, which was initially developed by psychologists. Recently, it has been found that many popular multivariate statistical techniques are closely related to latent variable models. These include vector quantization, independent component analysis models (ICA), Kalman filter models and hidden Markov models (HMMs) [10]. The general latent variable model has the following form:
p ( x ) = ∫ p ( x | θ )h ( θ ) dθ, where
x = [ x1 ,K , xM ]
T
represents
the
observable
(1)
variables
and
θ = [θ1 ,K , θ P ] represents the latent variables. The number of latent variables, P, is T
usually much less than the number of observable variables, M. In essence all latent
Incremental Anomaly Detection Approach
193
variable models assume that x has a joint probability distribution conditional on θ, denoted by p ( x | θ ) . Based on some assumptions, we can infer the density functions
(p and h) from the known or assumed density of x in order to discover how the manifested variables depend on the latent variables. The key assumption of latent variable models is that of conditional independence; that is, the observable variables are independent of one another given the values of the latent variables. In other words, the observed interdependence among the observable variables totally comes from their common dependence on the latent variables; once the latent variables are fixed, the behavior of the observable variables is essentially random. Mathematically, this can be expressed as: M
p ( x ) = ∫ h ( θ ) ∏ p ( x i | θ ) dθ.
(2)
i =1
2.2 Probabilistic PCA Principal component analysis (PCA) is a widely used statistical technique in data analysis. Due to its attractiveness for linear dimension reduction problems, it has recently been expressed as a maximum likelihood solution for a generative latent variable model. This recent idea is called probabilistic PCA [11] and defined as follows: x = Wx t + μ x + ε x ,
(3)
where t ∈ ℜ P are the latent variables, Wx is an M × P matrix called the factor loadings, and ε x defines a noise process. In addition, parameters such as μ x allow for non-zero means for the data. In this model, latent variables t are conventionally assumed as a standard Gaussian distribution; that is, t ≈ N ( 0, I ) and ε x takes an isotropic Gaussian form as ε x ≈ N ( 0, σ 2x I ) . The maximum likelihood solution of Wx
is given as: Wx = U P ( E P − σ 2x I P ) R , 1 2
(4)
where U P is the matrix of the P principal eigenvectors of the sample covariance matrix S x =
1 N
N
∑ ( x − μ )( x − μ ) i =1
T
i
x
i
x
, E p ∈ ℜ P× P is the diagonal matrix of the
corresponding eigenvalues, I p ∈ ℜ P× P is the P-dimensional unit matrix, and R is an arbitrary P × P orthogonal matrix. It can be shown that PCA is a special case of PPCA as σ x2 → 0 . The probabilistic formulation of the PPCA provides additional advantages over PCA as discussed by Tipping [11]. These advantages include a principled method of handling missing values, the availability of a Bayesian framework, and a fast Expectation Maximization (EM) learning procedure.
194
Y. Fang, O.A. Omitaomu, and A.R. Ganguly
2.3 Mixture of PPCA for Feature Reduction Given the probabilistic formulation of PCA, it is quite straightforward to construct a mixture model with probabilistic principal component analyzers, whose parameters can be determined by the EM algorithm [12]. As Tipping has shown [13], the loglikelihood of the observed data for a mixture model is given as: N ⎡K ⎤ L = ∑ ln ⎢ ∑ λ j p ( x j | j )⎥ , i =1 ⎣ j =1 ⎦
(5)
where p ( x j | j ) is a single PPCA model, λ j is the corresponding mixing proportion with λ j ≥ 0, and
K
∑λ j =1
j
= 1 with K as the number of mixture clusters. Since there is
no close form solution for maximizing likelihood for this mixture model, a tractable iterative EM algorithm has been proposed for optimizing its parameters. The EM algorithm alternates between performing an expectation (E) step and a maximization (M) step. The E step leads to the sufficient statistics which are needed to update the parameters in the M step. The expectations are given by:
t ij = (σ 2j I + WTj W j ) W Tj ( x i − μ j ) −1
(6)
and
t ij t Tij = σ 2j (σ 2j I + WTj W j ) + t ij −1
t ij
T
(7)
Then, in the M-step, the parameters are updated by the following equations respectively:
λj =
N
1 N
∑ R (x
∑R
N
μj =
i =1
ij
i
(8)
ij
i −1
− W j t ij
) (9)
N
∑R i =1
ij
⎡N ⎤⎡ N ⎤ W j = ⎢ ∑ Rij ( xi − μ j ) t Tij ⎥ ⎢ ∑ Rij t ij t Tij ⎥ ⎣ i =1 ⎦ ⎣ i =1 ⎦
σ 2j =
1 N
M ∑ Rij i =1
(Q )
−1
(10)
(11)
Incremental Anomaly Detection Approach
195
and 2 ⎧N ⎫ ⎪ ∑ Rij x i − μ j − ⎪ ⎪ i =1 ⎪ ⎪ N ⎪ T T Q = ⎨ 2∑ Rij t ij W j ( x i − μ j ) + ⎬ ⎪ i =1 ⎪ ⎪N ⎪ T T ⎪ ∑ Rij tr ⎡⎣ t ij t ij W j W j ⎤⎦ ⎪ ⎩ i =1 ⎭
where
(12)
Rij is the posterior of mixture j for producing the observation x i and is
updated at the beginning of the E step. This EM algorithm is the same as that for a standard Gaussian mixture and similar to that of a single PPCA, except having Rij as the local weighted term. The computational complexity of the iterative EM scheme for the mixture model is O ( M 3 ) , compared to O ( MPN ) for PCA, and O ( MN 2 + PN 3 ) for isometric feature mapping (ISOMAP). Considering its computational efficiency and its ability to handle nonlinearity, the mixture model can then be regarded as a trade-off strategy between global linear models such as PCA and nonlinear manifold learning such as ISOMAP.
2.4 Chi-square Statistic for Anomaly Detection Based on the mixture model of PPCA, we can characterize observed variables or latent variables by probability distributions. It can be shown that the observed variable x satisfies a mixture of Gaussian distributions under the mixture model as follows:
p ( x | j ) = ∫ p ( x | t, j ) p ( t ) dt = ( 2π )
−M
2
W j W Tj + σI
− 12
−1 ⎧ 1 ⎫ exp ⎨ − ( x − μ j ) ( W j W Tj + σ I ) ( x − μ j ) ⎬ , ⎩ 2 ⎭
The chi-square statistic for a new observation is then given as:
D = (x − μ j )
T
(W W j
T j
+ σ I)
−1
(x − μ ). j
(13)
If the distribution of x ∈ ℜ M is multivariate Gaussian, the statistic is approximately
chi-square distributed with M degrees of freedom ( χ M2 ) . Multivariate outliers can now simply be defined as observations having a large squared Mahalanobis distance D. For our analyses, a 95% quantile is considered for the chi-square distribution.
196
Y. Fang, O.A. Omitaomu, and A.R. Ganguly
2.5 The Anomaly Detection Approach It has been shown that Gaussian distribution is a more accurate density model for one-, two-, and three-dimensional data than for higher data dimensions [8]; we monitor the low dimensional latent variables t, which satisfies isotropic Gaussian distribution. Therefore, our anomaly detection approach is summarized in the following steps: 1.
Assign each observation xi a class label j based on the maximal posterior distribution Rij computed by the EM algorithm for the mixture model of
2.
PPCA. Calculate the chi-square statistic Di for the corresponding latent variable t i given the labeled class j defined as: D = t T t.
3.
(14)
Detect anomalies based on the threshold of the 95% quantile of chi-square distribution with a degree of freedom that is equal to the dimension of the latent variable t.
This approach has an implicit assumption that for each class the majority of its members are normal and only a small fraction within the class is anomalies. In some real applications, the anomalies may consist of a whole class because there are other different classes.
3 Experimental Results To illustrate the effectiveness of our approach, we test it with simulated data and benchmark data respectively.
3.1 Simulated Data In this experiment, 100 samples were generated from each of two multivariate twodimensional Gaussian distributions as C1 ≈ N ( μ1 , ∑1 ) and C2 ≈ N ( μ 2 , ∑ 2 )
⎡1 0 ⎤ T T respectively, where μ1 = [ −5, −5] , μ2 = [ 5,5] , and ∑1 = ∑ 2 = ⎢ ⎥. ⎣0 1 ⎦
Two
outliers, n1 = [5, −5] and n2 = [ 0, 0] replace the first and second observations in the T
T
first Gaussian cluster and another outlier n3 = [ −5,5] replaces the first observation in T
the second Gaussian. The data are shown in Fig. 2 and the anomalies are identified with a circle. Using the proposed anomaly detection approach, Fig. 3 shows the chi-square statistic for each observation and also the 95% quantile threshold. The Fig. shows that the observation 1, 2, and 21 are well above the threshold and thus clearly identified as anomalies. This result is consistent with our prior knowledge about these three observations.
Incremental Anomaly Detection Approach
197
Fig. 2. Simulated data from two dimensional Gaussian distributions with different mean and identical covariance. The circled data are the artificial anomalies.
Fig. 3. Outlier detection results for the 2-D synthetic dataset by mixture of PPCA; the red line indicates the threshold of the 95% quantile of chi-square distribution with a degree of freedom of 1
3.2 Benchmark Data
We illustrate the performance of our proposed approach on an example introduced in [14]. This dataset includes 45 observations of fish. The input variables consist of highly correlated spectra at nine wavelengths. The single output variable is the fat concentration of the fish. The objective in this case is to identify the relationship
198
Y. Fang, O.A. Omitaomu, and A.R. Ganguly
between the spectra and the fat concentration. The input variables are shown in Fig. 4, where observation 1 and 39 – 45 are highlighted. It is reported in [14] that observations 39 – 45 are outliers; by observation, these observations except 42 have a spectrum that apparently deviates from the majority.
Fig. 4. Observations of the benchmark data
Fig. 5. Outlier detection results for the benchmark data by mixture of PPCA; the red line indicates the threshold of the 95% quantile of chi-square distribution with a degree of freedom of 1
Incremental Anomaly Detection Approach
199
Fig. 5 shows the results of our approach. The plot clearly shows that observations 1, 39 – 41, and 43 – 45 are identified as outliers. Compared to our prior knowledge about the data, only observation 42 was not detected. It should be noted that in this unsupervised framework, we discard the output variable. Hubert reported in [15] that robust PLS approach considers both the input and output information and still could not detect observation 42 as an outlier; furthermore, it misclassified observation 12 as an outlier. Compared to the previous approaches, our results are quite satisfactory.
4 Application to Static Scale Data We analyzed the static scale data collected between September 2005 and November 2005 at Watt Road weigh station in Knoxville, Tennessee. This data consists of seven features – truck lengths, truck weights at three locations, number of axles, vehicle speeds at the weigh station and the distance of the vehicle from the sensor. The dimension of latent variable t is predefined as two based on the previous studies [8]. Fig. 6 shows the two dimensional latent variable for one data cluster. The original data for trucks in this “anomalous” class include trucks with vehicle speed over 70 mph, which validates our preconception.
Fig. 6. Two dimensional data projection for one cluster using mixture of PPCA
Within the "normal" class, we can still identify outliers based on the 95% quantile of chi-square statistic for this class (see Fig. 7). They are the anomalies which are not as different as those in the "anomalous" class, but may still need a further investigation. To compare the Chi-square statistic, we focus our analysis on the first 500 observations. Fig. 8 shows the results with degree of freedom equals one (P = 1).
200
Y. Fang, O.A. Omitaomu, and A.R. Ganguly
Fig. 7. Two dimensional data projection for another cluster using mixture of PPCA; the red circle indicates the 95% confidence bound
Fig. 8. Outlier detection for 500 observations using mixture of PPCA; the red line indicates the threshold of the 95% quantile of chi-square distribution with a degree of freedom of 1
Some of the insights from the analysis of these datasets are that two dimensional data projection captures most of the variability in the static scale data as initially hypothesized in [8]; however, further validation is necessary as more data are collected over time. A careful approach for setting the threshold is necessary as evident from Fig. 8. In Fig.8, a slightly higher threshold would shift two trucks below the threshold line and constitute missed detections. A smaller threshold, on the other
Incremental Anomaly Detection Approach
201
hand, would place several trucks above the threshold line and increase the number of false alarms. Therefore, a balance is needed between what the threshold should be and the number of false alarms (and missed detections) the system is willing to accept. Further studies are needed to explore these and other insights.
5 Summary In this paper, we have presented a two-stage incremental anomaly detection approach for real-time decisions with application to transportation security. The first stage uses all available data to extract significant statistics that can be used to characterize the trucks. The extracted statistics are then used in the second stage to determine if a new truck to the weigh station is an anomaly. The first stage statistics is updated as more data becomes available. A case study using static scale data is also presented to illustrate the proposed approach. The anomaly detection approach performs satisfactorily on simulated and benchmark datasets. It also consistently identified trucks with anomalous features in all scenarios investigated.
Acknowledgment This research was funded by the Laboratory Directed Research and Development (LDRD) Program of the Oak Ridge National Laboratory (ORNL), managed by UTBattelle, LLC, for the U.S. Department of Energy under Contract DE-AC0500OR22725. We would like to gratefully acknowledge synergistic research activities by the SensorNet® Program managed by the Computational Sciences and Engineering Division of the Oak Ridge National Laboratory. We specifically thank the following people in the SensorNet® group: Frank DeNap, David Hill, David Feaker, Randy Walker, and Steven Saavedra. We also thank Dr. Brian Worley for his contributions to the Transportation Corridor research. We are grateful to the following scientists from ORNL who have reviewed this manuscript, either formally or informally: Mallikarjun (Arjun) Shankar, Raju Vatsavai, Randy Walker, Cy Smith, Bryan Gorman and Frank DeNap. This manuscript has been authored by UT-Battelle, LLC, under contract DE-AC05-00OR22725 with the U.S. Department of Energy. The United States Government retains, and the publisher by accepting the article for publication, acknowledges that the United States Government retains, a nonexclusive, paid-up, irrevocable, world-wide license to publish or reproduce the published form of this manuscript, or allow others to do so, for United States Government purposes.
References 1. Kouzes, R.T., Ely, J.H., Geelhood, B.D., Hansen, R.R., Lepel, E.A., Schweppe, J.E., Siciliano, E.R., Strom, D.J., Warner, R.A.: Naturally Occurring Radioactive Materials and Medical Isotopes at Border Crossings. In: IEEE Nuclear Science Symposium Conference Record, vol. 2, pp. 1448–1452 (2003)
202
Y. Fang, O.A. Omitaomu, and A.R. Ganguly
2. Ely, J.H., Kouzes, R.T., Geelhood, B.D., Schweppe, J.E., Warner, R.A.: Overview of Naturally Occurring Radioactive Material in Plastic Scintillator Materials. IEEE Transactions on Nuclear Science 51(4), 1672–1676 (2004) 3. Brennan, S.M., Mielke, A.M., Torney, D.C., Maccabe, A.B.: Radiation Detection with Distributed Sensor Networks. IEEE Computer 37(8), 57–59 (2004) 4. Brennan, S.M., Mielke, A.M., Torney, D.C.: Radioactive Source Detection by Sensor Networks. IEEE Transactions on Nuclear Science 52(3), 813–819 (2005) 5. Geelhood, B.D., Ely, J.H., Hansen, R.R., Kouzes, R.T., Schweppeand, J.E., Warner, R.A.: Overview of Portal Monitoring at Border Crossings. In: IEEE Nuclear Science Symposium Conference Record, vol. 2, pp. 513–517 (2003) 6. Valentine, T.E.: Overview of Nuclear Detection Needs for Homeland Security. In: Proceedings of the American Nuclear Society, PHYSOR 2006, Vancouver, BC, Canada, September 10-14 (2006) 7. Omitaomu, O.A., Ganguly, A.R., Patton, B.W., Protopopescu, V.A.: Anomaly Detection in Radiation Sensor Data with Application to Transportation Security. IEEE Transactions on Intelligent Transportation Systems 10(2), 324–334 (2009) 8. Agovic, A., Banerjee, A., Ganguly, A.R., Protopopescu, V.A.: Anomaly Detection in Transportation Corridors Using Manifold Embedding. In: Proceedings of the 1st International Workshop on Knowledge Discovery from Sensor Data (2007) 9. Everitt, B.S.: An Introduction to Latent Variable Models. Chapman & Hall, London (1984) 10. Roweis, S., Ghahramani, Z.: A Unifying Review of Linear Gaussian Models. Neural Computaion 11(2), 305–345 (1999) 11. Tipping, M.E., Bishop, C.M.: Probabilistic Principal Component Analysis. Journal of the Royal Statistical Society B 61, 611–622 (1999a) 12. Dempster, A., Laird, N., Rubin, D.: Maximum Likelihood from Incomplete Data via the EM Algorithm. Journal of the Royal Statistical Society, Series B 39(1), 1–38 (1977) 13. Tipping, M.E., Bishop, C.M.: Mixtures of Probabilistic Principal Component Analyzers. Neural Computation 11, 443–482 (1999b) 14. Naes, T.: Multivariate Calibration When the Error Covariance Matrix is Structured. Technometrics 27, 301–311 (1985) 15. Hubert, M., Rousseeuw, P., Verboven, S.: A Fast Method for Robust Principal Components with Applications to Chemometrics. Chemometrics and Intelligent Laboratory Systems 60, 101–111 (2002)