Industrial Application of Nonlinear Model Predictive. Control Technology for Fuel Ethanol Fermentation. Process. James Bartee, Patrick Noll, Celso Axelrud.
2009 American Control Conference Hyatt Regency Riverfront, St. Louis, MO, USA June 10-12, 2009
ThA10.2
Industrial Application of Nonlinear Model Predictive Control Technology for Fuel Ethanol Fermentation Process
A. Fermentation Process
James Bartee, Patrick Noll, Celso Axelrud Carl Schweiger, Bijan Sayyar-Rodsari Pavilion Technologies, Austin, TX 78759 Abstract— There are currently 134 ethanol biorefineries in the United States with a production capacity of nearly 7.2 billion gallons per year, with an additional 6.2 billion gals per year capacity under the construction [1]. Approximately two thirds of these are dry-mill production facilities. Fermentation is a key biorefining process and provides the greatest opportunity for increasing ethanol production. Effective control of the fermentation process is therefore of critical importance to the economic viability of the ethanol production. While this has been the impetus for an increasing interest from researchers in academia and industry, successful control strategies have proven difficult to develop. In this paper we report successful control of ethanol fermentation process in an industrial setting using a parametric nonlinear model predictive control technology. We demonstrate that, using empirical process data and fundamental process knowledge, accurate and numerically efficient models of the fermentation process can be built that enable an optimizationbased control of the complex fermentation process. The control strategy is briefly described and representative plots indicating model quality and controller performance are presented.
I. I NTRODUCTION There are currently 134 ethanol biorefineries in the United States with a production capacity of nearly 7.2 billion gallons per year, with an additional 6.2 billion gals per year capacity under the construction [1]. Approximately 2/3 of these are dry-mill production facilities. In the biorefinery, corn is provided to a milling and cooking process, where it is broken down to increase the surface area to volume ratio. This increase in surface area allows for sufficient interaction with water to achieve a solution of fermentable sugars, known as beer mash. The mash is heated to promote an increase in the amount of biomasswater contact in solution and to increase the separation of carbohydrate biomass from the non-carbohydrate biomass. Enzyme (alpha-amylase) is typically added in the liquefaction section to promote further breakdown of the longchained carbohydrate polymers. The mash is then sent to a fermentation process, where several fermentation tanks operate to ferment the mash slurry. The output from the fermentation process is sent to a distillation process to separate ethanol from water, carbon dioxide, and non-fermentable solids (stillage Distillers Grain with solubles, DGS). The ethanol is further dehydrated to moisture levels less than 5% (by a processing unit called a molecular sieve), and denatured (to prevent human consumption). Stillage (non-fermentable solids and yeast residue), the heaviest output of the distillation units, is sent to stillage processing for further development of co-products from the biofuel production process.
978-1-4244-4524-0/09/$25.00 ©2009 AACC
The fermentation process is the heart and soul of an ethanol production facility and provides the greatest opportunity for increasing ethanol production. The fermentation process uses a living organism (yeast) to convert fermentable sugar (e.g., dextrose and/or glucose) to ethanol with a byproduct of carbon dioxide and energy. The typical ethanol conversion is given by the following equation [2]: Corn(56lbs) → Starch(32lbs) + H2O + enzymes → Sugar(36lbs) + yeast → Ethanol(17.6lbs) +CO2(18.4lbs) + heat(6000BTU) + DDGS(17lbs) Figure 1 shows a typical plant layout for the fermentation section of a fuel ethanol production facility, while Figure 2 shows typical Ethanol and carbohydrate concentrations for fermentation batches. The fuel ethanol fermentation process has several distinct components. 1) It is a fed-batch operation. A typical fermentation batch time is between 45 and 60 hours. The fermentation tank is being filled for 20-25% of this time. 2) Mash (a mixture of water and milled corn) is pumped to the fermenter at a rate of 200-800 GPM depending on plant size. The mash has been treated with an enzyme called alpha-amylase (AA) that is used to assist in breaking down the corn starch to simpler sugars. 3) Yeast is purchased in dry or liquid form and is prepared for addition to the fermenter by mixing it with diluted mash in a propagation tank. This yeast mixture is added to the fermenter as it is being filled with mash. 4) Another enzyme, glucoamylase (GA), is added to the fermentation tank during fill time to further break down sugars to glucose. Other ingredients are also added that are necessary for proper yeast growth - e.g. a nitrogen source, anti-infection source. 5) The system is very sensitive to temperature. The enzymes prefer higher temperatures whereas the yeast prefers lower temperatures. 6) The plant lab typically tests several items at various times throughout the batch to measure the fermentation progress; (a) Temperature, (b) pH, (c) Sugars: DP4, DP3, Maltose and Glucose, (d) Byproducts: Lactic acid, Acetic acid and Glycerol, and (e) Ethanol. Enzymes are used in the fermentation process to break down the carbohydrates of the corn kernels down to fermentable sugars, namely glucose. Native starch as found in the ethanol industry’s predominate feed supply, corn, is a large chained polymer made up of many glucose molecules. These polymers can be straight-chained molecules (Amylose) or branched chained (Amylopectin). North American corn is typically made of 25% Amylose and 75% Amylopectin [3]. α-Amylase (AA) is used to hydrolyze the linear bonds creating shorter-chained starch polymers, refered to as
2290
B. Bioreactor Control - Brief Survey
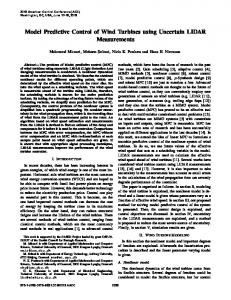
Figure 1: Typical Fuel Ethanol Fermentation Layout.
Figure 2: Typical fermentation concentrations.
dextrins. This enzyme is usually added in the liquefaction section of the plant. Glucoamylase is added directly to the fermentation tank resulting in simultaneous saccharification (breaking down of the corn starch) and fermentation (conversion if dextrose to ethanol). In the fuel ethanol industry, the addition of glucoamylase is an important component in the fermentation process as it can be used to regulate the amount of fermentable sugars present in the yeast/mash mixture. While there are several products of the fermentation process, the main product of interest is ethanol. Other products, such as the acids, can indicate a problem within the fermenter if produced in large amounts. A key point of the process is that not only is the yeast present, but it is active and reproducing. Active yeast has the greatest capacity for producing ethanol. Yeast cells go through four phases of growth in the fermentation process: 1) Lag phase - yeast adapts to the mash environment. 2) Acceleration phase - adapted yeast cells begin to reproduce 3) Exponential growth phase - yeast cells grow at their fastest rate, producing the greatest amount of alcohol 4) Deceleration phase - the amount of actively growing yeast begins to decline, slowing the alcohol conversion. This cell growth pattern is not specific to ethanol production and has been observed in other fermentation processes [4].
Spurred by the current increase in fuel ethanol production, control of bioreactors has become an area of active research over the past few years. An optimal control approach for generalized bioreactors is proposed in [5] where the controller performance is demonstrated using simulations of a Penicillin G fed-batch bioreactor. An optimization approach on a simulation of a fed-batch ethanol fermentation process is studied in [6]. The formulated problem is solved using an Iterative Dynamic Programming method. A nonlinear multivariable predictive control for a continuous extractive alcoholic fermentation process is proposed in [7]. Simulation study (using an experimentally validated model) is used to test controller performance. An overview of controlling nutrient supply for the optimization of fed-batch fermentation is provided in [8]. Control methodologies examined include fuzzy control, inferential control and the use of neural networks. A methodology for the simultaneous optimization and control of beer fermentation is described in [9]. Temperature profiles were calculated and tested on a laboratory scale bioreactor. An optimization-based approach for developing optimal temperature profiles of a batch fermentation process is proposed in [10]. The methodology is tested on a simulation of a beer fermentation process. The approach taken in this paper differs from those found in the literature in that: (a) numerically efficient parametric nonlinear models are used in an optimization-based approach to the control of ethanol fermentation process [11], (b) constrained optimization is used to build numerically efficient nonlinear process models using both empirical data and firstprinciples knowledge of the process [12], (c) the control strategy is based on the optimization of a key intrinsic component of the fermentation process in order to maximize the desired product, ethanol, and (d) control methodology has been applied to industrial-scale ethanol production with production capacity of up to 100 million gallons of ethanol per year. II. N ONLINEAR M ODEL P REDICTIVE C ONTROL FOR E THANOL F ERMENTATION The key to producing ethanol is to maintain the healthy growth of yeast. Saccharomyces cerevisiae, the yeast most commonly used in the fermentation process, reproduces by division. The cell produces buds which become new independent cells. Fermentation due to cell reproduction is an order of magnitude greater than non-reproducing cells [13]. Therefore, a successful control strategy must ensure yeast growth by optimizing the growth conditions in the fermentation tank. As most ethanol production facilities operate with simultaneous sacchrification and fermentation, the dextrose levels in the fermentation tank can be controlled by the concentration of the Glucoamylase enzyme. Therefore, we implemented a nonlinear receding-horizon controller in which the fermentation temperature and enzyme flow to
2291
the fermenter are the manipulated variables, and the yeast growth and dextrose concentrations in the fermenter are the controlled variables. Note that we treated the concentration of ethanol, the amount of dextrins entering the fermenter, and the volume of mash in the fermenter as disturbance variables, and designed the nonlinear MPC controller such that it could appropriately respond to the changes in these variables. Predictive use of projections of ethanol concentration over prediction horizon enables the nonlinear controller to take appropriate actions that ensure maximum ethanol production. III. K INETIC M ODEL FOR F UEL E THANOL F ERMENTATION Fermentation process models have become a research area of increasing significance due to the desire to optimize and control these process units. A simplified fermentation model based on neural networks is presented in [15]. A methodology for estimating parameters of ethanol production from dextrose using high temperature tolerant yeast is described in [16]. A model based on concentration of dissolved oxygen and carbon dioxide is proposed in [17]. This model did not include any enzyme conversions. A detailed model of the kinetics included in the production of dextrose through a series of enzymatic reactions is presented in [18]. In a more recent study, a metabolic model is used to predict glycerol production in the fermentation process [19]. Despite significant research efforts, a kinetic model of the fermentation process that captures the relevant details for an industrial scale nonlinear MPC implementation proved a significant challenge. In particular, an appropriate model for MPC implementation must incorporate all aspects of an industrial process including: mash flow to fermenter, solids in mash flow, addition of yeast from propagation tank, addition of glucoamylase enzyme, fermentation temperature, yeast growth, glucose creation and depletion, starch depletion (sugar source - dextrin), and ethanol production. We used a parametric dynamic model of the following type, shown in Figure 3, to capture the process behavior1 : X(k + 1) = F (X(k), U (k), P (k)) Y (k) = X(k)
x5 /y5 : concentration of ethanol, x6 /y6 : concentration of dextrin (longer chain sugars DP2, DP3, etc.) • x7 /y7 : concentration of glucoamylase, U ∈ R4×1 is the input vector: • u1 : flow of mash slurry, • u2 : flow from propagation tank, • u3 : enzyme flow. • u4 : temperature. and, P ∈ R11×1 is the parameter vector: • p1 : amount of yeast in propagation tank, • p2 : fermentable sugars in mash feed, • p3 : fermentable sugars in propagation tank at drop, • p4 : ethanol in propagation tank, • p5 : ethanol in feed mash, • p6 : sugar concentration in feed stream, • p7 : conversion rate for lag yeast, • p8 : growth rate for active yeast, • p9 : conversion rate of dextrins to glucose by Glucoamylase, • p10 : conversion rate of sugar, • p11 : conversion rate of ethanol, Of the parameters listed above, parameters p7 -p11 , are modeled as neural networks via a constrained training procedure using empirical process data and knowledge of the parameter variations as a function of process inputs [20]. The computational efficiency of the receding horizon control algorithm requires efficient use of the process model of Eqs. (1)-(2) for prediction calculations. For this purpose we used the following nonlinear discrete structure that has its roots in the theory of Taylor series expansion around trajectories: •
•
yj (k) = yj (k−1) +
1 While the details of the proprietary models developed during this project are not disclosed here, it is important to point out that they are carefully constructed parametric models in which, (a) model structure is based on the first-principles process model, and (b) model parameters are static nonlinear mappings identified through constrained optimization using actual plant data. The constraints for the constrained training of the model parameters are also derived from first-principles knowledge of the process.
δyj,i (k)
(3)
i=1
δyj,i (k) = aji,1 (k)δyj,i (k−1) + aji,2 (k)δyj,i (k−2) + · · · + bji,1 (k)δui (k−1−∆ji ) + bji,2 (k)δui (k−2−∆ji ) + · · · � � aji,l (k) = αji,l u1 (k), · · · , uNu (k), y1 (k), · · · , yNy (k) � � bji,l (k) = βji,l u1 (k), · · · , uNu (k), y1 (k), · · · , yNy (k)
(1) (2)
where k is the discrete time index, X ∈ R7×1 is the state vector (in this case the same as the output vector): • x1 /y1 : volume of fermenter, • x2 /y2 : concentration of lag yeast (yeast not yet active), • x3 /y3 : concentration of active yeast, • x4 /y4 : concentration of convertible sugars (glucose, dextrose),
Nu X
where Nu is the number of inputs (four for this problem), Ny is the number of outputs (seven in this problem), yj (k) is the j-th output (control variable), j ∈ {1, · · · , Ny }, at time k, δyj,i (k) is the incremental change in the output yj from time step k − 1 to k due to the incremental change in input (manipulated or disturbance variable) ui , i ∈ {1, · · · , Nu }, and ∆ji is the delay. Note that aji,l (·) and bji,l (·) are appropriately defined functions of the operating condition of the process that offer degrees of freedom in describing the effect of the i-th input on the j-th output.
2292
Figure 3: Block diagram of the parametric model for fermentation
We have developed robust algorithms for the identification of the nonlinear mappings αji,l (·) and βji,2 (·). In particular, extrapolating gain-constrained neural networks are shown to be capable of using both process data and first-principles knowledge in developing such nonlinear mappings [14], [11]. Some key features of the parametric nonlinear model of Eq. (3) are:
Figure 4: Ethanol VOA comparison to HPLC Data
1) It offers good approximation capability not only locally but also over the prediction horizon (normally selected to be the time needed to reach the steady-state). 2) It enables engineers and operators to easily understand, develop, and maintain the models. 3) It allows fast and stable execution of the real-time nonlinear optimization problem as the functions αji,l (·) and βji,l (·) are smoothly differentiable functions. IV. P ERFORMANCE R ESULTS In this section we discuss some representative results from the application of our parametric nonlinear MPC technology to the control of ethanol fermentation in an industrial setting. To our knowledge, prior to our work, there has been no reliable methods for online analysis of key fermentation variables, particularly ethanol concentration and dextrose concentration. We have used our parametric hybrid modeling methodology to develop effective virtual analyzers for process variables that are needed in an MPC control strategy. Figure 4 demonstrates the performance of the ethanol concentration model developed using our parametric hybrid modeling methodology versus plant HPLC lab results. The ethanol concentration model provides accurate prediction of ethanol concentration at a frequency needed by the nonlinear MPC controller. In the reported example, lab samples are available only 5 times throughout approximately 50 hours of batch operation. Figure 5 demonstrates the performance of the dextrose concentration model developed using our parametric hybrid modeling methodology versus plant HPLC lab results. The dextrose concentration model provides accurate prediction of sugar concentration at a frequency needed by the nonlinear MPC controller. Again, lab samples are available only 5 times throughout the batch operation.
Figure 5: Dextrose VOA comparison to HPLC Data
Figure 6 demonstrates the performance summary for an ethanol fermentation process prior to the application of the nonlinear MPC controller. A total of 53 batches are used to generate the histogram of Fig. 6. As the figure indicates, the mean for the % ethanol produced at the end of the fermentation is 12.214 with the standard deviation of 0.564. Figure 7 reflects the results after the introduction of the nonlinear MPC controller. A total of 57 batches are used to generate the histogram of Fig. 7. After the introduction of the nonlinear model predictive control strategy, the mean for the final ethanol production is increased to 12.933, while the standard deviation is reduced to 0.430. In this case a 5.9% increase in ethanol production is recorded. The control strategy described here is applied to several industrial units and the results reported are typical of performance benefits in these applications. V. C ONCLUSIONS Accurate and computationally efficient models of the process are key to the success of a nonlinear MPC solution es-
2293
Figure 6: Ethanol production performance without nonlinear MPC
Figure 7: Ethanol production performance with nonlinear MPC
pecially in a complex batch fermentation process. We report successful implementation of an optimization-based control strategy for the ethanol fermentation process in an industrial setting using a parametric hybrid modeling technology that utilizes both process data and first-principles knowledge of the process. Representative plots indicating the quality of the models and controller performance are reported.
[6] J. Chiou and F. Wang, “Hybrid method of evolutionary algorithms for static and dynamic optimization problems with application to a fed-batch fermentation process,” Computers & Chemical Engineering, vol. 23, pp. 1277–1291, 1999. [7] L. de Cruz Meleiro, A. de Costa, and R. Ficho, “Non-linear multivariable predictive control of an alcoholic fermentation process using functional link networks,” Brazilian Archives of Biology and Technology, vol. 48, pp. 7–18, June 2005. [8] J. Lee, S. Lee, S. Park, and A. Middleberg, “Control of fed-batch fermentations,” Biotechnology Advances, vol. 17, pp. 29–48, 1999. [9] B. de Andres-Toro, J. Giron-Sierra, P. Fernandez-Blanco, J. LopezOrozco, and E. Besada-Portas, “Multiobjective optimization and multivariable control of the beer fermentation process with the use of evolutionary algorithms,” Journal of Zhejiang University Science, vol. 5, pp. 378–389, 2004. [10] J. Madar, J. Abony, B. Balasko, and F. Szeifert, “Interactive evolutionary computation for model based optimization of batch fermentation,” Proceedings of the Artificial Intelligence and Application, Sept. 2003. [11] B. Sayyar-Rodsari, C. Axelrud, and K. Liano, “Model Predictive Control for Nonlinear Processes with Varying Dynamics,” Hydrocarbon Processing, pp. 63–69, October 2004. [12] B. Sayyar-Rodsari, E. Hartman, E. Plumer, K. Liano, and C. Schweiger, “Extrapolating Gain-Constrained Neural Networks Effective Modeling for Nonlinear Control,” Proceedings of CDC 2004, pp. 4964–4971, 2004. [13] I. Russell, Understanding Yeast Fundamentals. The Alcohol Textbook, 4th Edition, pp.85-119, 2003. [14] E. Hartman, “Training feedforward neural networks with gain constraints,” Neural Computation, vol. 12, pp. 811–829, April 2000. [15] A. Costa, A. Henriques, T. Alves, R. M. Filho, and E. Lima, “A Hybrid Neural Model for the Optimization of Fed-batch Fermentations,” Braz. J. Chem. Eng, vol. 6, pp. 53–63, 1999. [16] F. Wang and J. Sheu, “Multiobjective Parameter Estimization Problems of Fermentation Process using a High Tolerance Yeast,” Chemical Engineering Science, vol. 55, pp. 3685–3695, 2000. [17] O. Roeva, T. Pencheva, B. Hitzmann, and S. Tzunkov, “A genetic algorithms based approach for identification of escherichia coli fedbatch fermentation,” Bioautomation, vol. 1, pp. 30–41, 2004. [18] M. G. M. Froelich and, K.Hazauech, A. Stepp, C. Vogl, X. Wan, and X. Xia, “Problem2: Mathematical Modeling of Enzyme Action in Fuel Alcohol Production,” Proceedings of the 11th Industrial Mathematics and Statistics Workshop (NCSO), pp. 22–34, 2004. [19] C. Bideaux, S. Alfenore, X. Cameleyre, C. Molina-Jouve, J. Uribelarrlea, and S. Guillouet, “Minimization of Glycerol Production during the High-Performance Fed-Batch Ethanolic Fermentation Process in Saccharomyces cerevisiae, Using a Metabolic Model as a Prediction Tool,” Applied and Envirnmental Microbiology, pp. 2134–2140, March 2006. [20] C. Schweiger, B. Sayyar-Rodsari, J. Bartee, and P. Noll, “A Parameteric Hybrid Nonlinear Model for Model Predictive control of a Batch Fermentation Process in a Bio-Reactor,” Presented at the National AIChE Meeting, Salt Lake City, Utah, 2007.
R EFERENCES [1] “Website for renewable fuels association,” http://www.ethanolrfa.org/industry/locations/, September 2008. [2] D. Kelsall and T. Lyons, “Practical management of yeast: conversion of sugars to ethanol,” The Alcohol Textbook, 4th Edition, pp. 121–133, 2003. [3] R. Power, “Enzymatic conversion of starch to fermentable sugars,” The Alcohol Textbook, 4th Edition, pp. 24–32, 2003. [4] Iyer and Wunsch, “Dynamic reoptimization of a fed-batch fermenter using adaptive critical designs,” IEEE Transactions on Neural Netowrks, vol. 12(6), pp. 1433–1444, November 2001. [5] J. V. Imp and G. Bastin, “Optimal adaptive control of fed-batch fermentation processes,” Control Eng. Practice, vol. 3, pp. 939–954, 1995.
2294