Iran J Sci Technol Trans Sci manuscript No. (will be inserted by the editor)
Influence of P2 O5 and SiO2 addition on the phase, microstructure, and electrical properties of KNbO3
arXiv:1805.09988v2 [cond-mat.mtrl-sci] 19 Jul 2018
S. Ullah1,2,* · I. Ullah1 · Y. Iqbal1 · A. Manan1,3 · S. Ali1 · A. Khan4
Received: July, 2018 / Accepted: —, 2018
Abstract In this contribution, the effect of P2 O5 and SiO2 addition on the phase, microstructure, and electrical properties of KNbO3 was studied. Sample powders with the general formula (1-x)KNbO3 .xP2 O5 (x = 0.03, 0.05) and (1x)KNbO3 .xSiO2 (x = 0.1) were prepared via mixed-oxide route. The thermal behavior of the mixed-milled powder was investigated by TG/DTA which revealed an overall weight loss of 33.4 wt % in the temperature range of 30 ≤ T ≤ 1200 ◦ C and crystallization exotherm occurring at about 795 ◦ C. The present results indicated that P O acted as a sin2 5 tering aid and lowered the sintering temperature by about 30 ◦ C and promoted densification of KNbO3 . Sample compositions at various stages of processing were characterized using X-ray diffraction. Samples sintered at T ≤ 1020 ◦ C revealed mainly KNbO3 together with a couple of low-intensity K3 NbO4 peaks as a secondary phase. The SEM images of (1-x)KNbO3 .xSiO2 (x = 0.1) samples showed a slight increase in the average grain size from 3.76 µm to 3.86 µm with an increase in sintering temperature from 1000 ◦ C to 1020 ◦ C. Strong variations in dielectric constant and loss Correspondence author: Dr. Saeed Ullah E-mail:
[email protected] Tel.: +92-342-9070068
1 Materials Research Laboratory, Department of Physics, University of Peshawar, 25120, Pakistan 2 Department of Physics, Gomal University, Dera Ismail Khan 29220, KP, Pakistan 3 Department of Physics, University of Science and Technology, Bannu Khyber Pakhtunkhwa, Pakistan 4 Center of Excellence in Solid State Physics, University of the Punjab, Lahore-54590, Pakistan
tangent were observed due to P2 O5 and SiO2 addition as well as frequency of the applied AC signals. Keywords Phase · Microstructure · Sintering · TG/DTA · Weight loss · Potassium niobate. 1 Introduction To meet the massive demands of the evolving society advanced technological developments are required[1]. Therefore, it is highly desirable to use new and advanced materials with improved properties[2, 3]. Currently, the leadbased piezoelectric materials, such as Pb(Zr,Ti)O3 (PZT) and Pb(Mg0.33 Nb0.67 )O3 -PbTiO3 (PMN-PT), dominate the commercial piezoelectric applications. While such materials, due their superior properties, have been widely used in microelectronics and electronic devices as dielectric capacitors, ultrasonic or medical transducers, ultrasonic motors, and sensors[4, 5]. However, one of the major drawbacks of these materials is the environmental and health-related issues. These materials contain about 70 wt% of poisonous lead-oxide which is an ecological hazard[6]. Material scientists are looking forward to orient the current research towards environmentally friendly materials of comparable properties[7, 8]. Recently, a number of materials such as barium titanate, bismuth-alkaline metal titanates, and alkalineniobates are revisited as potential alternatives to lead-based piezoceramics[9]. Among those alternatives, potassium niobate [KNbO3 ] (KN) based materials are the front-running candidates due to their large non linear optical[10] and electro-optic coefficient[11], moderate dielectric constant, and excellent photorefractive and electrical properties[12, 13, 14, 15, 16]. Additionally, such materials also offer possibilities for applications, for example, in the production of surface acoustic wave (SAW) devices and wide-band SAW filters[17, 18]. However, the den-
S. Ullah1,2,* et al.
2
sification of these materials is problematic due to several reasons. One of the main reason is the phase stability of KNbO3 which is limited to 1040 ◦ C which further restrains the high-temperature sintering[19]. Additionally, potassium oxide is volatile and evaporates easily with rising temperature during the sintering process and hence leads to the formation of some unstable secondary phases in the final product. Furthermore, slight changes in the stoichiometry can also result in the formation of unwanted phases. Various techniques have been developed for the improvement of densification of niobate-based ceramics, for example, hot pressing and spark plasma sintering (SPS). However, these techniques are not suitable to enhance the sintering in various commercial applications[20,21]. Based on previous efforts, it has been concluded that the modification of stoichiometry[15] or addition of sintering agents such as CuO, CeO2 , MnO2 , TiO2 and other oxides, have a significant impact on the improvement of sinterability[22,23, 24, 25, 26, 27, 28, 29]. These oxides form a liquid phase and promote densification[25,26,28]. The objective of the present work was to investigate the effect of P2 O5 and SiO2 addition on the phase, microstructure and electrical properties of KN. A number of experimental groups have reported the addition of various oxides into KN-based materials. However, to our knowledge, no report regarding the use of P2 O5 and SiO2 addition has, to date been appeared in the literature.
2 Materials and Experiment
method, however, due to its hygroscopic nature, the P2 O5 added samples dissolved in water[30]. Densities were then calculated from the mass and dimensions of the pellets and converted to the relative densities using theoretical density (TD) of KNbO3 (4.167 g/cm3 )[26]. The crystalline phases of compositions, at different stages of processing, were assessed by a JEOL X-ray diffractometer (model JDX-3532) in the 2θ range of 10-70◦ with Cu Kα radiations operating at 40 kV and 30 mA with a step size of 0.02◦ . The sintered samples were cut with a diamond fine cutting saw, smoothened using a polishing wheel with sandpaper and then polished using a polishing wheel with a nylon cloth and diamond paste. After polishing, the samples were thermally etched at a temperature 10% less than the corresponding sintering temperatures. Polished samples were then gold-coated to avoid charging in the scanning electron microscope (SEM). Microstructural characterization was performed using SEM (JEOL JSM 5910). The grain size measurements were performed using mean intercept length method at different areas of the sample. The dielectric constant (εr ) and loss tangent (tanδ ) were measured in a frequency range of 1 MHz to 1 GHz employing a 4287A LCR meter. All the experiments were carried out using the equipment installed at the Materials Research Laboratory (MRL) and Centralized Resource Laboratory (CRL), University of Peshawar.
3 Results and Discussions
3.1 TG/DTA Analysis The (1-x)KNbO3 .xP2 O5 (x = 0.03, 0.05) and (1-x)KNbO3 .xSiO2 Fig. 1 depicts the TG/DTA curve of the stoichiometric pre(x = 0.1) samples were prepared via a conventional mixedcursor of KNbO3 showing three major and two minor downoxide route using K2 CO3 and Nb2 O5 as starting materials. ward slopes in the employed temperature range i.e. from The amount of oxides, to produce the stoichiometric KN, room temperature to 1200 ◦ C. Consistent with the TG slopes, were calculated on the basis of their molecular weights. The four endotherms were observed on the DTA curve at temperweighed amounts were wet ball milled for 24 h in disposatures 52-153 ◦ C, 464 ◦ C, 792 ◦ C and 1126 ◦ C respectively. able polyethylene mill jars using Y-toughened ZrO2 balls The wt% losses determined at 50-171 ◦ C, 430-475 ◦ C and as grinding media and iso-propanol as a lubricant to make 475-900 ◦ C were 13.23 wt%, 4.28 wt%, and 11.11 wt% rethe slurry. The slurry was then dried overnight in an oven ◦ spectively. Furthermore, relatively minor wt% losses (i.e., at 95 C. To determine the phase transformation temper3.75 wt% and 1.052 wt%) were observed at 171-430 ◦ C and atures, thermal gravimetry and differential thermal analy900-1200 ◦ C. The observed weight losses at different temsis (TG/DTA) was carried out in the temperature range of peratures are listed in Table 1. The overall wt% loss was 30-1200 ◦ C with a heating/cooling rate of 5 ◦ C/min using 33.4 wt%. The wt% loss at 50-171 ◦ C may be due to the dea Perkin Elmer TG/DTA unit. The mix-milled powder was ◦ hydration of the sample, i.e., the removal of surficial water then calcined at 850 C for 2 h at the same heating/cooling present in the raw materials[31]. rate. To lower the sintering temperature, the as-calcined powder were then mixed with 0.03 and 0.05 wt% P2 O5 and 0.1 The weight loss observed in the temperature range 430wt% SiO2 and re-milled for 24 h. 475 ◦ C and the observed DTA endotherm at 464 ◦ C may be associated with the glass transition of some of the glass The powders were then pressed into pellets of 10 mm diformers (i.e., P2 O5 and SiO2 ) present in the batch. In the ameters at ∼100 MPa using a manual pellet press, followed temperature range of 475-900 ◦ C, the observed weight loss by sintering at various temperatures. The apparent densiis attributed to the decomposition of K2 CO3 , releasing CO2 ties of the specimens were measured employing Archimedes
Influence of P2 O5 and SiO2 addition on the phase, microstructure, and electrical properties of KNbO3
Fig. 1 TG/DTA curves of as-mixed-milled material, showing major weight losses in the temperature ranges of 50-171 ◦ C, 430-475 ◦ C and 475-900 ◦ C with the corresponding endotherms at 153 ◦ C, 464 ◦ C and 792 ◦ C. Note the corresponding endo-or exo-therms on the DTA curve.
3
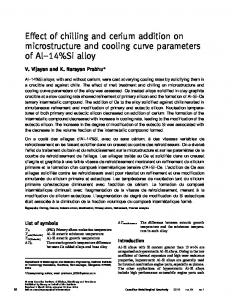
Fig. 2 X-ray diffraction patterns recoded from a) as-mix-milled batch b) (1-x)KNbO3 .xP2O5 (x = 0) calcined at 850 ◦ C c) the (1-x)KNbO3 .xP2 O5 (x = 0.03) sintered at 1000 ◦ C d) the (1x)KNbO3 .xP2 O5 (x = 0.05) sintered at 1020 ◦ C and e) the (1x)KNbO3 .xSiO2 (x = 0.1) sintered at 1020 ◦ C.
by combustion reaction (See Eq. 1). K2CO3 −−−−−−→ K2 O +CO2
(1)
A corresponding endotherm was observed on the DTA curve at 792 ◦ C. In the temperature range 900-1200 ◦ C, the relatively small wt% loss is related to the removal of entrapped gases upon partial melting of the sample releasing CO2 and other gases[32]. In the temperature range 900-1200 ◦ C, the DTA curve showed a corresponding endotherm at 1126 ◦ C consistent with the TG results. The exotherm observed on the DTA curve at 795 ◦ C is associated with the crystallization of potassium niobate[33] as confirmed by phase analysis (See Fig. 2). Based on the TG/DTA analysis, temperatures in the range from 800 to 1030 ◦ C were selected for calcinations. The mixed-milled sample was calcined in air at 850 ◦ C for 2 h with a heating/cooling rate 5 ◦ C /min. Table 1 Weight loss of KNbO3 at various temperatures. S. No 1 2 3 4 5
Temperature range 50 - 171 ◦ C 171 - 430 ◦ C 430 - 475 ◦ C 475 - 900 ◦ C 900 - 1200 ◦ C
Weight loss (mg) 1.04 0.255 0.280 0.696 0.059
Weight loss (%) 13.23 3.75 4.28 11.11 1.05
3.2 Phase Analysis Fig. 2 shows the X-ray diffraction patterns of the as-mixmilled, calcined and sintered samples recorded at room temperature in the 2θ range of 10-70◦ . The d-spacings and relative intensities corresponding to the XRD peaks from the
as-mix-milled sample matched PDF # 70-292 for K2 CO3 and PDF # 27-1312 for Nb2 O5 labeled as ”K” and ”N” respectively which confirmed the presence of initial ingredients used in the present study. The XRD pattern of the (1x)KNbO3 .xP2 O5 (x = 0) sample, calcined at 850 ◦ C for 2 h, is shown in Fig. 2(b). The d-spacings and relative intensities corresponding to major XRD peaks matched PDF # 32-0822 for KNbO3 labeled as ”A” which revealed the formation of KNbO3 as a major phase; however, a couple of low-intensity peaks labeled as ”K” and ”N” matched PDF # 70-292 for K2 CO3 and PDF # 27-1312 for Nb2 O5 indicating incomplete reaction. Fig. 2(c) and (d) show XRD patterns recorded from the (1-x)KNbO3 .xP2 O5 (x = 0.03, x = 0.05) samples sintered at 1000 ◦ C and 1020 ◦ C respectively. The d-spacings and relative intensities corresponding to the major XRD peaks from (1-x)KNbO3 .xP2 O5 (x = 0.03) compositions sintered at 1000 ◦ C and (1-x)KNbO3 .xP2 O5 (x = 0.05) sintered at 1020 ◦ C matched the PDF # 32-0822 for KNbO3 labeled as ”A” which confirmed the occurrence of chemical reaction and hence the formation of KNbO3 phase. A number of low-intensity peaks marked as ”?” were also observed which could not be identified[26, 27, 28, 29]. Fig. 2(e) shows the XRD pattern recorded from the (1x)KNbO3 .xSiO2 (x = 0.1) sample sintered at 1020 ◦ C. The corresponding d-spacings and relative intensities of XRD peaks matched the PDF # 32-0822 for KNbO3 which confirmed the presence of KNbO3 phase. For this composition, the unknown peak disappeared, however, an additional lowintensity peak marked as ”S” appeared at 2θ = 29◦ which matched the PDF # 50-1431 for SiO2 . Additionally, the thermal treatment processes (such as calcination and sintering)
S. Ullah1,2,* et al.
4
caused the emergence of secondary phases labeled as ”B” (See Fig. 2(b-e)). The appearance of these peaks can be assigned to K3 NbO4 (PDF # 52-1894) originating from the slight changes in the stoichiometry due to volatile alkaline oxides during the sintering process.
3.3 Density measurement In the present work, the density of 3.07 g/cm3 was measured for the as-mixed-milled sample, which is 73.6 % of the theoretical density of KNbO3 [26]. The addition of 0.03 and 0.05 wt% P2 O5 resulted in the densification of the material and hence enhanced the density by about 11.35 and 14.55 % of that of the mixed-milled sample. In addition, to increasing x value, the observed increase in density was caused by the rise of sintering temperature from 1000 to 1020 ◦ C. Furthermore, the addition of 0.1 wt% SiO2 lowered the density to 2.8 g/cm3 (66.04 % of TD) which is reflected from the increase in grain size (See Sec. 3.4).
3.4 Microstructural Analysis Fig. 3 depicts the secondary electron SEM images (SEIs) recorded from the thermally etched, gold-coated surfaces of (1-x)KNbO3 .xSiO2 (x = 0.1). The microstructure comprised cubic and cuboidal grains with an average grain size of 3.76 µm and 3.86 µm along with agglomerates of fine grains in samples sintered at 1000 ◦ C and 1020 ◦ C for 2 h, respectively. Zhou et al.[34] reported that pure KNbO3 has an average grain size of 2.5 µm. Thus, the addition of SiO2 caused an increase in the grain size of KNbO3 ceramics which is evidenced by the reduction of the apparent density of the sample as commented above. The composition analysis was carried out using energy dispersive X-ray spectroscopy (EDS). EDS detected the presence of K and Nb only in cubic and cuboidal grains with no Si. The agglomerates of fine grains contained K, Nb, and a small amount of Si. The EDS analysis (see table 2) detected 29.47 wt% K and 70.53 wt% Nb in the cubic grain labeled as ”A”, and 29.29 K wt% and 71.71 wt% Nb in cuboidal grains labeled as ”C” (see Fig. 3(a,b)). Additionally, the agglomerates of fine grains marked as ”B” revealed 29.29 wt% Table 2 EDS-detected compositions of various grains.
Grains A B C D E F
Potassium (K %) 29.47 29.29 29.29 29.33 28.62 29.87
Niobium (Nb %) 70.53 69.09 71.71 70.67 65.28 71.13
Silicon (Si %) 1.62 6.10 -
Fig. 3 Scanning electron micrographs of thermally etched gold-coated surface of (1-x)KNbO3 .xSiO2 (x = 0.1) (a,b) sintered at 1000◦ C, showing the general microstructure grains of cubic and cuboidal morphology with an average grain size of 3.76 µ m along with agglomerates of fine grains. (c,d) sintered at 1020◦ C, showing same morphology with an average grain size of 3.86 µ m together with agglomerates of fine grains.
K, 69.09 wt% Nb and 1.62 wt% Si. In Fig 4(c,d), EDS detected 29.33 wt% K and 70.66 wt% Nb in the cubic grain labeled as ”D”, 29.87 wt% K and 71.13 wt% Nb in cuboidal grains labeled as ”F” and 28.62 wt% K, 65.28 wt% Nb and 6.10 wt% Si in agglomerates of fine grains labeled as ”E”. Furthermore, the EDS analysis of the white spot on regular shaped grain, marked by an arrow in Fig. 3(b), revealed 30.51 wt% K and 69.49 wt% Nb. The observed compositions in EDS analysis are consistent with XRD finding. The edges of the grains containing K, Nb, and Si appeared less sharp or diffused in comparison to those containing K and Nb only, indicating the inhomogeneous mixing of Si in the ceramic body.
3.5 Electrical properties Variation in εr and tanδ as a function of frequency for the (1x)KNbO3 .xP2 O5 (x = 0.03, 0.05) and (1-x)KNbO3 .xSiO2 (x = 0.1) samples, investigated at room temperature, are shown in Fig. 4. The dielectric constants and tanδ were observed to decrease with an increase in frequency as well as concentration of the sintering aids. This behavior can be attributed to various polarization effects. The observed εr decreased drastically with an increase in frequency while the tanδ first decreased and then increased abruptly with increasing frequency, indicating that the material behaved like a conductor at high frequencies[35]. KNbO3 single crystals are known to exhibit a dielectric constant of 137 and correspond to (111) and (100) planes, i.e., parallel to c-axis of its tetragonal unit cell[36]. In comparison to pure KNbO3 single crystals, the
Influence of P2 O5 and SiO2 addition on the phase, microstructure, and electrical properties of KNbO3
5
mation of an unknown secondary phase and promoted the densification of the material. The microstructure of the samples comprised cubic and cuboidal grains with an average grain size of 3.76 µm and 3.86 µm along with agglomerates of fine grains. The grain size increased slightly with an increase in sintering temperature. Dielectric constant and tanδ were observed to decrease with an increase in x value as well as frequency. Acknowledgements Authors greatly acknowledge the financial support from the Higher Education Commission (HEC) of Pakistan and laboratory support extended by MRL, Department of Physics, University of Peshawar, Pakistan. References
Fig. 4 (a) εr and (b) tanδ measured for (1-x)KNbO3 .xP2 O5 (x = 0.03, 0.05) and (1-x)KNbO3 .SiO2 (x = 0.1) as a function of frequency in the range from 1 MHz to 1 GHz.
compositions under investigation have large values of dielectric constants. The previously reported poor values have been attributed to the presence of potassium and oxygen vacancies as well as the strains produced in these crystals due to evaporation of potassium and oxygen[13]. Hsiang et al. [37] reported that electrical properties are density dependent. In the present work, the SiO2 -added composition was poorly densified and hence deteriorated the electrical properties.
4 Conclusions In conclusion, we investigated the effects of 0.03 and 0.05 wt% P2 O5 and 0.1 wt% SiO2 addition on the phase, microstructure and electrical properties of KNbO3 . The values of 81.95 and 84.3% of theoretical density were obtained for stoichiometric KN after sintering at 1000 and 1020 ◦ C for 2 h. The TG/DTA analysis of as-mixed-milled sample showed an overall weight loss of 33.4 wt% in the temperature range of 30-1200 ◦ C. The exothermic behavior, observed at about 795 ◦ C, revealed the beginning of crystallization. The addition of low content P2 O5 as a dopant resulted in the for-
1. Stefanovich SY, Sigaev VN, Lotarev SV, Lopatina EV, Mosunov AV, Segalla SG, and Chertin DP (2013) Functional Glass Ceramic Based on Potassium Niobate. Glass and Ceramics 70:135-140 2. Kim IS, Jung WH, Inaguma Y, Nakamura T, and Itoh M (1995) Dielectric properties of a-site deficient perovskite-type lanthanum-calcium-titanium oxide solid solution system [(1x)La23 TiO3−x CaTiO3 (0.1 ≤ x ≤ 0.96)]. Materials Research Bulletin 30:307-316 3. Iqbal Y, and Manan A (2012) Phase, microstructure and microwave dielectric properties of Zr-doped SrLa4 Ti5−x Zrx O17 . J Mater Sci: Mater Electron 23:536-541 4. Sen C, Alkan B, Akin I, Yucel O, Sahin FC, and Goller G (2011) Microstructure and ferroelectric properties of spark plasma sintered Li substituted K0.5 Na0.5 NbO3 ceramics. J. Ceram. Soc. Japan 119:355-361 5. Hertling GH (1999) Ferroelectric Ceramics: History and Technology. J. Am. Ceram. Soc. 82:797-818 6. Jaffe H (1958) Piezoelectric Ceramics. J. Am. Ceram. Soc. 41:494-498 7. Wu SY, Zhang W, and Chen XM (2010) Formation mechanism of NaNbO3 powders during hydrothermal synthesis. J Mater Sci: Mater Electron 21:450-455 8. Ringgaard E, and Wurlitzer T (2005) Lead-free piezoceramics based on alkali niobates. J. Euro. Ceram. Soc. 25:2701-2706 9. Shrout TR, and Zhang SJ (2007) Lead-free piezoelectric ceramics: Alternatives for PZT? J Electroceram 19:113-126 10. G¨unter P (1974) Electro-optical properties of KNbO3 . Optics Communications 11:285-290 11. Uematsu Y (1974) Nonlinear Optical Properties of KNbO3 Single Crystal in the Orthorhombic Phase. Jpn. J. Appl. Phys. 13:13621368 12. G¨unter P (1982) Holography, coherent light amplification and optical phase conjugation with photorefractive materials. Physics Reports 93:199-299 13. Sim˜oes AZ, Ries A, Riccardi CS, Gonzalez AH, Zaghete MA, Stojanovic BD, Cilense M, and Varela JA (2004) Potassium niobate thin films prepared through polymeric precursor method. Materials Letters 58:2537-2540 14. Maeder MD, Damjanovic D, and Setter N (2004) Lead Free Piezoelectric Materials. J. Electroceram. 13:385-392 15. Saito Y, Takao H, Tani T, Nonoyama T, Takatori K, Homma T, Nagaya T, and Nakamura M (2004) Lead-free piezoceramics. Nature 432:84-87
6 16. Egerton L, and Dillon DM(1959) Piezoelectric and Dielectric Properties of Ceramics in the System Potassium-Sodium Niobate. J. Am. Ceram. Soc. 42:438-442 17. Magrez A, Vasco E, Seo JW, Dieker C, Setter N, and Forr L (2006) Growth of Single-Crystalline KNbO3 Nanostructures. J. Phy. Chem. B 110:58-61 18. Liu JF, Li XL, and Li YD (2003) Synthesis and characterization of nanocrystalline niobates. Journal of Crystal Growth 247:419-424 19. Jaeger RE, and Egerton L (1962) Hot Pressing of PotassiumSodium Niobates. J. Am. Ceram. Soc. 45:209-213 20. Wang R, Xie R, Sekiya T, Shimojo Y, Akimune Y, Hirosaki N, and Itoh M (2002) Piezoelectric Properties of Spark-Plasma-Sintered (Na0.5 K0.5 )NbO3 PbTiO3 Ceramics. Jpn. J. Appl. Phys. 41:71197122 21. Reisman A, Holtzberg F, Triebwasser S, and Berkenblit M (1956) Preparation of Pure Potassium Metaniobate. J. Am. Chem. Soc. 78:719-720 22. Zuo R, R¨odel J, Chen R, and Li L (2006) Sintering and Electrical Properties of Lead-Free Na0.5 K0.5 NbO3 Piezoelectric Ceramics. J. Am. Chem. Soc. 89:2010-2015 23. Gao D, Kwok KW, Lin D, and Chan HLW (2009) Microstructure, electrical properties of CeO2 -doped (K0.5 Na0.5 )NbO3 leadfree piezoelectric ceramics. Journal of Materials Science 44:24662470 24. Yang MR, Tsai CC, Hong CS, Chu SY, and Yang SL (2010) Piezoelectric and ferroelectric properties of CN-doped K0.5 Na0.5 NbO3 lead-free ceramics. J. Appl. Phys. 108:094103-094108 25. Su S, Zuo R, Wang X, and Li L (2010) Sintering, microstructure and piezoelectric properties of CuO and SnO2 co-modified sodium potassium niobate ceramics. Materials Research Bulletin 45:124128 26. Makovec D, Priboˇaiˇc I, and Drofenik M (2008) TiO2 as a sintering additive for KNbO3 ceramics. Ceramics International 34:89-94 27. Hao J, Xu Z, Chu R, Zhang Y, Li G, and Yin Q (2009) Effects of MnO2 on phase structure, microstructure and electrical properties of (K0.5 Na0.5 )0.94 Li0.06 NbO3 lead-free ceramics. Materials Chemistry and Physics 118:229-233 28. Alkoy EM, and Papila M (2010) Microstructural features and electrical properties of copper oxide added potassium sodium niobate ceramics. Ceramics International 36:1921-1927 29. Kosec M, and Kolar D (1975) On activated sintering and electrical properties of NaKNbO3 . Materials Research Bulletin 10:335-339 30. Acker J, Kungl H, and Hoffmann MJ (2010) Influence of Alkaline and Niobium Excess on Sintering and Microstructure of SodiumPotassium Niobate (K0.5 Na0.5 )NbO3 . Journal of the American Ceramic Society 93, 1270-1281 31. Chaiyo N, Ruangphanit A, Muanghlua R, Niemcharoen S, Boonchom B, and Vittayakorn N (2011) Synthesis of potassium niobate (KNbO3 ) nano-powder by a modified solid-state reaction. Journal of Materials Science 46:1585-1590 32. Huang T, Chang YS, Chen GJ, and Chang YH (2007) Preparation and structures of the La1−x Kx Co1−x Nbx O3 (x = 0-l) system. Journal of Alloys and Compounds 430:205-211 33. Ko JB, and Hong J H, (2010) Structural and thermal properties of potassium niobiate glasses for an application in electro-optical product design and manufacture. J. Ceram. Process. Res 11:116119 34. Zhou H, Zheng S, Zhang Y (2004) A new way of synthesis of nonlinear optical potassium niobate powder. J. Mater. Sci 39, 43594361 35. Mansour SF (2005) Frequency and Composition Dependence on the Dielectric Properties for Mg-Zn Ferrite. Egypt. J. Solids 28:263-273 36. Rou SH, Hren PD, Hren JJ, Graettinger TM, Ameen MS, Auciello OH, and Kingon AI (1990) High Resolution Imaging of Twin and Antiphase Domain Boundaries in Perovskite KNbO3 Thin Films. MRS Proceedings 183:285-290
S. Ullah1,2,* et al. 37. Hsiang HI, Hsi CS, Huang CC, and Fu SL (2008) Sintering behavior and dielectric properties of BaTiO3 ceramics with glass addition for internal capacitor of LTCC. Journal of Alloys and Compounds 459:307-310