INTERNATIONAL JOURNAL OF GEOMATICS AND GEOSCIENCES Volume 2, No 2, 2011 © Copyright 2010 All rights reserved Integrated Publishing services
Research article
ISSN 0976 – 4380
Integrated approach using Remote Sensing and GIS techniques for delineating groundwater potential zones in Dwarakeswar watershed, Bankura distict, West Bengal
Nag.S.K 1 , Anindita Lahiri 2 1 Department of Geological Sciences, Jadavpur University, Kolkata 700032 2 Research Fellow under UGC Meritorious Scheme, Department of Geological Sciences, Jadavpur University
[email protected] ABSTRACT Today all water resource development processes in most of the countries are based on micro watershed planning. Micowatershed is the smallest area, which acts as a comprehensive unit in the hydrological environment. For sustainable development of water resources, all planning should be based on the character of the hydrological environment of the watershed. In the study area, the geological formation consisting of quartz, schist, slate show a fine texture of drainage pattern which indicate a high potential for groundwater occurrence. In general the slope is greater than 30 0 thereby indicating more runoff and less infiltration. Lineaments, hydrogeomorphology and slope are the key parameters in the groundwater occurrence in the Dwarkeswar watershed. The lineaments mapped from satellite images cut across slope categories and litho units, thereby indicating the possibility of acting as major conduits for subsurface movement and linear aquifers for the storage of water. The central and southern part of the watershed areas provide good prospect for groundwater. It has been observed in the field and from the groundwater potential map that the gentler slope has more prospects for groundwater. Lineament density, lithology and drainage texture act as complementary conditions for gentler slopes. Keywords: Remote Sensing and GIS, Groundwater Potential zone, Hydrogeomorphology, Lineaments, Slope, Dwarkeswar watershed. 1. Introduction Water is one of the most precious gift with which nature has blessed mankind. Water is absolutely vital for the sustenance and maintenance of life. The everincreasing population and the need for security, it is realized that the water and land resources need to be developed , used and managed in an integrated and comprehensive manner. The high spatial resolution remotely sensed data coupled with topographical data analysis procedures have highly effective toll to understand and manage the natural resources. It provides the real time and accurate information related to distinct geological formation, landforms and helps in identification of drainage channels, which are altered by natural forces of human activities. GIS is an effective tool to analyze spatial and nonspatial data on drainage, geology, landforms parameters to understand their interrelationship. The concept of integrated Remote sensing and GIS has proved to be an indispensable tool in integrating urban planning and groundwater studies. Hydrogeomorphological studies coupled with hydrogeological and structural/lineament have proved to be very effective tool in discerning groundwater potential zones. Many workers in different parts of the world have followed different techniques for generating thematic maps on geology, hydrogeology, integrating the data to select favourable
Submitted on September 2011 published on November 2011
430
Integrated approach using Remote Sensing and GIS techniques for delineating groundwater potential zones in Dwarakeswar watershed, Bankura distict, West Bengal Nag.S.K , Anindita Lahiri
sites for groundwater recharge (Johnson and Sneigocki, 1967; Vecchioli et. al., 1974, Weston and Swain, 1979. In the present study , an attempt has been made to identify the groundwater potential zones in the Dwarakeswar Watershed based on remote sensing and GIS techniques. The groundwater prospect mapping is a systematic effort and has been prepared considering major controlling factors , that influence the water yield and quality of groundwater. The map depicts hydrogeomorphological aspects, which are essential basis for planning and execution of groundwater exploration. The derived information, depicted in the form of a prospect map would provide first hand information to local authorities and planners about the areas suitable for searching groundwater followed by its suitable exploration. 2. Study Area The study area comprises of Precambrian crystalline and recently deposited alluvium connected by an intervening tract. The Dwarkeswar watershed with a semielliptical shape occupies the Kashipur block which is situated in northeastern part of Puruliya district, but the major part of the Dwarkeswar watershed is situated in a part of Chhatna block of Bankura district of West Bengal state, India. The Dwarkeswar watershed is bounded by longitudes 860 51¢ E and 870 00¢ E and latitudes 230 16¢ N to 230 50¢ N. (Figure1) and is covered in the Survey of India Toposheet numbers 73 I/11, 73 I/15 and 73 I/16 on 1:50,000 scale The Dwarkeswar watershed lies in between the Damodar basin (to
Figure 1: Map of the Study area alongwith drainage network the north) and Kangsabati basin (to the south). The Dwarkeswar river is one of them largest river which rises in the hilly terrain of Puruliya district and flows from northwest to south east, almost dividing the Chhatna Block into two equal halves. The Dwarkeswar flows east upto Kashipur and then South east from 86 0 44 / E. where it receives the Bekon Nala flowing east south east. The other left bank tributary Dangra Nala has scissored the undulating surface into mesh of gully before entering the Bankura district as the Kumari Nala .The right bank tributaries of the Dwarkeswar river are the Futuari Nala flowing north east, Dudhbhaiya Nala flowing north and Arkasa Nala flowing east the last two having their sources near Hura International Journal of Geomatics and Geosciences Volume 2 Issue 2, 2011
431
Integrated approach using Remote Sensing and GIS techniques for delineating groundwater potential zones in Dwarakeswar watershed, Bankura distict, West Bengal Nag.S.K , Anindita Lahiri
block. The Arkasa turn north east in Bankura district where from its confluence, the Dwarkeswar river becomes a perennial stream. Dwarkeswar river and all above mentioned tributaries dry up during the cold and hot seasons. Gully erosion all along their channels is a very conspicuous feature. In its lower course the Dwarkeswar river is known as Rupnarayan. 2.1 Data Used and Methodology In the present paper, the database used for the study purpose includes: 1. Contour data of Survey of India Topographical map No. 73I/11,73I/15 and 73I/16 2. Drainage data of Survey of India Topographical map No. 73I/11,73I/15 and 73I/16 3. Geological map of the study area 4. Indian Remote Sensing (IRS P6 L3 10655, IRS P6 L3 10755) data to identify different hydrogeomorphological units, mapping of lineaments; these data were collected and registered to Survey of India topographical sheets at 1:50,000 scale. These satellite images have been georeferenced and merged using TNT mips 7.4 version Image Processing Software and contour maps have been prepared by using SURFER 7.0 version. 5. Lineaments and Lineament Density studies from Satellite imagery. 6. Digital Elevation Modeling 7. GIS overlay to find suitable zonation for groundwater potential. 3. Results and Discussion Today all water resource development processes in most of the countries are based on micro watershed planning. Microwatershed is the smallest area, which acts as a comprehensive unit in the hydrological environment. For sustainable development of water resources, all planning should be based on the character of the hydrological environment of the watershed. Groundwater resources are dynamic in nature as they are affected by various human activities, including the expansion of cultivated and irrigated lands, industrialization, urbanization and others. Because it represents the largest available source of fresh water lying beneath the ground it has become crucial not only for targeting of groundwater potential zones, but also monitoring and conserving this important resource. 3.1 Hydrogeomorphology The drainage basin is a fundamental geomorphic unit and the watershed acts as a source area for precipitation that eventually provide to the stream channels by various path. The drainage basin morphology being an important aspect of geomorphic analysis has been undertaken in the present context to determine the various properties of form elements, their distributional variation, interrelationship, determination of correlation coefficients and sets of highly correlated variables and other multivariate relationship as it throws light on the rate of the fluvial erosion processes operating under varied physical condition. Remote sensing studies provide an opportunity for better observation and more systematic analysis of various hydrogeomorphic units / landforms / lineaments, features following the International Journal of Geomatics and Geosciences Volume 2 Issue 2, 2011
432
Integrated approach using Remote Sensing and GIS techniques for delineating groundwater potential zones in Dwarakeswar watershed, Bankura distict, West Bengal Nag.S.K , Anindita Lahiri
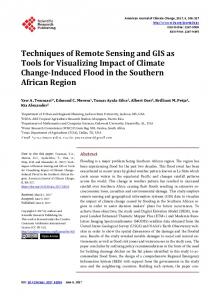
synoptic, multispectral repetitive coverage of the terrain (Horton, 1945; Kumar and Srivastava, 1991; Sharma and Jugran, 1992; Chatterjee and Bhattacharya, 1995; Tiwari and Rai, 1996). The geomorphic evolution of the hard rock terrain is controlled by mainly tectoniclithologic features and denudation processes. A number of landforms have been identified in this terrain using IRS 1C LISS III image (Fig 2). All the landform units of the terrain have been interpreted and delineated using IRS imagery on 1: 50,000 scale and have been grouped as follows: 3.1.1 Structural and denudation hill (SDH) Erosional remnants of Chotanagpur plateau and intermittent valleys, steep to moderately steep, rounded to sharp crest; lithology comprising different variants of CGC with enclaves of metasedimentaries; moderately dissected, parallel to subparallel drainage, dark grayish brown loamy skeletal to rocky dark brown, shallow to deep, fine loamy soil based on slope. 3.1.2 Buried pediments (BPM and BPS) and dissected pediment These landforms are erosional geomorphic features and have developed by the processes of weathering of hills, having a thin veneer of deposition adjacent high relief outcrop. If the pediments are covered by alluvium or weathered material, they are formed buried pediments. These buried pediments with thick overburden (5 ~ 10 m) are potential sites for groundwater prospecting. They are known as Buried Pediment Moderate (BPM). There are also buried pediments with thin overburden (0 ~ 5 m) on the study area. These are known as Buried Pediment Shallow (BPS) and Buried Pediment Moderate (BPM). BPS is less potential site for groundwater prospecting than BPM. The buried pediments are found almost in the whole area while BPM have dark greenish gray tone in FCC and BPS have light yellow tone.
3.1.3 Valley fills (VF) The unit has been demarcated on the basis of its typical flatness, smooth texture, drainage pattern etc. The river valley in the plantation surface exhibits features of matured flood plains. An extremely low gradient of the plain has helped to form a sluggish course of rivers. Infilled valleys have dark tone in FCC. The unit is good potential site for groundwater prospecting. The present study emphasizes the use of satellite remote sensing for classifying the hydrogeomorphological omits of the area. Hydrogeomorphologically the entire area is classified into following categories such as(i) Valley fills (ii) Buried pediment moderate (iii)Buried pediment shallow and (iv) Denudational Hill / Incelberge. Their characteristic features and groundwater potentiality are given in Table 1. Hydrogeomorphological mapping is an integrated, applied geoscientific approach for groundwater prospecting zonation. In the present study hydrogeomorphological map has been prepared using Remote Sensing data (IRS1C LISS III P6 L3 10655, IRS1C LISS III P6 L3 10755) and classified in different zones covered by denudation / structural hills, buried pediments (shallow and moderate), valley fills and alluvial plain.
International Journal of Geomatics and Geosciences Volume 2 Issue 2, 2011
433
Integrated approach using Remote Sensing and GIS techniques for delineating groundwater potential zones in Dwarakeswar watershed, Bankura distict, West Bengal Nag.S.K , Anindita Lahiri
86 0 35 /
23 0 30 /
86 0 40 /
86 0 45 /
86 0 50 /
86 0 55 /
23 0 30 /
23 0 25 /
23 0 25 /
23 0 20 /
23 0 20 /
23 0 15 / 23 0 15 /
86 0 35 /
86 0 40 /
86 0 45 /
86 0 50 /
86 0 55 /
Figure 2: Hydrogeomorphological Map of the Study Area. Table 1: Hydrogeomorphological units and their characteristics features Geomorphic Units
Description
Soil characteristics and existing land use / land cover
Water Prospects
Accumulation zone of colluvial Moderately deep to deep, fine textured materials derived from moderately well drained soils. Moderate Valley Fills surrounding uplands; shallow to Good limitation of wetness. Single crop mainly deep; fine loamy to clayey terrace cultivation. soils. Moderately deep to deep, fine textured loamy Buried Gently sloping topography; skeletal to coarse loamy soil. Single crop area Pediment very deep, clayey to fine loamy Moderate with marginal ‘rabi’ crops. Medium (Medium) soils. productive potential Very shallow to shallow coarse textured soil Nearly flat to gently sloping with occasional weathered outcrops of Buried topography, shallow to country rocks. Wastelands with or without Pediment Poor moderately deep, loamy soils scrub. (Shallow) Shallow to moderately deep, loamy skeletal followed by regolith zone. soil. Single crop area low productive potential Very shallow, coarse loamy soil on moderately steep to very steep hill slopes and Denudational Broad uplands of considerable escarpments having different degrees of elevation, steeply sloping on all hardness. Open to dense forest and plantation. Poor Hill / Inselberg directions . Not suitable for agriculture / pasture / orchards.
International Journal of Geomatics and Geosciences Volume 2 Issue 2, 2011
434
Integrated approach using Remote Sensing and GIS techniques for delineating groundwater potential zones in Dwarakeswar watershed, Bankura distict, West Bengal Nag.S.K , Anindita Lahiri
Amongst these, alluvial plain and valley fills are favourable zones for groundwater exploration. They are mainly consisting of sand, silt and unconsolidated sediments, shale with limestone bands. Pediments and buried pediments are moderately favorable zones while rest of the area is not suitable for groundwater exploration as they are the poor zones for the groundwater potential (Figure 2). 3.2 Lineaments Studies Lineaments are natural, linear surface elements, interpreted directly from satellite imagery. Lineament analysis using satellite imageries has an advantage in that a regional area can be investigated synoptically with high accuracy. Lineaments usually appear as straight lines or “edges” on the images which in all cases are contributed by the tonal difference within the surface material. Lineaments are evaluated in order to extract further information on the distribution and nature of the lineaments. In the hard rock areas, the movement and occurrence of groundwater depends mainly on the secondary porosity and permeability resulting from folding, faulting, fracturing etc. The most obvious structural features that are important from the groundwater point of view are the lineaments. The remote sensing data which offer synoptic view of large area, helps in understanding and mapping the lineaments both on regional and local scale. The lineament analysis of the area from remotely sensed data provides important information on subsurface fractures that may control the movement and storage of groundwater. The remote sensing data offers a synoptic view of a large area and aids in understanding and mapping the lineaments both on regional and local scale. By visually interpreting the satellite imagery, the lineaments of the study area are picked up and traced on the basis of tonal, textural, soil tonal, vegetation, topographic and drainage linearity, curvilinear ties and rectilinear ties (Lillesand 1989, Drury 1990, Gupta 1991).In the study area, major lineaments are identified (Figure3.) from the satellite data interpretation, which are surface manifestation of some structural features in the bedrock as fracture and joints developed due to tectonic stress and strain . The lineaments identified in structural hills, pediments and valley fill zones in the study area are controlling the river channels. In the study area lineaments trend is towards northwest to southeast. 3.3 Lineament Density The lineament analysis of the area from remotely sensed data provide important information on subsurface fractures that may control the movement and storage of groundwater. To determine the lineament density in the study area the total study area is subdivided in a number of grids of dimension 1 km x 1 km. Density of the lineaments of a single grid is obtained from the values of the total length of the lineaments in a single grid (SL). Calculation of the density of the lineaments in the area involves the ratio of SL to A. By calculating the value of SL/A for each grid and locating the value at the centre of that grid the density of the lineaments of the study area is calculated. These values are joined by isolines to prepare a lineament density map using TNT mips version 74 software. Lineaments provide important clues on subsurface structures that may control the movement and storage of groundwater. Good to moderate prospects depending on nature and intensity of lineaments and lineament intersection density. The peaks in the lineament density and lineament intersection density contour maps are the places of interest for groundwater resource development In the present study the high values of lineament density are found to be present in the Central and eastern part of the study area.In the north west and south eastern International Journal of Geomatics and Geosciences Volume 2 Issue 2, 2011
435
Integrated approach using Remote Sensing and GIS techniques for delineating groundwater potential zones in Dwarakeswar watershed, Bankura distict, West Bengal Nag.S.K , Anindita Lahiri
part of the study area also the lineament density is moderately high, low lineament is found in northern and southern part the of the study area.(Figure4) 23 0 30 /
86 0 35 /
86 0 40 /
86 0 45 /
86 0 50 /
86 0 55 /
23 0 30 /
23 0 25 /
23 0 25 /
23 0 20 /
23 0 20 /
23 0 15 /
23 0 15 /
86 0 35 /
86 0 40 /
86 0 45 /
86 0 50 /
86 0 55 /
Figure 3: Lineament map of the Study area 0
23 0 30 /
/
86 35
86 0 40 /
86 0 45 /
86 0 50 /
86 0 55 /
23 0 30 /
23 0 25 /
23 0 25 /
23 0 20 /
23 0 20 /
23 0 15 /
23 0 15 /
86 0 35 /
86 0 40 /
86 0 45 /
86 0 50 /
86 0 55 /
Figure 4: Lineament Density Map of the Study Area.
International Journal of Geomatics and Geosciences Volume 2 Issue 2, 2011
436
Integrated approach using Remote Sensing and GIS techniques for delineating groundwater potential zones in Dwarakeswar watershed, Bankura distict, West Bengal Nag.S.K , Anindita Lahiri
4.3.1 Digital Elevation Model (Dem) A DEM is digital representation of continuous variation of topographic surface with the elevation or ground height above any geodetic datum. In the present study, the technique used for creating the DEM is interpolation of contours. The contours at 20 metre interval were traced out from the topographic map and were digitized, edited and rasterised using TNT mips 7.4 version Image Processing Software and later imported to then SURFER 7.0 version software for generating the DEM (Figure 5)
Figure 5: Digital Elevation Modelling of the Study Area. 23 0 30 / 23 0 30 / 23 0 25 / 23 0 25 / 23 0 20 / 23 0 20 / 23 0 15 / 23 0 15 /
86 0 35 /
86 0 40 /
86 0 45 /
86 0 50 /
86 0 55 /
Figure 6: Slope map of the study area.
International Journal of Geomatics and Geosciences Volume 2 Issue 2, 2011
437
Integrated approach using Remote Sensing and GIS techniques for delineating groundwater potential zones in Dwarakeswar watershed, Bankura distict, West Bengal Nag.S.K , Anindita Lahiri
3.4 Slope A slope map of the study area was prepared from a contour map drawn from 1:50,000 scale topographic sheets of the Survey of India . The slope classes includes class1(08), class2 (8 15), class3 (1525) and class4 (2530). Class1 is very gentle slope, class 2 is gentle slope and class3 is moderate ,class4 is steep slope. Slope plays significant role in infiltration vs. runoff. Infiltration is inversely related to slope, i.e. more gentle the slope, infiltration would be more runoff would be less and vise –versa. (Figure6) 3.5 GIS and Overlay Analysis A d ir ect co nsequence o f int egrat ed geo invest igation approach has been the realization of the Geographic Information System (GIS). A GIS is an 'automated tool for efficient storage, analysis and presentation' of geographically referenced data'. It aims at storage and retrieval of all types of data at a particular location in space. In a comprehensive sense, GIS means identifying data needs acquisition of data, management, processing and decision making (Gupta, 1991,Sarkar et.al 2001). In normal usage it means facilitating the creation and use of information. 3.5.1 Data Layer Generation In the present study, various thematic maps namely, drainage, lineament, lithology. slope and landuse have been generated using Survey of India's Topographic map No. 73I/11, 73I/15 and 73I/16. The landuse and lineament layers have been generated using S a t e l l it e images and Topographic maps. While the drainage and contour were generated using the Topographic maps, the slope layer has been generated from DEM through contours. 3.6 Ground Water Potential Zone Weighted overlay analysis is a simple and straightforward method for a combined analysis of multiclass maps.The efficacy of this method lies in that human judgement can be incorporated in the analysis. A weight represents the relative importance of a parameters vis avis the objective. Weighted index overlay method takes into consideration the relative importance of the parameters and classes belonging to each parameter. There is no standard scale for a simple weighted overlay method. For this purpose, criteria for the analysis should be defined and each parameter should be assigned importance (Saraf and Chowdhury, 1997 and Saraf and Chowdhury, 1998, Nag 2005). Determination of Weightage of each class is the most crucial in integrated analysis, as the output is largely dependent on the assignment of appropriate weightage.consideration of relative importance leads to a better representation of the actual ground situation (Choudhury,1999). Considering the hydrogeomorphic conditions of the area weighted indexing has been adopted (Table 2) to delineate groundwater prospective Zones (Figure7) considering three parameters namely geomorphology, slope, lineaments. Table 2: Weightage of different parameters for Groundwater prospects Serial Criteria No.
Classes
International Journal of Geomatics and Geosciences Volume 2 Issue 2, 2011
Weights For Groundwater 438
Integrated approach using Remote Sensing and GIS techniques for delineating groundwater potential zones in Dwarakeswar watershed, Bankura distict, West Bengal Nag.S.K , Anindita Lahiri
1. Hydrogeomorphology 2.
Lineament density
3.
Slope
23 0 30 /
86 0 35 /
Valley fills Burried Pediment Moderate Burried Pediment Shallow Incelberge 34 23 12