International Journal of Information Science and Intelligent System,
3(2): 131-152,
2014
Integrated Data Mining Techniques in Enterprise Resource Planning(ERP) Systems Mohammed K. Kolkas∗, Hazem M. El-Bakry, Ahmed A. Saleh Information Systems Dept.,Faculty of Computer Science and Information Systems,Mansoura University Mansoura,Egypt
Received: 26 December 2013; Accepted: 20 February 2014
Abstract Enterprise Resource Planning (ERP) is an environment which is often rich of data about the enterprise. Data warehouse online analytical processing techniques provided decision makers a set of useful tools to analyze report and graphically represent data of the ERP. It can be said that OLAP tools provides different summarized perspectives of the data. On the other hand, Data Mining techniques can discover previously unknown patterns of knowledge. It can be said that data mining provides a deeper look in the data. This paper provides a comparison and case-study of benefits obtained by applying OLAP or data mining techniques and the effect of integrating the both approaches in ERP.
Keywords: Data mining; Enterprise resource planning; Business intelligence. ©Martin Science Publishing. All Rights Reserved.
1. Introduction Enterprise Resource Planning (ERP) is a set of applications for core business operations and back-end management that was originally developed for manufacturing and commercial companies . The most significant factor that distinguishes ERP systems from previous generations of information systems such as MRP (Material Requirement Planning) that ERP permits ∗
Corresponding author. Tel.:02-050-2223743 E-mail address:
[email protected] (Mohammed K. Kolkas).
132
M. K. Kolkas, et al / International Journal of Information Science and Intelligent System
(2014)
organizations to integrate business processes and optimize the resources available . The central transactional database of the ERP offers a rich source of data to apply analytical processing activities to gain benefits of ERP data. These analytical activities include Online Analytical Processing (OLAP) and Data Mining. Both OLAP and Data Mining approaches have different applications for business information systems such as ERP. In most cases, OLAP and data mining approaches are applied separately to accomplish different tasks in business applications . In the following sections, applications of OLAP and data mining on the different components of ERP systems are identified and listed for comparison. The comparison illustrates that, tasks to be performed using OLAP and data mining in ERP system components are different but yet can be integrated to accomplish new tasks. The rest of paper is organized as follows. Historical revision is given in section 2, Business Intellegence and Data Warehousing are described in section 3. Business intelligence using Data Mining is discussed section 4, Data Mining in ERP Systems is presented in section 5, Data Mining and Knowledge Discovery are introduced in section 6, Oracle E-Business Suite R12 (ERP) presented in section 7, Conclusions and Future work are given in section 8
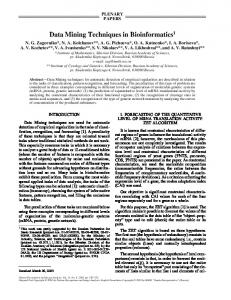
2. Historical Revision The idea of ERP systems is initially started by the development of Material Requirements Planning (MRP) systems to handle the planning and schedule of complex products . On next stages, MRP systems are developed to include some operational areas of the enterprise such as (sales, operation planning and financials). Finally, ERP systems are developed to integrate all business functions of an enterprise to support decision making . Fig. 1 shows modules of a typical ERP.
Figure 1. Modules of a typical ERP
M. K. Kolkas, et al / International Journal of Information Science and Intelligent System
(2014)
133
Some common vendors of ERP systems are SAP, ORACLE, Microsoft, and PeopleSoft. Being established in 1972, SAP Company is one of the oldest ERP system providers around world . In 2004, SAP released the first release of NetWeaver (SAP business intelligence application) . NetWeaver business intelligence applies OLAP techniques and four data mining techniques (Decision Tree, Scoring, Clustering, and Association) . NetWeaver, applies each business intelligent technique separately with no ability of integration. In this paper, I integrates between OLAP and data mining techniques in order to answer customer requirements that cannot be answered by applying OLAP or data mining separately.
3. Business Intelligence and Data Warehousing Business Intelligence is providing decision makers with valuable information and knowledge by leveraging a variety of sources of data as well as DFD Structured and unstructured information. . The information and data could reside within or outside the organization, could be structured in different ways, and could be either quantitative or qualitative. In some instances, this activity may reduce to calculations of totals and percentages, graphically represented by simple histograms, whereas more elaborate analyses require the development of advanced optimization and learning models. Traditional Database systems do not satisfy the requirements of data analysis necessary for BI. They are optimized to support the daily operations of an organization and their primary concern is to ensure the fast access of data in the presence of multiple users, such as ERP system’s database . Data warehouses are used as a data source for On-line analytical processing (OLAP) and machine learning . Fig.2 , shows a typical architecture of business intelligence and data sources to create data warehouse to apply OLAP and data mining. A data warehouse is a collection of subject-oriented, integrated, non-volatile, and time-variant data to support decision making and BI . In large data warehouse environments, many different types of analysis can occur. Data warehouse can be enriched with advance analytics using OLAP (On-Line Analytic Processing) and data mining. Rather than having a separate OLAP or data mining engine, they can also be integrated.
Figure 2. A Typical architecture of business intelligence and data sources to create data warehouse to apply OLAP and data mining.
134
M. K. Kolkas, et al / International Journal of Information Science and Intelligent System
(2014)
4. Business Intelligence Using Data Mining Data Mining is the process of exploration and analysis to discover meaningful correlations, patterns and trends by sifting through large amounts of data stored in repositories.On the most important applications targeted by Data Mining is Business Intelligence. Using data mining, businesses may be able to perform effective market analysis, compare customer feedback, identify similar products, retain highly valuable customers and make smart business decisions. Data Mining uses many several predictive and statistical methods in order to explore and analyze data. Such methods include association rule, linear regression, neural networks, regression trees, cluster analysis and classification trees. Figure 3 shows the Cross-Industry Standard Process of Data Mining (CRISP-DM) defines six standard phases for DM process.
Figure 3. The Cross-Industry Standard Process of Data Mining (CRISP-DM). Operations that can be accomplished by data mining are categorized in the following classes listed in Table 1. Table 1. Common operations performed by data mining. Anomaly detection Association rule learning Clustering Classification Regression Summarization
(Outlier/change/deviation detection) - The identification of unusual data records that might be interesting or data errors and require further investigation. (Dependency modeling) – Searches for relationships between variables. For example a supermarket might gather data on customer purchasing habits. The task of discovering groups and structures in the data that are in some way or another "similar", without using known structures in the data. The task of generalizing known structure to apply to new data. For example, an email program might attempt to classify an email as legitimate or spam. Attempts to find a function which models the data with the least error. Providing a more compact representation of the data set, including visualization and report generation.
M. K. Kolkas, et al / International Journal of Information Science and Intelligent System
(2014)
135
Oracle Daily Business Intelligence for HRMS. Oracle Daily Business Intelligence (DBI) for HRMS is an interactive, self-service management reporting tool for executives and managers whose responsibilities include all aspects of human resources management, including HR, compensation and benefits, payroll, recruitment and learning. It offers enhanced visibility of factors influencing workforce effectiveness by providing enterprise-wide performance information daily. It enables line managers and HR professionals to identify potential issues as they emerge, and address them before they escalate into real problems. DBI is part of the Oracle E-Business Suite, an integrated set of applications, which is designed to transform your business into an e-business. Understand And Improve Workforce Performance The workforce is the most volatile of business resources, subject to change imposed by economic cycles, demographics, work-life balance, and ever-increasing legislation. Oracle Daily Business Intelligence for HRMS provides top down enterprise metrics and analytics for any line manager conducting people management activities. DBI for HRMS is a comprehensive reporting solution that provides detailed trend and point in time analysis of the movements of people and salaries against budgets, enabling each manager to exert a tight control on people costs throughout the reporting line. Using DBI for HRMS, managers have rich, integrated and up to the day information to understand and anticipate trends, and to intervene when workforce capacity will fall short of demand. DBI for HRMS provides a collection of workforce management indicators, daily aggregated information with actionable details and trends, as well as multi-dimensional analysis and period to date comparisons. It provides key metrics for tracking trends, changes and exceptions in employee turnover, salary levels and headcount against allocated budgets (see Figure. 4). It compares HRMS measures, as absolute totals and as changes, for a period-to-date against the previous period or the previous year. By enabling both the date of the view and the duration of the period over which data is displayed to be selected, the user can focus on a particular period in time, for instance to look at seasonal changes, or can look at macro changes occurring over longer periods of time. Track Critical HRMS Information on a global basis DBI for HRMS personalizes the content displayed to any line manager by aggregating and presenting information based on the users position within their reporting hierarchy. Managers can view data aggregated for all people for which they have responsibility, and drill to any level of the hierarchy to pinpoint problems. This approach ensures that the manager sees only the information that is directly relevant to their objectives, and is prevented from seeing secure information outside their reporting line. DBI for HRMS has no geographic boundaries: todays global manager frequently controls staff in multiple locations. DBI consolidates metrics and converts financial metrics to enable statistics to be rolled up into a single global picture, as well as being split by country to allow for regional differences. Investigate Changes In Workforce Headcount
136
M. K. Kolkas, et al / International Journal of Information Science and Intelligent System
(2014)
The sheer variation of todays workforce in terms of working hours, short-term and part-time working, and time-off arrangements means that keeping track of the capacity of employees to perform work, expressed in terms of headcount or a % of full-time work, is critical. Equally, people must be deployed very rapidly to meet new opportunities, or have changed working conditions applied when demand ceases. Local economic changes, such as a new competitor in the region, or spiraling salaries, can also drive rapid changes in workforce behavior, such as increases in salary demands and voluntary terminations. Such changes demand an ability to conduct detailed and accurate accounting of the workforce. The business also needs to be able to detect patterns of change, usually by workforce movements such as voluntary turnover.
Figure 4. Understand how trends in employee movements will impact workforce capacity DBI for HRMS uses the information stored in Oracle Human Resources, to take into account policies regarding the count applied to part-timers or suspended staff, so that FTE (full time equivalent) policies or headcount based accounting can be used. In this way it achieves highly accurate, up to the day totals that exactly meet your business practices. The headcount metrics displayed show start and end totals throughout the management hierarchy, as well as the totals and % changes due to transfers into and out of each managerيs control throughout the period. Figure. 5 The user can drill at any level of the hierarchy to see line-by line detail behind the statistics. For instance, a termination total enables the user to drill to a list of all terminated employees, showing termination reasons and length of service, as well as job and location details. Workforce accounting answers these questions: . Will my workforce be able to perform planned work on time? . Where are my termination hot spots and what action should I take to reduce turnover? . What categories of staff have the highest turnover and what impact will it have on capacity? . How many people should I hire to anticipate a seasonal upturn or new initiative? . What underlying trends will impact my capacity to meet demand? Control costs and comply with budgetary constraints
M. K. Kolkas, et al / International Journal of Information Science and Intelligent System
(2014)
137
Many businesses use budgetary control as a tool to manage costs and to indicate planned levels of demand. DBI for HRMS uses budgets defined within Oracle Human Resources for FTE or headcount and compares actuals over a defined period. Shortfalls or excesses can be identified or anticipated, so that hiring, redeployment or layoff plans can be put in place. This ensures that the capacity of the workforce is used optimally.Budgetary comparisons answer the following questions: . How many people should I hire to meet demand? . How will trends in staff levels affect demand? Conduct regional analysis to pinpoint problems DBI for HRMS aggregates workforce and average salary data by country in order for the user to compare company information with local conditions. The user can investigate if % year-onyear trends in average salaries for a given country compare with inflation in that region. Country analysis ensures that the manager can make adjustments for regional variations that influence hiring capacity.
Figure 5. Understand workforce changes and how they impact ability to meet demand Use salary analysis to control compensation costs and aid retention Staff compensation is one of the most significant costs of any enterprise, and managers need to closely monitor salary levels as an indicator of total staff costs. With a high level of turnover and variation in working conditions, it is easy to lose sight of any underlying trends. For instance, a high hiring rate might lead to an increasing salary trend higher than inflation, and at variance with planning assumptions. Increasing pay below inflationary levels for different job categories might lead to retention problems with critical staff. DBI for HRMS displays total and average salaries for each level of the reporting hierarchy, and highlights changes within a selected period. (Figure. 6) Drill-down to a subdivision by job function and job family allows problems to be identified for different types of employee such as those with scarce skills. The headcount and salary trend report shows trends in the total level of salaries compared with trends in the workforce count: deviation in these graphs can either be due
138
M. K. Kolkas, et al / International Journal of Information Science and Intelligent System
(2014)
to periodic planned increases, or might point to anomalies created by new hires being paid more than current employees. Use Turnover reporting to anticipate and act on retention issues Turnover, the metric used to indicate the level of staff movements as a proportion of the population, is an important indicator of underlying problems with retention. DBI for HRMS goes one step further. Not only can a line manager look at trends over any period in voluntary and involuntary turnover, but also they can then drill to details of people in each level of the hierarchy to understand termination reasons and what types of staff are being lost. The turnover reports answer the following questions: . What proportion of my staff leave in any annual period . What categories of staff have the highest leaving rate? Why is staff leaving? . What impact will turnover trends have on my ability to meet required staffing levels? Drill Directly to Detail DBI for HRMS offers visibility into aggregated summary information as well as easy navigation to the granular details of the transactions that make up the summary data and KPIs. This allows users to identify and view the specific transactions that are behind the aggregation to answer detailed questions that might arise. Personalized Related Links Related links can be customized to all intelligence and applications functions and reports, including tabular and graphical representations of sales data, trends, links to menus, as well as both internet and intranet web pages. By personalizing the DBI for HRMS, all the necessary measurements and reports are provided on a daily basis, and in one location, so the sales managers and executives can make informed decisions.
Figure 6. Salary summaries allow compensation to be aggregated globally, or managed locally Uses summarized information for high performance DBI uses collection programs to populate summarized tables as frequently as needed, in order that information can be retrieved and presented to the user extremely rapidly.
M. K. Kolkas, et al / International Journal of Information Science and Intelligent System
(2014)
139
Deploy Out-of-the-Box DBI is both straightforward and simple to implement. It utilizes existing set-ups and terms that are already implemented in existing Oracle Applications. The result is a streamlined reporting application that can be used almost immediately to provide an enterprises daily measurements . Oracle E-Business Suite - The Complete Solution Oracle E-Business Suite enables companies to efficiently manage customer processes, manufacture products, ship orders, collect payments, and moreَall from applications that are built on a unified information architecture. This information architecture provides a single definition of your customers, suppliers, employees, and productsَ all aspects of your business. Whether you implement one module or the entire Suite, Oracle E-Business Suite enables you to share unified information across the enterprise so you can make smarter decisions with better information . * Daily Business Intelligence for HRMS: Reports Reports enabling you to assess workforce management trends. Annualized Turnover . Displays the annualized employee headcount turnover for a selected manager , categorizing turnover as either voluntary or involuntary. Annualized Turnover Status Displays the percentage annualized turnover, voluntary and involuntary, for each direct report of the selected manager, as well as headcount. Turnover Detail . Lists ex-employees in a selected category of turnover Annualized Turnover Trend Shows changes in the annualized employee headcount turnover over time for a selected manager , showing voluntary and involuntary separations. Salary. Displays the employee total salary, average salary and salary change percent of all direct reports of the selected manager. Salary by Job Function Status The Salary report displays the employee total salary, average salary and salary change percent of all direct reports of the selected manager, for a given job function. Salary by Job Family Status The Salary report displays the employee total salary, average salary and salary change percent of all direct reports of the selected manager, for a given job family within a job function Headcount
140
M. K. Kolkas, et al / International Journal of Information Science and Intelligent System
(2014)
Shows the total employee headcount, and transfers in and out, of the direct reports of a selected manager for a selected time period. Headcount Hire Detail Lists the people comprising the hires and re-hires counted in the headcount report. Headcount Transfer (Plus) Detail . Lists the people comprising the transfers-in counted in the headcount report. Headcount Transfer (Minus) Detail . Lists the people comprising the transfers-out counted in the headcount report. Headcount Termination Detail. Lists the people comprising the terminations counted in the headcount report, and shows relevant job and service information. Headcount by Country Trend. This graph shows changes in headcount over time for the four countries with the highest headcount for the selected manager. Headcount Budget Trend. Shows headcount changes over time compared against budget for a selected manager. Headcount and Salary by Country. Shows changes in headcount and salaries over time for a selected manager. Headcount and Salary by Country. This report displays the total employee headcount, percentage headcount change, average salary and percentage average salary change for the countries with the highest headcount. Headcount and Salary Detail . Lists the employees and their salary making up a total value in the salary report. This report displays the salaries in both their local currency and in the DBI primary or the global currency. * Daily Business Intelligence for HRMS: Key Performance Indicators KPIs enabling you to detect and act on out-of tolerance workforce trends Total Headcount of employees. Shows totals and % change over a selected period. Total employee salaries. Shows total salaries over a selected period and % change Average salary. Shows average salaries over a selected period and % change. Total annualized turnover. Shows annualized turnover and change during selected period, subdivided into voluntary and involuntary.
M. K. Kolkas, et al / International Journal of Information Science and Intelligent System
(2014)
141
5. Data Mining in ERP Systems Traditionally, OLTP of ERP systems integrates all day-to-day transactions of an enterprise in the way which enables users reduce operating cost, verify consistency of transactions, facilitate day-to-day management and provide detailed or summarized reports. Converting the OLTP data sources into data warehouse enables to apply OLAP and data mining techniques to provide more analytical reports and provide answers of miscellaneous questions to decision makers. OLAP is a way to look at these pre-aggregated query results in real time. However, OLAP itself is still simply a way to evaluate queries which is different from building models of the data as in data mining. Data mining tools model data and return actionable rules, OLAP allows users to compare and contrast measures along business dimensions in real time . While reporting and OLAP are informative about past facts, only data mining can help ERP customers predict the future of business. As shown in Table 2 ,OLAP and data mining can answer different types of decision makers’ questions. Table 2. Questions that can be answered by DM at ERP systems. Data Mining What is the profile of people who are likely to respond to future mailings? Which existing customers are likely to buy company’s next new product? Which 10 customers offer me the greatest profit potential? Which customers are likely to switch to the competition in the next six months? Is this customer likely to be a good credit risk? What are expected sales by region next year? What can be done to improve throughput and reduce scrap? The following Table 3 shows how data mining enhance an ERP solution.
142
M. K. Kolkas, et al / International Journal of Information Science and Intelligent System
(2014)
Table 3. tasks that can be performed by DM at ERP systems. ERP Module Accounting & Finance Management Human Resources Management
Data Mining Sample Tasks Forecast total company profits based on historical data. Predicting Cash Flow Predicting overall profit/lose Select candidate employee based on historical data
Vendors & Purchase Management
Determine best arrangement and quantities of purchase orders. (Purchase what of who and what amount)
Production Management
Applying Classification /Clustering technique to designs given design parameters to find out if design may result in unacceptable defect percentage in final products
Customer Relationship Management
Identify customers' behavior patterns. Find people in similar life stages and may behave in the same way.
Sales & Distribution Management
Determine what items sold together more probably for P.O.S. Determining customer behavior over selling web sites. Effectively segment customers into manageable groups. Focus marketing efforts on prospects more likely to purchase. Forecast sales for a given period of time. Discover which customers will response to a given offer.
6. Dta Mining and Knowledge Discovery. 6.1 Data Mining Tasks At the core of the KDD process are the data mining methods for extracting patterns from data. These methods can have different goals, dependent on the intended outcome of the overall KDD process. It should also be noted that several methods with different goals may be applied successively to achieve a desired result. For example, to determine which customers are likely to buy a new product, a business analyst might need to first use clustering to segment the customer database, then apply regression to predict buying behavior for each cluster. Most data mining goals fall under the following categories: Data Processing: Depending on the goals and requirements of the KDD process, analysts may select, filter, aggregate, sample, clean and/or transform data. Automating some of the most typical data processing tasks and integrating them seamlessly into the overall process may
M. K. Kolkas, et al / International Journal of Information Science and Intelligent System
(2014)
143
eliminate or at least greatly reduce the need for programming specialized routines and for data export/import, thus improving the analyst’s productivity. Prediction: Given a data item and a predictive model, predict the value for a specific attribute of the data item. For example, given a predictive model of credit card transactions, predict the likelihood that a specific transaction is fraudulent. Prediction may also be used to validate a discovered hypothesis. Regression: Given a set of data items, regression is the analysis of the dependency of some attribute values upon the values of other attributes in the same item, and the automatic production of a model that can predict these attribute values for new records. For example, given a data set of credit card transactions, build a model that can predict the likelihood of fraudulence for new transactions. 6.2 Data Mining Methodology It should be clear from the above that data mining is not a single technique, any method that will help to get more information out of data is useful. Different methods serve different purposes, each method offering its own advantages and disadvantages. However, most methods commonly used for data mining can be classified into the following groups. Statistical Methods: Historically, statistical work has focused mainly on testing of preconceived hypotheses and on fitting models to data. Statistical approaches usually rely on an explicit underlying probability model. In addition, it is generally assumed that these methods will be used by statisticians, and hence human intervention is required for the generation of candidate hypotheses and models. Case-Based Reasoning: Case-based reasoning (CBR) is a technology that tries to solve a given problem by making direct use of past experiences and solutions. A case is usually a specific problem that has been previously encountered and solved. Given a particular new problem, case-based reasoning examines the set of stored cases and finds similar ones. If similar cases exist, their solution is applied to the new problem, and the problem is added to the case base for future reference. Neural Networks: Neural networks (NN) are a class of systems modeled after the human brain. As the human brain consists of millions of neurons that are interconnected by synapses, neural networks are formed from large numbers of simulated neurons, connected to each other in a manner similar to brain neurons. Like in the human brain, the strength of neuron interconnections may change (or be changed by the learning algorithm) in response to a presented stimulus or an obtained output, which enables the network to “learn”. Decision Trees:
144
M. K. Kolkas, et al / International Journal of Information Science and Intelligent System
(2014)
A decision tree is a tree where each non-terminal node represents a test or decision on the considered data item. Depending on the outcome of the test, one chooses a certain branch. To classify a particular data item, we start at the root node and follow the assertions down until we reach a terminal node (or leaf). When a terminal node is reached, a decision is made. Decision trees can also be interpreted as a special form of a rule set, characterized by their hierarchical organization of rules. Rule Induction: Rules state a statistical correlation between the occurrence of certain attributes in a data item, or between certain data items in a data set. The general form of an association rule is =Xl ^ ... ^ Xn => Y [C, S], meaning that the attributes Xl,...,Xn predict Y with a confidence C and a significance S. Bayesian Belief Networks: Bayesian belief networks (BBN) are graphical representations of probability distributions, derived from co-occurrence counts in the set of data items. Specifically, a BBN is a directed, acyclic graph, where the nodes represent attribute variables and the edges represent probabilistic dependencies between the attribute variables. Associated with each node are conditional probability distributions that describe the relationships between the node and its parents. Fuzzy Sets: Fuzzy sets form a key methodology for representing and processing uncertainty. Uncertainty arises in many forms in today’s databases: imprecision, non-specificity, inconsistency, vagueness, etc. Fuzzy sets exploit uncertainty in an attempt to make system complexity manageable. As such, fuzzy sets constitute a powerful approach to deal not only with incomplete, noisy or imprecise data, but may may also be helpful in developing uncertain models of the data that provide smarter and smoother performance than traditional systems. Since fuzzy systems can tolerate uncertainty and can even utilize language-like vagueness to smooth data lags, they may offer robust, noise tolerant models or predictions in situations where precise input is unavailable or too expensive. Genetic algorithms/Evolutionary Programming: Genetic algorithms and evolutionary programming are algorithmic optimization strategies that are inspired by the principles observed in natural evolution. Of a collection of potential problem solutions that compete with each other, the best solutions are selected and combined with each other. In doing so, one expects that the overall goodness of the solution set will become better and better, similar to the process of evolution of a population of organisms. Genetic algorithms and evolutionary programming are used in data mining to formulate hypotheses about dependencies between variables, in the form of association rules or some other internal formalism. Rough Sets: A rough set is defined by a lower and upper bound of a set. Every member of the lower bound is a certain member of the set. Every non-member of the upper bound is a certain nonmember of
M. K. Kolkas, et al / International Journal of Information Science and Intelligent System
(2014)
145
the set. The upper bound of a rough set is the union between the lower bound and the so-called boundary region. A member of the boundary region is possibly (but not certainly) a member of the set. Therefore, rough sets may be viewed as fuzzy sets with a three-valued membership function (yes, no, perhaps). Like fuzzy sets, rough sets are a mathematical concept dealing with uncertainty in data . Also like fuzzy sets, rough sets are seldom used as a stand-alone solution; they are usually combined with other methods such as rule induction, classification, or clustering methods.
7. Oracle E-Business Suite R12 (ERP) This module introduces the different programs and components that make up Oracle Applications Release 12. It describes the components that are stored and processed in the Oracle Applications database as well as the components stored in the Oracle Applications file system. It also explains the various component applications and how dependencies exist between them. A brief introduction of the Vision Demo database is also provided. Many of the components and processes introduced in this module are described in further detail in subsequent modules. Oracle E-Business Suite Oracle E-Business Suite is a suite of integrated software applications that provides a complete solution to the business needs of enterprises of all types and sizes. Each E-Business Suite product provides services for a particular business area, such as Inventory or Accounts Receivable. Oracle E-Business Suite includes component applications such as: Customer Relationship Management (CRM), Financials, Supply Chain and Human Resource Management Systems (HRMS). Oracle E-Business Suite Home Page After logging into Oracle E-Business Suite, the first page the user sees is the Oracle EBusiness Suite Home Page as in Figure.7 This page is the starting point to access both the HTML interface and the Forms interface, and it provides seamless navigation to all areas of the system. The Oracle E-Business Suite Home Page provides a consistent look and feel across all Oracle Applications products. As shown in the screen shot, you can: 1. View or respond to your most important notifications from the Worklist. 2. Access E-Business Suite functions from the Navigator. 3. Set Preferences. Navigate to frequently-used functions or Web pages from Favorites.
146
M. K. Kolkas, et al / International Journal of Information Science and Intelligent System
(2014)
4. Figure 7. Oracle E-Business Suite Home Page Oracle E-Business Suite Home Page After logging into Oracle E-Business Suite, the first page the user sees is the Oracle EBusiness Suite Home Page as in Figure.7 This page is the starting point to access both the HTML interface and the Forms interface, and it provides seamless navigation to all areas of the system. The Oracle E-Business Suite Home Page provides a consistent look and feel across all Oracle Applications products. As shown in the screen shot, you can: 1. View or respond to your most important notifications from the Worklist. 2. Access E-Business Suite functions from the Navigator. 3. Set Preferences. 4. Navigate to frequently-used functions or Web pages from Favorites. HTML Interface as shown in as shown in Figure.8 The HTML Interface architecture includes or utilizes the following components : -A Web browser -The Oracle HTTP server, powered by Apache -HTML and XML files -JavaServer Pages, JavaBeans, and Servlets
M. K. Kolkas, et al / International Journal of Information Science and Intelligent System
(2014)
147
-Oracle database Features highlighted in the screen shot are: 1. Process Train 2. Date Picker 3. Global Links 4. List of Values Icon
Figure 8. HTML Interface Forms Interface As shown in as shown in Figure .9 One of the key application tier software components used by many Oracle E-Business Suite products is Forms services, which mediate between the Forms client (a Java applet running on the desktop), and the Oracle database server on the database tier. Features highlighted in the screen shot are: 1. Single-Row Block 2. Multi-Row Block 3. Folder Indicator 4. Current Record Indicator 5. Record 6. Field 7. List of Values Indicator 8. Descriptive Flexfield 9. Master-Detail Coordination Box.
148
M. K. Kolkas, et al / International Journal of Information Science and Intelligent System
(2014)
Figure 9. Forms Interface Specific Requirements for Windows Release 12 has additional software requirements for Windows: - Microsoft Visual C++ 8.0 (http://www.microsoft.com) -gnu make (shareware) Version 3.81 (http://www.gnu.org). Obtainable via Oracle patch 5897842, which contains the source files and the pre-built executable file, gnumake.exe -MKS Toolkit Version 9 (Patch 3) or higher (http://www.mks.com) Free software from Cygwin (http://www.cygwin.com) can be used instead of MKS Toolkit to provide the UNIX scripting commands needed for the AD utilities. However, Oracle recommends using the MKS Toolkit for all critical systems. Memory Requirements To calculate memory requirements for the database machine, consider: -Oracle database overhead -Size of system global area (SGA) -Number of concurrent users -Other software on the machine (not recommended).
M. K. Kolkas, et al / International Journal of Information Science and Intelligent System
(2014)
149
Disk Space Requirements Consider disk space requirements for: -Stage area -Language files -Applications log and output files -Disk Space Requirements (File System) -Rapid Install installs the file system and database files for all products. The size of the application tier file system objects is approximately 28 GB. This includes the OracleAS10.1.2ORACLE_HOME,OracleAS10.1.3ORACLE_HOME,COMMON_TOP, APPL_TOP, and INST_TOP. -The disk size required for the database tier files is approximately 45 GB for a fresh install database and 133 GB for a Vision Demo database. - Stage area: If you run Rapid Install from a stage area, you need at least 33 GB to accommodate the file system and database files in your stage area. CPU Requirements Because there are different product combinations, different user profiles, and different configurations, there is no one sizing answer for all hardware platforms. Some hardware vendors have sizing worksheets that model the CPU and memory requirements of Oracle Applications on their hardware. The most reliable strategy to ensure that the hardware is sized appropriately is to install a test environment, and then set a benchmark with a configuration, product mix, and user load that simulates your own current and expected workloads. These "actual“ conditions can help verify performance before you install your production-ready environment. If such a benchmark is not feasible, Oracle Consulting Services and your hardware vendor can help you find another Oracle Applications system running a product mix and user profile similar to yours.
8. Conclusions and Future Research Enterprise resource planning information systems are a common example of business application that results in a huge amount of data. Businesses that use ERP systems can benefit from business intelligence OLAP and data mining (DM) approaches that can apply to ERP's data in order to generate reports, charts and identify new knowledge to support decision makers. Although OLAP and data mining can perform different tasks on ERP's data, but integrating both approaches is very useful to perform new tasks that may be required by businesses decision makers and ERP users that cannot be performed using one of the two approaches. One method of integration is applying OLAP operations to DM output results. In future work, another method of integration can be used to integrate OLAP with DM. The method is to apply data mining operations such as (association rule mining, clustering, classification …) to the multi-dimensional database in order to perform new advanced business intelligence tasks.
150
M. K. Kolkas, et al / International Journal of Information Science and Intelligent System
(2014)
Knowledge discovery can be broadly defined as the automated discovery of novel and useful information from commercial databases. Data mining is one step at the core of the knowledge discovery process, dealing with the extraction of patterns and relationships from large amounts of data. Today, most enterprises are actively collecting and storing large databases. Many of them have recognized the potential value of these data as an information source for making business decisions. The dramatically increasing demand for better decision support is answered by an extending availability of knowledge discovery and data mining products, in the form of research prototypes developed at various universities as well as software products from commercial vendors. In this paper, we provide an overview of common knowledge discovery tasks, approaches to solve these tasks, and available software tools employing these approaches. However, despite its rapid growth, KDD is still an emerging field. The development of successful data mining applications still remains a tedious process . The following is a (naturallyincomplete) list of issues that are unexplored or at least not satisfactorily solved yet. Integration of different techniques. Currently available tools deploy either a single technique or a limited set of techniques to carry out data analysis. it follows immediately that there is no best technique for data analysis. The issue is therefore not which technique is better than another, but rather which technique is suitable for the problem at hand. A truly useful tool has to provide a wide range of different techniques for the solution of different problems.
Support for both analysis experts and novice users. There are usually three stages at deploying KDD technology in an organization: 1) The potential of KDD is discovered. First naive studies are performed, often by external consultants (which are data mining specialists). 2) Once the profitability of KDD is proven, it is used on a regular basis to solve business problems. Users usually are teams of analysis experts (with expertise in KDD technology) and domain experts (with extensive knowledge of the application domain). 3) Fully exploitation of KDD technology within the organization. End users are enabled to perform their own analysis according to their individual needs. Although widely still a vision, the necessity for this stage is clearly recognized. Extensibility. This is another consequence from the fact that different techniques outperform each other for different problems. With the increasing number of proposed techniques as well as reported applications, it becomes clearer and clearer that any fixed arsenal of algorithms will never be able to cover all arising problems and tasks. Managing changing data.
M. K. Kolkas, et al / International Journal of Information Science and Intelligent System
(2014)
151
In many applications, including the vast variety of nearly all business problems, the data is not stationary, but rather changing and evolving. This changing data may make previously discovered patterns invalid and hold new ones instead. Currently, the only solution to this problem is to repeat the same analysis process (which is also work-intensive) in periodic time intervals. There is clearly a need for incremental methods that are able to update changing models, and for strategies to identify and manage patterns of temporal change in knowledge bases. Non-standard data types. Today’s databases do not contain only standard data such as numbers and strings but also large amounts of nonstandard and multimedia data, such as free-form text, audio, image and video data, temporal, spatial and other data types. Those data types contain special patterns, which can not be handled well by the standard analysis methods. Therefore, these applications require special, often domain-specific, methods and algorithms. While there are fundamental problems that remain to be solved, there have also been numerous significant success stories reported, and the results and benefits are impressive. Although the current methods still rely on fairly simple approaches with limited capabilities, reassuring results have been achieved, and the benefits of KDD technology have been convincingly demonstrated in the broad range of application domains. The combination of urgent practical needs and the strong research interests lets us also expect a future healthy grow of the field, drawing KDD tools into the mainstream of business applications.
Acknowledgments This work has been supported by Dr.Hazem El Bakry , Eng.Emad AbdulAziz and Eng.Ahmed Galal and Others .So I'd like to thank all of them andTheir institutions that have allowed them to use their own real business data which helped me a lot to make this study.
References [1] Brachman, R., and Anand, T. “The process of knowledge discovery in databases“ : A humancentered Approach. In Fayyad, U., Piatetsky-Shapiro, G., Amith, Smyth, P., and Uthurusamy, R. (eds.), “Advances in Knowledge Discovery and Data Mining” , MIT Press, Cambridge, 1996. [2] Bourgoin, M.O., and Smith, S.J. Big Data -- Better Returns, “ Leveraging Your Hidden Data Assets to Improve ROI”. In Freedman et al (eds.), Artificial Intelligence in the Capital Markets, Probus Publishing Company, 1995. [3] Brooks, P.Visualizing Data “Sophisticated Graphic Visualization and Development Tools Tailored for Business Applications”. In DBMS, Miller Freeman Inc,San Mateo,CA,August 1997. [4] Brunk, C., Kelly, J., and Kohavi, R. MineSet: “An Integrated System for Data Mining“. In Proceedings of the The Third International Conference on Knowledge Discovery and Data Mining, August 1997. (http://robotics.stanford.edu/users/ronnyk/ronnyk-bib.html). [5] Demuth, H., and Beale, M. “The Neural Network Toolbox for MATLAB”. Mathworks Inc., Nattick, MA, 1996. [6] Fayyad, U. “Data Mining and Knowledge Discovery”: Making Sense Out of Data. IEEE Expert, v. 11, no. 5, pp. 20-25 , October 1996. [7] Fayyad, U., Piatetsky-Shapiro, G., and Smyth, P. From “Data Mining to Knowledge Discovery: An Overview”. In Fayyad, U., Piatetsky-Shapiro, G., Amith, Smyth, P., and
152
M. K. Kolkas, et al / International Journal of Information Science and Intelligent System
(2014)
Uthurusamy, R. (eds.), “Advances in Knowledge Discovery and Data Mining”, MIT Press, 1-36, Cambridge, 1996. [8] Fayyad, U., Piatetsky-Shapiro, G., and Smyth, P. The KDD Process for Extracting Useful Knowledge from Volumes of Data. Communications of the ACM, vol. 39, no. 11, pp. 27-34, November 1996. [9] Dennis Shasha and Philippe Bonnet, “Database Tuning: Principles, Experiments, and Troubleshooting Techniques” [10] Gilliland, S. Scenario 1.0: Mine Your Data for Statistical Gems. Computer Shopper, ZiffDavis Publishing Company, October 1997. [11] Jiawei Han and Micheline Kamber, “Data Mining: Concepts and Techniques”, Second Edition. [12] Patrick and Elizabeth O’Neil , “Database: Principles, Programming, and Performance”, Second Edition [13] Meta Group Inc. “Data Mining: Trends, Technology, and Implementation Imperatives”. Stamford, CT, Februay 1997. [14] Data Destilleries Inc. “Online Data Mining “ -- Data Destilleries’ vision on data mining technology. White PaperDD-R9704, Amsterdam, May 1997. [15] Bjorvand, A.T. Rough Enough -- Software Demonstration.15th IMACS World Congress on Scientific Computation, “ Modelling and Applied Mathematics”. Berlin, Germany, August 24-29, 1997. [16] IanWitten and Eibe Frank. “Data Mining: Practical Machine Learning Tools and Techniques with Java Implementations”. [17] Ahmed Elmagarmid, Marek Rusinkiewicz, and Amit Sheth. “Management of Heterogeneous and Autonomous Database Systems”. [18] Michael Stonebraker and Paul Brown,with Dorothy Moore. “Object-Relational DBMSs: Tracking the Next Great Wave”, Second Edition. [19] Clement T. Yu andWeiyi Meng. “Principles of Database Query Processing for Advanced Applications”. [20]GerhardWeikum and Gottfried Vossen. “Transactional Information Systems: Theory, Algorithms, and Practice of Concurrency”. Control and Recovery [21] Advanced SQL:II 1999—“Understanding Object-Relational and Other Advanced Features“,Jim Melton.