Application Performance, Power and Cooling in Data Centers. Yuan Chen, Daniel Gmach, ..... between groups of servers. We call any homogeneous collection.
Integrated Management of Application Performance, Power and Cooling in Data Centers Yuan Chen, Daniel Gmach, Chris Hyser, Zhikui Wang, Cullen Bash, Christopher Hoover, Sharad Singhal Hewlett-Packard Laboratories
IT Equipment CRAC 3
CRAC 2
CRAC 1
Rack 10
CRAC 4
Rack 34
Cooling Efficiency (LWPI) 10 CRAC 5
Abstract—Data centers contain IT, power and cooling infrastructures, each of which is typically managed independently. In this paper, we propose a holistic approach that couples the management of IT, power and cooling infrastructures to improve the efficiency of data center operations. Our approach considers application performance management, dynamic workload migration/consolidation, and power and cooling control to “right-provision” computing, power and cooling resources for a given workload. We have implemented a prototype of this for virtualized environments and conducted experiments in a production data center. Our experimental results demonstrate that the integrated solution is practical and can reduce energy consumption of servers by 35% and cooling by 15%, without degrading application performance.
5
INTRODUCTION
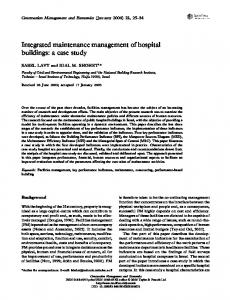
Data centers are proliferating worldwide as a result of the demand for IT services. We have previously reported a breakdown of the costs involved in building and operating data centers [1]. In this work, we found that the power required to run the IT equipment and cooling equipment in a data center is a significant portion of the variable costs of operation. As such, the reduction of power consumption is of critical concern to data center owners and operators. Traditionally, the management of data centers has been divided into separate practices. IT professionals manage the IT gear, and other mechanical trades manage the data center facilities, i. e., the power, cooling and building infrastructures. Ideally, the cooling and power resources would be allocated dynamically according to the needs of the IT equipment, but the information needed to do this is usually unavailable. As a result, the typical practice in facilities management is to over-provision power and cooling to ensure that all IT equipment is adequately powered and cooled in all circumstances. The discrete management of those “silos” results in inefficiencies, and the cost of these inefficiencies will increase in the future. By 2012, the EPA [2] predicts energy consumption in data centers will double from 2007 levels. Energy prices are also increasing, and the rate of increase is expected to rise due to regulatory and social concerns over green house gas emissions from energy production. Significant cost savings are possible if these distinct silos of IT, power and cooling are managed in concert. But energy efficiency is for naught if the data center cannot deliver its IT services according to predefined SLA or QoS goals. Failures to meet SLAs can result in substantial business revenue loss. Amazon found that every additional 100 ms of latency cost them 1% loss in sales, and Google observed that an extra 0.5 s in search page generation time reduced traffic by 20% [3]. It is important to allocate IT resources dynamically to meet SLAs to respond to changing workloads. From a cooling perspective, a data center is a dynamic thermal environment (Figure 1). Typically, there are significant nonuniformities due to variations in airflow, physical placement
CRAC 6
0
I.
-5
Hot Aisles
Cold Aisles
-10
Fig. 1: Cooling efficiency overview of a data center. of IT equipment and the placement of workload within the IT equipment [4], [5]. As a result, some locations in a data center (e. g., Rack 34 in Figure 1) are much more efficiently cooled than others (e. g., Rack 10). A significant opportunity for energy savings lies in the integrated control and placement of IT workloads within the physical facility according to cooling efficiency. Placing or moving workloads into proper locations can make the cooling infrastructure operate more efficiently and hence can result in substantial reduction in cooling power. Recent research has focused on improving both SLA management and data center energy efficiency, mostly with respect to resource allocation [6], [7], capacity planning and workload management [8], [9], power [10], [11] and thermal management [5], [12]. However, most published research focuses on managing performance, IT resources, workload, power and cooling in isolated ways. Approaches that are not holistic, particularly those that do not consider the interactions between IT resources and cooling facilities, may indeed meet SLAs, but will not realize the energy savings of a cooling efficiency-aware approach. In this paper, we propose an integrated solution that couples the management of IT resources and cooling infrastructure to improve the overall efficiency of data center operations. Our solution considers interactions between dynamic resource allocation, workload placement and cooling control. By properly provisioning computing, power and cooling resources, our solution can meet application-level performance goals while dramatically reducing the energy consumption of both the IT and cooling systems. We have implemented a prototype of this integrated data center management solution and validated our solution through experiments in a production data center. Experimental results show that our solution is able to maintain performance goals while reducing energy consumption by more than 35% for IT infrastructure and 15% for cooling infrastructure.
IT Management Performance Models
Cooling Management
POD Controller
Application Controllers
Daffy Server State Changes
Resource Resource Requests Adjustments
DSC
Utilization Targets Performance Metrics
temperature sensors that measure the inlet temperature of IT equipment. This allows DSC to supply the requisite cooling to the IT equipment without over-cooling the room. IT and cooling management are integrated through Daffy. Daffy uses a data model to link information in the thermal model such as sensor readings with information in the IT model such as node location. It further automatically collects IT and facility data (e. g., LWPI, which is defined in Section II-D1) and delivers it to controllers at run time. The pod controller uses LWPI values in its workload placement decisions to account for differences in thermal efficiency within the data center. Daffy also updates DSC with the server state information (e. g., server power status), which is received from the pod controllers. DSC then adjusts the CRACs accordingly to react to the changes in IT workload demand. All control—including dynamic resource allocation, workload migration and dynamic cooling—occurs automatically according to real-time measurements of performance, resource consumption, and thermal conditions within the data center and is governed by a set of policy settings. We discuss each of the management modules and integrations in detail next. C. Integrated IT Management 1) Application Controller: Each application controller controls a single application composed of one or more application components, with each component hosted inside a VM. The policy associated with an application controller includes the response time target, control interval, utilization thresholds, etc. The application controller periodically generates appropriate utilization targets for the corresponding VMs to ensure that the application’s performance goals are met. For that, it estimates utilization targets based on a performance model. We next outline the performance model used to derive utilization targets from application response time targets for multi-tier applications in virtualized environments. In this work, we focus on CPU resources, since CPU-intensive business logic processing in multi-tier applications is often the bottleneck. In the following discussion, we assume that CPU is the single bottleneck resource; that CPU is the only resource to be dynamically allocated among VMs; and that non-CPU resources are adequately provisioned and the effect of contention for these resources on response time (i. e., queuing delay) is negligible. Assuming that a Poisson process is a good approximation of request arrivals, we model each CPU as an M/G/1/PS queue. In accordance with queuing theory, the CPU resident time of all requests served in a tier is represented by u/(1 − u). The total CPU resident time across all tiers, then, can be described as in Equation 1 where M is the number of tiers, um is the CPU utilization of the VM at tier m and λ is the request rate. M 1 � um (1) rcpu = λ m=1 1 − um Multi-tier applications typically support a number of transaction types (e. g., login, browse, check-out). Let αn represent service time of a transaction type n on all non-CPU resources on the execution path of that transaction type. Then the mean resident time on non-CPU resources can be approximated by the weighted sum of each transaction type’s service time as in Equation 2 where N is the number of transaction types and λn is the request rate transaction type n. The aggregate request �of N rate λ equals to n=1 λn .
Floor Plan Information
LWPI
CRAC Utilization
Node Controllers
Adjust Blower Power
Resource Consumption of VMs
Applications
Physical Nodes
Temperature Temperature Temperature Sensors Sensors Sensors
Sensors
Actuators CRACS CRACS CRACS
Fig. 2: Architecture of our solution. II. O UR A PPROACH A. Background A data center is a complex system consisting of building, power and cooling infrastructure, and IT equipment and applications. We use the term IT to refer to IT equipment and applications and services running in a data center. In this paper, we consider an environment where multiple applications are hosted within a common pool of virtualized servers. Applications consist of one or more interacting components, each running within its own virtual machine (VM). The resources of a physical server (node) is shared by the hosted VMs, including CPU capacity, disk access and network I/O bandwidth. Resources are allocated at run time through a per-node VM monitor or hypervisor (e. g., Xen CPU scheduler [13]). Each application is assumed to have an application-level performance target or resource-level utilization threshold. The goal of SLA management is to meet the target through dynamic resource allocation while minimizing the over-provisioning of resources. The term facilities refers to all components (e. g., power or cooling equipment) that are not directly involved in providing IT services. One function of data center facilities is to remove heat generated by the IT equipment. Computer Room Air Conditioners (CRACs) perform this action. The speed of the blowers within each CRAC can be varied as can the set point for the supply air temperature (SAT). The goal of cooling management is to reduce energy consumption required for cooling the data center while maintaining its own QoS guarantees, typically stated as server or blade inlet temperature set points. B. Overview of Our Approach The architecture shown in Figure 2 consists of a set of controllers, sensors and actuators on both IT and cooling equipment. IT management includes application, node and pod controllers. Application controllers and node controllers continually adjust resource allocations among individual workloads on a shared server in response to dynamically changing workloads. A pod controller dynamically migrates workloads as necessary to avoid nodes where aggregate resource demand exceeds available capacity, while simultaneously consolidating workloads to fewer nodes and opportunistically powering down unused nodes to save power and cooling costs. The set of powered nodes are chosen based on their cooling efficiencies, i. e., how efficiently they can be cooled. Cooling management includes our zonal cooling controller, Dynamic Smart Cooling (DSC) [12]. DSC adjusts the blower speed and the SAT set points of the CRACs based on data from 2
rnon
cpu
N 1� = αn λn λ n=1
hundreds of nodes and a few thousands of VMs may comprise a pod. A data center may have multiple pods, and hence multiple pod controllers. A pod controller dynamically arranges VM workloads within its pod based on resource requests (e. g., CPU, LAN, SAN and memory needs) of the node controllers associated with servers in the pod. Changes are made via VM live migration. Candidate arrangements are generated and evaluated by a genetic algorithm. The objective function used is designed to consolidate the workload onto the fewest number of nodes possible that can be most efficiently cooled and that have the best average utilization. Penalties are assessed for arrangements that include overloaded nodes, that require a large number of migrations to achieve, that use nodes to be avoided as per policy, and that use nodes that cannot be efficiently cooled. The terms of the objective function are weighted to achieve a balance between potentially performance-disrupting migrations, consolidation and relocation objectives, and the movement of workload to more efficiently cooled areas of the data center. Per-VM migration penalties can be added to minimize movement of performance sensitive VMs. The pod controller evaluates and possibly makes changes to arrangements every 60 s in the experiments described herein. The pod controller also opportunistically shuts down servers that are not used or less efficiently cooled to save power. Node power control and the integration of cooling management is discussed in section II-D3. D. Integrated Data Center Management 1) Cooling Management: A traditional CRAC unit in a data center is controlled via the return air temperature. IT equipment inlet temperatures are not measured directly and cannot be assured. Cooling resources, therefore, are typically overprovisioned to insure that inlet temperature requirements are met. Dynamic Smart Cooling (DSC), by contrast, utilizes data from either a distributed temperature sensor network placed near the inlets of racks that house IT equipment or from IT equipment directly. The data is used to determine the thermal zones of each CRAC and then to provide proper cooling to each zone [12]. In this manner, cooling resources can be correctly provisioned in real-time according to IT equipment needs. This has the benefit of reducing energy consumption, improving effective cooling capacity and improving IT equipment reliability. 2) Local Workload Placement Index: To determine areas of efficient cooling, we use the Local Workload Placement Index (LWPI), first introduced in Cool Job Allocation (CJA), with a modified formulation. LWPI is a measure of how efficiently a location in the data center can be cooled [15]. LWPI is the sum of three components, has units of temperature, and is described in Equation 5. LWPInode = (Thermal Management Margin)node + (AC Margin)node − (Hot Air Recirculation)node (5) The first term in Equation 5 is the Thermal Management Margin at a compute node. This is the difference between a node’s inlet air temperature and its specified set point, which is usually given by the manufacturer as a maximum recommended temperature, less some margin. The second term is Air Conditioning (AC) Margin. AC Margin is the sum over all CRACs of the difference between the CRACs current supply air temperature and their minimum possible set point, weighted by the degree to which the particular CRAC can
(2)
αn can be estimated through linear regression using Equation 2 over multiple measurement intervals as introduced in [14]. Combining Equations 1 and 2, the mean response time can be represented as follows. M N � 1 � um r= ( + αn λn ) (3) λ m=1 1 − um n=1
Transforming Equation 3, the utilization targets uref m (m = 1, . . . , M ) for each tier can be derived for a given response time target rref . We assume that the utilization targets of all the tiers are the same. Note that this does not imply resource allocations are the same across tiers, because the resource requests of different tiers can be significantly different. This allows Equation 3 to be solved directly to obtain the utilization target for each tier as follows: �N rref λ − n=1 αn λn uref = (4) �N m M + rref λ − n=1 αn λn Once an application controller determines the individual utilization targets for each of the component VMs, it sends the targets to the node controllers managing the corresponding VMs. The node controllers then allocate resources accordingly. 2) Node Controller: Each node is associated with a node controller. Its role is to maintain the utilization targets for all hosted VMs by dynamically adjusting their resource allocation. We define the utilization of a VM as the ratio between its resource consumption and its resource allocation. For example, if the measured average CPU consumption of a VM is 60 CPU shares in a control interval, and the specified utilization target is 75%, then the utilization controller will drive the CPU allocation for the VM towards 80 CPU shares in subsequent control intervals. A node controller consists of a set of utilization controllers (one for each individual VM) and one arbiter. The utilization controller collects the average resource consumption of each VM from sensors and determines the required resource allocation to the VM such that a specified utilization target can be achieved. For a given consumption, a change in allocation leads to the change in utilization. Using utilization instead of allocation targets decouples an application controller from the underlying physical resource allocation details. All utilization controllers feed the desired resource allocations (referred to as requests) to the arbiter controller, which determines the set of actual resource allocations (referred to as allocations). If the sum of all requests is less than the node’s capacity, then all the requests are granted. Additionally, excess capacity is distributed among the VMs in proportion to their individual requests. However, if the sum of all requests exceeds the node’s capacity, the arbiter performs service-level differentiation based on workload priorities as defined in perservice policies set by data center operators. In our current implementation, a workload with a higher priority level always has its request satisfied before a workload with lower priority. 3) Pod Controller: Data centers are rarely a homogeneous set of servers that are completely fungible. Networking limitations may require that networks be divided into sub-networks. Performance limits may dictate that storage systems be partitioned between groups of servers. We call any homogeneous collection of servers a pod and dedicate a controller to it. Up to several 3
actually supply cold air to the node and influence its inlet air temperature [12]. The final component is Hot Air Recirculation which quantifies the amount of hot air recirculation at the node and is the difference between the node’s inlet air temperature and the temperature of the air supplied through vent tiles in close proximity to the node. Higher LWPI values indicate higher thermal efficiency. LWPI is only well-defined at thermal sensor locations near the inlets of compute nodes. Temperature measurements can be obtained through an external sensor network or from inlet air temperature sensors incorporated into recent server hardware. LWPI is computed directly for nodes with sensors. Linear interpolation is used for other nodes. The pod controller uses LWPI to choose the best location to place the different workloads. 3) Integration of IT and Cooling Management: The integration of IT and cooling management is through Daffy, which uses a hybrid physical-logical data model that relates facility domain objects to IT domain objects. From the facility domain, Daffy includes the location, name, make-and-model of CRACs, PDUs and racks, as well as facilities-level sensing capabilities such as DSC thermal sensors and CRAC operating points. Most of these objects are represented as volumes in three-dimensional geometry. From the IT domain, Daffy includes the location, name, make-and-model, and ownership (among other attributes) of IT equipment in the data center. This data model allows locating IT equipment relative to the facilities infrastructure, in particular to cooling resources. For example, to return the LWPI value for a given IT node, it is necessary to locate the node in the data center and to obtain relevant temperature measurements. The latter requires knowledge of the IT device model (to determine if there is an inlet air temperature sensor) and the relative location of sensors in the sensor network (if there is not). Daffy automatically collects and delivers thermal metrics such as LWPI values to the pod controller, which uses the LWPI values in its workload placement decisions. As workload is consolidated, the pod controller selects idle nodes to power off. Given the movement of workload to more efficiently cooled areas, the least efficiently cooled nodes as determined by LWPI are powered down first. As workload increases, the LWPI values associated with powered down nodes are used to determine the order in which nodes are powered up. Once the pod controller consolidates workloads and turns off idle servers, the information is sent to Daffy and Daffy interacts with DSC to adjust cooling resources according to predefined policies. For example, if servers in a rack are shutdown, the inlet air temperature of the rack can be raised. Daffy locates the corresponding temperature sensors associated with the servers and changes their settings in DSC. In response to this change, DSC reduces the corresponding CRAC outputs to save energy.
example, application controllers don’t necessarily know on which nodes VMs are hosted and thus which node controllers they need to talk to. The number of messages an application controller sends is linear with the number of application components. Each node controller sends and receives messages in proportion to the number of VMs running on the node. The number of messages the pod controller receives is linear with the total number of VMs in the pod. Typically, a pod comprises up to a few hundred of nodes and a few thousands of VMs. F. Discussion and Clarification While the pod controller does consider memory, LAN and SAN in its decisions, the performance model was limited to a single bottleneck resource. Including non-cpu resources is under investigation. The use of a simpler queueing performance model is motivated by its robustness and ease of acquiring transaction type information in production systems. Prior work [16], [14] shows that this model works well, and measured response time prediction errors were less than 15% in our experiments. We are working to enhance our model based on the advanced model proposed in [16], [17]. Further, feedback control is feasible. Use of feedback control versus predictive control makes stability versus reaction time tradeoffs. Prior work has addressed combining feedback to compensate for modeling errors [18]. Finding appropriate workloads to test the combination with energy management will be part of our future work. III. E VALUATION We designed and conducted a set of experiments to evaluate the application performance, resources required, and power used by both computing and cooling equipment. In this section, we compare our solution with non-integrated approaches and demonstrate that the integrated approach significantly reduces resource and power consumption without degrading application performance. A. Testbed Our experiments were conducted in a data center located at HP in Palo Alto, California. Figure 1 shows the layout of this data center. The IT equipment includes servers, networking switches and storage equipment and is organized as ten rows of racks in a standard “hot-aisle-cold-aisle” configuration. Six CRAC units cool the room. Five sensors on each rack measure the inlet air temperatures of the contained equipment in real time. DSC [12] controls the CRACs based on these measurements. The servers used in these experiments are located in top half of Rack 10 and the bottom half of Rack 34. We have determined empirically that Rack 10 is cooled mainly by CRAC 3 and CRAC 4 and that Rack 34 is primarily cooled by CRAC 1. We observed that the middle of Rack 10 had lower LWPI values relative to the rest of the rack. This is a result of a network switch in the middle of the rack that exhausts hot air in proximity to the inlets of some servers. Though undesirable, this is a common occurrence in data centers, as it facilitates cable routing. We observed that the bottom of Rack 34 had fairly high LWPI values in general. This is due to ease of cooling locations that are in close proximity to floor vent tiles. Our experiment utilized 20 nodes to host 35 VMs. Among these 20 nodes, there were nine nodes with two Intel Pentium D 3. 2 GHz CPUs and 11 nodes with two Intel Xeon 3. 6 GHz CPUs. All nodes ran SLES 10 SP2 Linux with a Xen 3.2 kernel. Inside the management domain (Domain-0) of each physical
E. Communication between Controllers We implemented a prototype of our solution running in a Xen 3.2 environment. We have a per node sensor that provides resource consumption and a per application sensor that collects response times. We assume a fixed set of applications. Future work will support dynamic service joining/leaving. Messages between controllers are exchanged based on the asynchronous message queue protocol (AMQP), which allows highly efficient communication between loosely connected components. For 4
Response time in ms
node, a node agent exposed an interface for monitoring the node and its VMs and for allocating resources to the VMs. The Xen Credit Scheduler was used and made adjustment of runtime CPU shares for VMs. The node controllers ran inside the management domains, while the application and pod controllers, Daffy and DSC ran on nodes other than these twenty. We define CPU capacity, requests and allocations in units of CPU shares. A CPU share denotes one percentage of utilization of a processor with a clock rate of 1 GHz. A scale factor adjusts for the capacity between nodes with different processor speeds or architectures. In our testbed, the 3.6 GHz CPUs were assigned 360 shares and the 3.2 GHz CPUs were assigned 320 shares. We note that such factors are only approximate; the calculation of more precise scale factors is beyond the scope of this paper. There were two types of applications in our testbed: 3-tier applications and computational workloads. The 3-tier application was a modified version of RUBiS [19]. RUBiS is an on-line auction benchmark comprised of a front-end Apache Web server, a JBoss application server, and a back-end MySQL database server. Each application component ran inside one VM. To emulate a real application with highly dynamic workload, we emulated the demands of a globally-distributed business-critical HP application called VDR [14] by replacing VDR transactions in the original traces with RUBiS transactions of the same rank and replaying the trace. The SLOs of RUBiS were defined as average response time thresholds. The computational application was a single program that consumes specified CPU resources. We used a CPU load trace that varied from 20 to 150 CPU shares to simulate changes of resource demands in real applications. The SLOs of computational applications were specified as CPU utilization targets. Response times for each individual request of RUBiS were logged by the workload generator. Power consumption of a node was estimated as a function of utilization by using linear interpolation between the measured apparent power consumed by the node at idle and its fully utilized state [20]. We recorded directly the reported blower power for the six CRAC units in our data center. We are using blower power as a proxy for cooling power, due to the difficulty of isolating the data center from other uses of our chiller plant. We also recorded the SAT for each CRAC; this will be used later to approximate the balance of the cooling power used by the chiller plant. B. Application Level Performance Management To determine if the application controller and node controller could manage the performance of the RUBiS application under time-varying workloads, we ran experiments driven by the VDR traces. We set the response time targets for the applications to 40 ms. Every 30 s, the application controller computed required CPU utilization targets based on recent workload measurements for the three virtual machines hosting the application tiers. Every 10 s, the node controllers adjusted the CPU shares allocated to virtual machines. Figure 3a shows the response times of the multi-tier application averaged every one minute for a 10 hour experiment. As shown in the figure, most of the time, our controllers maintained the response time below its target. Throughout the experiment period, the average response time was 34 ms and 86% of the requests had response time below the target. The dynamic CPU shares allocated to each VM are shown in Figure 3b. Note that the web tier was always lightly loaded and its CPU share was set to the minimum of 45 CPU shares.
400 300 200 100 Target 0 00:00 01:00 02:00 03:00 04:00 05:00 06:00 07:00 08:00 09:00 10:00 Time
(a) RUBiS Response Time CPU shares
300 250 200
Web Server Application Server Database Server
150 100 50 0 00:00 01:00 02:00 03:00 04:00 05:00 06:00 07:00 08:00 09:00 10:00 Time
(b) Dynamic CPU shares allocated to each component of the application
Fig. 3: Application performance management. C. Integrated Data Center Management In this section, we compare the following four approaches: A: Fixed Approach. CPU shares are dynamically adjusted to meet a specified, constant utilization targets and the workload placement is static. This approach is widely used in production systems such as HP’s gWLM [21] and IBM’s Enterprise Workload Manager [22]. B: Integrated Performance Management. Application controllers and node controllers dynamically allocate CPU resource to meet performance targets, but workload placement is static. C: Integrated IT Management. Similar to approach (B) but with the integration of dynamic workload placement. A pod controller migrates and consolidates workloads when needed. DSC controls cooling resources independently. D: Integrated Data Center Management. Full integration of performance management (application and node controller), dynamic workload placement (pod controller) and cooling management (DSC) as presented in Section II. For each approach, we conducted 10 hour experiments with 20 nodes and 35 VMs—6 for two RUBiS applications and 29 for computational workloads—as described in Section III-A. For each run, we initially placed the workloads onto nodes according to their peak demands. We used a response time target of 40 ms for both RUBiS applications except for approach (A) and a utilization target of 80% for the computational workloads. For the fixed approach (A), operators of systems typically do not know how to set the utilization target from an application level performance target, and often use a default settings provided by a vendor, for instance, 75% in the HP gWLM. In our experiments, we used a more conservative utilization target of 50% for the RUBiS applications. Results show individual 10hour runs consisting of over 1 million requests. Other runs with identical settings showed little variance because test workloads were driven by traces. We plan to validate our controllers on production systems where statistical measures may be more meaningful. Figure 4 shows the aggregate demand in CPU shares of all workloads over time for all experiments. The demand starts out high, drops after 30 minutes, increases around the fourth hour, and drops again afterward. This is typical of day-time demand for business applications that show peaks in the morning and at lunch time. 5
Number of nodes
CPU shares
6000 5000 4000 3000 2000 1000
25 A, B
C
D
20 15 10 5 0 00:00 01:00 02:00 03:00 04:00 05:00 06:00 07:00 08:00 09:00 10:00 Time
0 00:00 01:00 02:00 03:00 04:00 05:00 06:00 07:00 08:00 09:00 10:00 Time Avg server utilization
Fig. 4: Total workload demand.
Total node power in KW
In the following sections, we compare the required IT resources, application performance, server power and cooling power consumption of the four approaches. 1) Computing Resource and Power Consumption: We first compare the computing resources and power consumption from the approaches with static workload placement, i. e., approach (A) and (B), with results from the approaches with dynamic workload placement, i. e., approaches (C) and (D). In (C) and (D), the pod controller is configured to dynamically consolidate workloads and opportunistically turn on or off nodes. As shown in Figure 5, the integrated approaches lead to significant savings of both computing resource and power consumption. Figure 5a shows the number of nodes that were active during the experiments. The numbers were constant in (A) and (B) as workloads were placed onto all nodes at the beginning and all nodes were used. For (C) and (D), the pod controller consolidated workloads and turned off unused nodes when load dropped. Hence, fewer nodes were used compared with (A) and (B). We note that (C) and (D) slightly differed from each other, which resulted from different workload placement decisions made by the pod controller. Figure 5b shows the average server utilization, defined as the ratio of total allocation divided by total capacity of active nodes. The server utilization of (B) was slightly higher than (A) because the application controller in (B) computed lower VM utilization targets than the default 50% used in (A) for the RUBiS applications. However, consolidation in (C) and (D) achieved a much higher server utilization. Keeping the utilization high and turning off unused nodes helped to save power, as shown in Figure 5c. Compared with (A) and (B), the integrated approaches (C) and (D) helped to reduce the total node power consumption by 35% over the 10 hour experiment. 2) Application Performance: Figure 6 shows the Cumulative Distribution Functions (CDFs) for the response times of individual requests from RUBiS applications for the four approaches. The worst performance was achieved by the fixed approach (A) because the 50% utilization targets are too high. The approach (B) which uses the application and node controller with a static workload placement had the best performance. Compared with (A), approach (B) was able to derive the appropriate utilization targets from the performance targets through the performance model. Furthermore, the initial placement of the workloads was based on their peak demand, thus most requests from the node controllers could be satisfied. The RUBiS performance from the approaches (C) and (D) were comparable to that of (B), but with much less computing resources and power consumption. The performance fell slightly because there was less excess capacity available on the nodes due to workload consolidation, and performance suffered for short intervals on overloaded nodes until the pod controller was able to re-balance the workloads. Similar results (not shown) were obtained for the computation workloads. For these workloads, the average server utilizations of (C) and (D) were 81.6% and 80.4% respectively compared
(a) Number of running nodes. 100% A B C D
80% 60% 40% 20%
0% 00:00 01:00 02:00 03:00 04:00 05:00 06:00 07:00 08:00 09:00 10:00 Time
(b) Average node utilization. 6 A B C D
5 4 3 2 1
0 00:00 01:00 02:00 03:00 04:00 05:00 06:00 07:00 08:00 09:00 10:00 Time
(c) Total power consumption of nodes.
Fig. 5: Integrated workload management. 1
CDF
0.8 0.6 A B C D
0.4 0.2 Target 0 0
200
400 600 Response time in ms
800
1000
Fig. 6: CDF of RUBiS response times. with 80% in (A) and (B). In summary, the integrated approaches (C) and (D) managed to significantly reduce required computing resources and server power consumption without significantly compromising the application performance. 3) Cooling Resource Consumption: Figure 7 shows results of cooling management achieved by integrated IT and cooling management in approach (D), compared to that in (C) where IT management and cooling control operated independently from each other. For the approach (C), the pod controllers dynamically consolidated workloads and shutdown nodes without considering the cooling efficiency of nodes and without direct communication with Daffy. In our fully integrated approach (D), the pod controller monitored LWPI and always placed workloads onto nodes with the highest LWPI values. Moreover, the pod controller informed Daffy which nodes were running and which nodes were off. Daffy then directed DSC to adjusting cooling resources accordingly. Figure 7a compares the mean LWPI value of all active nodes used by the integrated management (D) with the average LWPI value of all nodes available in the experiment. As shown in the Figure, the integrated approach (D) always placed and consolidated workloads onto nodes with better cooling efficiency, i. e., higher LWPI values. Recall that workloads were initially placed on nodes in both Rack 10 and 34. Due to the switch that exhausts hot air into the cold aisle of Rack 10, the nodes 6
Mean LWPI value Total blower power in KW
TABLE I: Summary of the results
14 All nodes 12 Active nodes 10 8 6 4 2 0 -2 00:00 01:00 02:00 03:00 04:00 05:00 06:00 07:00 08:00 09:00 10:00 Time
(a) Cooling efficiency of nodes.
Approach
App. Perf.
A: Fixed approach B: Integrated Performance mgmt. C: Integrated IT mgmt. D: Integrated data center mgmt.
61% 79% 70.1% 70.1%
Server power 3.81 3.87 2.61 2.47
KW KW KW KW
Blower power 24.7 24.7 24.7 20.9
KW KW KW KW
deployed application controllers to dynamically adjust utilization targets of the RUBiS application such that response time targets can be met. This improved the performance of RUBiS applications and 79% of requests had response times below the target, 18% more than in (A). The integration of the pod controller helped to significantly reduce computing resources and node power usage with some performance loss as discussed in section III-C2. The average power consumption of the IT infrastructure from (C) and (D) was reduced by 35% compared to (A) and (B) and the average saving per server was 70 W. We anticipate substantial savings when our approach is extended to more servers in the data center. Although in our experiments we managed a small fraction of the data center, the integrated management approach (D) reduced the CRACs blower power consumption by 15% over the 10 hour experiment. However, blower power represents only a fraction of the total power consumption from the cooling infrastructure. The majority of the power consumption takes the form of thermodynamic work performed by the central chiller plant that provides chilled water to the CRACs. As discussed earlier, this is difficult to isolate and measure directly. From earlier experience [23], we used the CRAC SATs to estimate the thermodynamic work and determine the total power (blower power and chiller power). The savings were found to be 38 KW over the 10 hour experiment. This represents a 16% savings in total cooling power consumption.
35 C 30 D 25 20 15 10 5 0 00:00 01:00 02:00 03:00 04:00 05:00 06:00 07:00 08:00 09:00 10:00 Time
(b) Data center blower power.
Fig. 7: Integrated IT and cooling management. there are harder to cool and thus have lower LWPI values. The disparity between LWPI values for nodes in Rack 10 and 34 drove consolidation towards nodes in Rack 34. As shown in the figure, at time 01:00 and time 06:00, the mean LWPI value across active nodes increased as the pod controller moved all VMs from Rack 10 to Rack 34 and powered off Rack 10 nodes that had lower LWPI values. The total power consumed by the blowers for the six CRAC units in the data center is shown in Figure 7b. Without the integration of IT and cooling, the blower power from (C) was constant at about 24.7 KW over the experiment period. Compared with (C), our fully integrated solution (D) managed to reduce total blower power consumption on average by 15% over the 10 hour experiment. The saving was achieved through the interaction of IT and cooling management. In (D), when workload demand dropped at time 01:00 and 06:00, the pod controller consolidated workloads onto nodes in Rack 34 (with higher LWPI values) and shutdown nodes in Rack 10 (with lower LWPI values) and notified Daffy of these changes. Daffy then directed DSC to adjust cooling accordingly. As shown in the figure, the integrated solution (D) reduced the average blower power consumption up to 8 KW, more than 30% compared with that with (C) when the workloads were consolidated (e.g., time 1:00–3:00 and 6:00–10:00) without regard to cooling considerations. We note that though we only managed a small part of the overall data center in this experiment, the savings through the integration of IT and cooling management were significant, because blower power of a CRAC is a cubic function of blower speed, and a small number of hot spots in the data center can dominate the cooling necessary.
IV. R ELATED W ORK Traditional IT management solutions often over-provision IT resources, sometimes by large amounts, in order to satisfy application performance requirement such as end-to-end response time thresholds. Virtualization techniques provide mechanisms for workload management that can provide resources to applications on their demand. Workload may be consolidated based on prediction of their demand in the future [8], [9]. When application performance such as response time has to be guaranteed, performance models [6], [7] can be applied to predict the resource requirement to meet the performance target. Recently control theory has been used for design of controllers that can respond to the time-varying work through dynamic resource allocation [24]. However, none of the previous work has integrated dynamic resource allocation and virtual machine migration for application performance management; nor does it consider the impact of workload consolidation on the overall energy efficiency of data centers. The increasing cost of energy has given rise to a number of studies on power issues [10], [11]. A few have investigated minimizing power consumption while simultaneously meeting performance constraints [10], [25], but these efforts do not in general deal with the substantial power required by the cooling infrastructure, despite cooling being a major consumer of power in data centers [2], [5]. VMware [26] has Distributed Power Management that consolidates workloads through live
D. Summary Table I summarizes the performance and power results of the four approaches over the 10 hour experiments. The column “App. Perf.” shows the percentage of requests that were below the response time target for RUBiS. “Server power” means the mean total power consumption of all the 20 nodes in the testbed and the column “Blower power” shows the total power consumption of the six CRAC units in the data center. The results from the fixed approach (A), which employs fixed utilization targets for the workloads, are taken as the baseline. Note that this approach is widely used in today’s production systems. The integrated performance management approach (B) 7
virtual migration and suspends idle machines. However, no consideration is made of the impact of migrations—dynamic workload placement—on application performance and the underlying cooling infrastructure. Research has also begun in recent years on active control strategies for thermal management within the data center [12]. A few researchers have studied the management of temperature and cooling costs [4], [5], [12]. However, since these solutions lack integration with IT management, they only solve part of the problem and cannot take full advantage of energy savings. The lack of IT information prevents thermal management solutions from making better or smarter decisions, e. g., reducing the output of appropriate CRAC units in response to reduced IT workloads within a cooling zone. In [18], we integrated feedback control and performance model-based prediction for application performance management but only through dynamic resource allocation. An automated IT resource and workload management system for data centers was proposed in [27], but it did not take into account either application performance or cooling management. In [10], we studied the unified workload and power management for server enclosures through dynamic voltage scaling, workload consolidation, and active fan control. End-to-end application performance was not considered either. In [4], a cooling-aware workload placement and migration solution has been developed and evaluated in a data center environment, but it did not attempt to enforce compliance to SLAs. The existence of these individual controllers [4], [27], [28], [18] does not imply a working integrated system. Further, prior integrations have been partial and ad-hoc. None have considered application performance and energy efficiency together. The proposed solution provides full integration of performance, workload migration, power and cooling management in a systematic and automatic way. The novelty lies in linking IT and facility controllers to act in a coordinated manner. The proposed hybrid data model and Daffy address this.
[2] “Report to congress on server and data center energy efficiency, public law,” U.S. Environmental Protection Agency, ENERGY STAR Program, Aug. 2007. [3] G. Linden, “Make data useful,” http://glinden.blogspot.com/, 2006. [4] C. E. Bash, C. Hyser, and C. Hoover, “Thermal policies and active workload migration within data centers,” in Proc. of ASME InterPACK Conf., San Francisco, CA, 2009. [5] C. D. Patel, R. K. Sharma, C. E. Bash, and A. Beitelmal, “Thermal considerations in cooling large-scale high compute density data centers,” in Proc. of the 8th Intersociety Conf. on Thermal and Thermomechanical Phenomena (ITHERM), San Diego, CA, 2002. [6] I. Cunha, J. Almeida, V. Almeida, and M. Santos, “Self-adaptive capacity management for multi-tier virtualized environments,” in Proc. of the 10th IFIP/IEEE Symposium on Integrated Management (IM), May 2007. [7] G. Khana, K. Beaty, G. Kar, and A. Kochut, “Application performance management in virtualized server environments,” in Proc. of the IEEE/IFIP Network Operations & Management Symposium (NOMS), Apr. 2006. [8] D. Gmach, J. Rolia, L. Cherkasova, and A. Kemper, “Capacity management and demand prediction for next generation data centers,” in Proc. of the IEEE Int. Conf. on Web Services (ICWS), Salt Lake City, Utah, USA, 2007, pp. 43–50. [9] D. Gmach, J. Rolia, L. Cherkasova, and A. Kemper, “Workload analysis and demand prediction of enterprise data center applications,” in Proc. of the IEEE Int. Symposium on Workload Characterization (IISWC), Boston, MA, USA, Sep. 2007, pp. 171–180. [10] N. Tolia, Z. Wang, P. Ranganathan, C. Bash, M. Marwah, and X. Zhu, “Unified thermal and power management in server enclosures,” in Proc. of the ASME InterPACK 2009, San Francisco, CA, USA, Jul. 2009. [11] P. Ranganathan, P. Leech, and J. Chase, “Ensemble-level power management for dense blade servers,” in Proc. of the 33rd annual International Symposium on Computer Architecture (ISCA), 2006. [12] C. E. Bash, C. D. Patel, and R. K. Sharma, “Dynamic thermal management of aircooled data centers,” in Proc. of the Intersociety Conf. on Thermal and Thermomechanical Phenomena in Electronic Systems (ITHERM), San Diego, CA, 2006. [13] “Xenserver,” http://www.citrixxenserver.com/products/Pages/ XenEnterprise.aspx. [14] C. Stewart, T. Kelly, and A. Zhang, “Exploiting nonstationarity for performance prediction,” ACM SIGOPS Operating Systems Review, vol. 41, no. 3, 2007. [15] C. E. Bash and G. Forman, “Data center workload placement for energy efficiency,” in Proc. of ASME InterPACK Conf., Vancouver, Canada, 2007. [16] Y. Chen, S. Iyer, A. Sahai, and D. Milojicic, “A systematic and practical approach to generating policies from service level objectives,” in Proceedings of the 11th IFIP/IEEE International Symposium on Integrated Network Management (IM 2009), 2009. [17] B. Urgaonkar, G. Pacificiy, P. Shenoy, M. Spreitzery, and A. Tantawi, “An analytical model for multi-tier internet services and its applications,” in Proc. of ACM SIGMETRICS, 2005. [18] Z. Wang, Y. Chen, D. Gmach, S. Singhal, B. J. Watson, W. Rivera, X. Zhu, and C. D. Hyser, “Appraise: Application-level performance management in virtualized server environments,” HP Labs, Tech. Rep. 166, 2009. [19] “Rubis rice university bidding system,” http://www.cs.rice.edu/CS/Systems/ DynaServer/rubis. [20] R. Raghavendra, P. Ranganathan, V. Talwar, Z. Wang, and X. Zhu, “No ”power” struggles: Coordinated multi-level power management for the data center,” in Proc. of the 13th Int. Conf. on Architectural Support for Programming Languages and Operating Systems (ASPLOS), Mar. 2008. [21] “HP Global Workload Manager (gWLM),” http://mslweb.rsn.hp.com/gwlm/ index.html. [22] “IBM Enterprise Workload Manager,” http://www-03.ibm.com/servers/ eserver/zseries/zos/ewlm. [23] M. Beitelmal and C. E. Bash, “Optimizing centralized chiller system performance for dynamic smart cooling,” HP Labs, Tech. Rep. 41, 2007. [24] P. Padala, K. Hou, X. Zhu, M. Uysal, Z. Wang, S. Singhal, A. Merchant, and K. Shin, “Automated control of multiple virtualized resources,” in Proc. of the EuroSys 2009, Nuremberg, Germany, Mar. 2009. [25] J. O. Kephart, H. Chan, R. Das, D. Levine, G. Tesauro, F. Rawson, and C. Lefurgy, “Coordinating multiple autonomic managers to achieve specified power-performance tradeoffs,” in Proc. of the 4th IEEE Int. Conf. on Autonomic Computing (ICAC), Jun. 2007. [26] “VMware ESX Server,” http://vmware.com/products/vi/esx/. [27] X. Zhu, D. Young, B. J. Watson, Z. Wang, J. Rolia, S. Singhal, B. McKee, C. Hyser, D. Gmach, R. Gardner, T. Christian, and L. Cherkasova, “1000 islands: Integrated capacity and workload management for the next generation data center,” in Proc. of the 5th IEEE Int. Conf. on Autonomic Computing (ICAC’08), Chicago, IL, USA, Jun. 2008. [28] J. Moore, J. Chase, P. Ranganathan, and R. Sharma, “Making scheduling cool: Temperature-aware workload placement in data centers,” in Proc. of USENIX Annual Technical Conference, 2005.
V. C ONCLUSIONS AND F UTURE W ORK Data centers are a mix of IT, power and cooling infrastructure. Data center management requires management of IT resource allocation, workload, and power and cooling management. When these management functions are performed independently, particularly without regard to the interaction of IT resource and cooling elements, it is impossible to meet SLAs and achieve near optimal energy savings. This paper presents an integrated solution that tightly couples IT management and cooling infrastructure management to improve overall efficiency of data center operation. Future work will consider the integration of finer power control, such as dynamic CPU speed scaling. We are also planning to look at other IT resources (e. g., memory, networking and storage) in addition to CPU. Other interesting research topics include the incorporation of additional SLO metrics like availability and reliability to our model, and the management of workload across data centers. R EFERENCES [1] C. D. Patel, R. K. Sharma, C. E. Bash, and M. Beitelmal, “Energy flow in the information technology stack: Coefficient of performance of the ensemble and its impact on the total cost of ownership,” HP Labs, Tech. Rep. 55, 2006.
8