Automated Data Acquisition and Monitoring
Integrating Automated Data Acquisition Technologies for Progress Reporting of Construction Projects Samir El-Omari1 and Osama Moselhi2 1 P. Eng., Assistant Professor, Department of Building, Civil and Environmental Engineering, Concordia University, 1455 De Maisonneuve Blvd. W., Montreal, Quebec H3G 1M8, Canada,
[email protected] 2 P. Eng., Professor, Department of Building, Civil and Environmental Engineering, Concordia University, 1455 De Maisonneuve Blvd. W., Montreal, Quebec H3G 1M8, Canada,
[email protected]
Abstract Controlling construction projects necessitates controlling their time and cost in an effort to meet the planned targets. Management needs timely data that represent the status of the project to take corrective actions, if needed. This paper presents a control model that integrates different automated data acquisition technology to collect data from construction sites required for progress measurement purposes. Current automated data acquisition technologies are described, and their suitability for use in tracking and controlling construction activities is assessed. This includes bar coding, Radio Frequency Identification (RFID) 3D laser scanning, photogrammetry, multimedia, and pen-based computers. The user can move with a tablet PC in the construction site and record, take snapshots and also hand written comments about activities on site. The proposed cost/schedule control model Integrates with the automated data acquisition technologies, a planning and scheduling software system, a relational database, and AutoCAD to generate progress reports that can assist project management teams in decision making.
Keywords: 3D laser scanning, photogrammetry, RFID, Tablet PC, Bar Coding progress reporting, data acquisition, automation 1.
Introduction
The earned value technique is widely used for periodic monitoring of actual expenditures and physical scope accomplishment and, accordingly, for generating period-by-period progress reports. These reports are commonly developed by essentially comparing the collected actual data pertinent to work performed on site to that planned. The reliability of these progress reports depends primarily on the accuracy, and timeliness collection of actual data that depicts work progress on site. This paper presents a control model that integrates different automated data acquisition technologies including bar coding, Radio Frequency Identification (RFID) 3D laser scanning, photogrammetry, multimedia, and pen-based computers to collect actual data from construction sites to generate progress reports. To do so, the characteristics of different automated data acquisition technologies were studied and analyzed. This includes their capabilities and limitations and their respective suitability to track various construction operations. Experiments were conducted to study the applications of different automated data acquisition technologies and explore the most suitable IT platform for integrating them in one tracking and control system Each automated technology, is used for a certain construction task on site. For example, 3D scanner or LADAR (laser distance and ranging) was integrated together with photogrammetry to rapidly track changes of quantities of work accomplished such as excavation works. Integrating these two technologies alleviates limitations associated with each of them individually such as the number of scans required and the time needed for each scan to produce acceptable results during the 3D modeling process. It also overcomes limitations associated with photogrammetry when modeling 3D images of objects with unclear geometrical properties as in the case of earthmoving operations where modeling 3D images from digital photo images becomes difficult and the presence of a scanned image can be helpful. Bar coding and RFID are utilized for material and labor tracking. In the reporting stage, more photo images would be more desirable. Pen-based or tablet computer is utilized as the main interface tool with the user [1]. 86
26th International Symposium on Automation and Robotics in Construction (ISARC 2009)
2.
Proposed Control Model
A project control system establishes guidelines for effective cost and schedule control. As mentioned earlier, data collection is a crucial step in the tracking control process. Considerable work has been carried out to utilize various automated data acquisition technologies for the purpose of data collection [2], [3], [4], [5], [6]. For example in Abudayyeh’s model [7], the bar code technology was used in acquiring construction data from site. In some other cases, these technologies were used for the purpose of inventory or inspection. The proposed model integrates different automated data acquisition technologies. Construction data is collected from site and stored into a centralized database for later use in generating progress reports. The system is designed from the contractors’ point of view to help track their projects in a timely manner. It also allows owners to have a closer look over the project. Pen-based or tablet computer is utilized as a media of integration. An interface software application was developed using Microsoft Access. With this application, actual data related to each activity on the job site is collected using a pen-based computer, RFID, bar coding, LADAR, or multimedia information in form of voice records or video tapes. 3.
Study and Evaluation of Site Data Acquisition Technologies
This research study involved experimenting with different hardware and software systems. This section presents the work conducted on laser scanning, photogrammetry, and RFID to find the best combination that would provide the desired results. Comparisons with other available tested components are presented and the reasons behind the selection of the components used in the developed system are highlighted. Table 1 provides a comparison between the proposed model and other available integration models and systems. The comparison was carried out with respect to the purpose and essential characteristics of each model and system Included in the comparison are the Building Information Modeling (BIM) [8], Documentum by EMC Corporation [9], Coreworx from Software Innovation Inc. [10], and PM+ of SNC-Lavalin [11]. BIM includes geometry, spatial relationships, geographic information, quantities and properties of building components. It extracts the information from design drawings and models it in 3D images to represent the site conditions and also calculate quantities of work performed. Future research could integrate features of the proposed system with BIM in regard to collecting actual information from the construction site [12], [13], [14]. Documentum is document management software and it manages document content and attributes such as check-in, check-out, and version management. The purpose of proposed system isn’t document control, but to assist in collecting and processing near real time data from construction sites such as labor or equipment hours to update the project schedule and generate progress reports. Coreworx is similar to Documentum, it automates document control functions, such as, version control, approval workflows, transmittal receipt/generation and built-in document reporting. PM+ developed by SNC-Lavalin manages progress payments for suppliers and sub-contractors but it doesn’t automate the process of data collection as in the case of the proposed control system. Data pertinent to material usage and labor and equipment hours are entered in PM+. PM+ also has a document control module but it doesn’t store the documents in the software, it only provides information on the physical location of the document. From the comparison above, it can be noted that the proposed system utilizes different technologies for data collection needed to update the project schedule. This feature is not available in the other systems included in Table 1. 4.
Laser Scanning
Laser scanning operation components include a scanner, which is connected to a laptop computer through a serial connector type RS-232 or RS-422 depending on the scanner type or through a TCP/IP network cable. The scanner cannot operate without a scanning software installed on the laptop and that is the reason for the presence of the laptop. The scanning software can enhance the scanned image, such as removing destructing points caused by some obstacle from the point cloud image, before exporting it to the modeling software application, which is the last step in the 3D scanning operation. The triangulation based laser scanning technology was developed as early as 1978 and the National Research Council of Canada was among the first institutes to develop it [17]. 3D scanning equipments evolve very rapidly. Table 2 provides information on some of the currently available 3D scanners. Scanner speed (how many points per second can it reads), range (distance from the scanner to the object to be scanned), and accuracy are important 87
Automated Data Acquisition and Monitoring
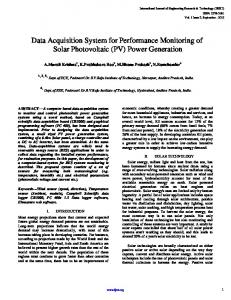
factors that are considered in new scanners. The scanner employed in this research was purchased in 2002 and it was one of the most advanced scanners at that time. Since then scanners have improved dramatically in their speed and accuracy but their prices remain a major limitation. The proposed control system utilized 3D scanners for progress measurement purposes. During the pace of this study, some software systems were experimented with and it was decided to integrate photogrammetry to enhance the productivity and accuracy of 3D modeling for progress measurement purposes [15], [16]. The reason for this integration is to reduce the number of scans required, as more information can be extracted from the photo images. It also helps in modeling 3-D images without the need to acquire point cloud images with high accuracy. Photo images are taken with a regular digital camera to assist in modeling 3-D images. The method is explained by the authors in [16]. Figure 1 illustrate the 3D modeling process currently undergoing to extract quantities of HVAC ducts in a building construction project. Table 1 Comparison between the proposed model and others
88
26th International Symposium on Automation and Robotics in Construction (ISARC 2009)
Figure 1 3D modeling from scanned and digital images
Table 2 Laser scanners comparison
5.
Bar Coding and RFID
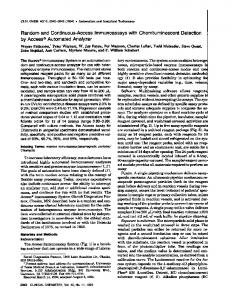
The application of bar coding and RFID required thorough investigation of the available equipments in the market. RFID readers are either fixed readers, which are known as stand-alone readers, hand held readers and vehicle mounted readers. All three types of readers can be utilized for progress measurement through reading RFID tags of resources to update their working hours. The RFID technology grows fast and will soon replace bar-code technology when the price of utilizing it competes with bar coding technology. A Hand-held RFID reader was purchased for this research because it can read bar-code and RFID tags. The reader IP4 is from Intermec Inc. [18], [19] it combines a RFID reader and the 751A mobile computer, which makes it capable of reading RFID and bar-code tags as well. The operating system for 751A is Microsoft Windows for pocket PC. Intermec readers use the basic reader interface (BRI) command-language that enable to read RFID tags and write information on them. The users must develop a user interface designed for their needs with programming languages like C#, C/C++, .NET or Java and use BRI commandlanguage for tasks to be performed by the RFID reader. Figures 1 to 5 illustrate a demo application for reading and writing on RFID tags using the BRI command language. Intermec have recently developed mobile computer (CNe and CNe3) [19] with GPS capability that can be attached to the new IP30 RFID reader. GPS RFID tags are now available in the market to easily identify the location of the tag (IDENTEC SOLUTIONS) [20].
89
Automated Data Acquisition and Monitoring
Figure 2 BRI demo from Intermec start screen
Figure 3 BRI demo setting screen
Figure 4 BRI demo RFID tag reading 6.
Figure 5 BRI demo write on RFID tags
Components and Data Flow of the Developed Model
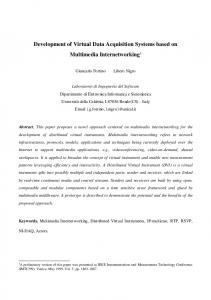
The system integrates through its pen-based computer environment, RFID, bar coding, LADAR and multimedia technologies to automate data acquisition. At its core is a relational database, used to organize and store the collected data. An interface software application is developed in the pen-based computer environment (Fujitsu - Stylistic ST4121B). The developed interface integrates different construction management software applications such as Primavera Project Planner, Microsoft project, AutoCAD, Microstation and other software applications such as PHIDIAS, which is capable of integrating and modeling photo images together with scanned images acquired using the LADAR (LPM 100 VHS). In the proposed system, scanned images are modeled with the support of digital photo images to produce 3D images of the scanned object, which are then used to estimate quantities of work performed. The layout of the proposed control system is shown in Figure 6 [1], [21]. Data pertinent to equipment working hours, labor hours and material consumption are collected using the developed system. Scanned and digital images are modeled to determine quantities of work performed and subsequently calculate percent of work complete. Percent (%) complete can also be determined through templates, which assign different weight to the subtasks involved in the activity being tracked [22]. During the process of data acquisition, the user can access AutoCAD drawings related to the activity in-progress and record notes for any changes occurred to help in the preparation of as-built drawings. Information needed in the future about the performance of the project within a specified period can, accordingly, be retrieved for later use. Clearly, the EV concept works well if the data needed to generate that type of control are accurately collected in a timely manner. Traditionally, actual data pertinent to material use, man-hour, and/or equipment use, is collected manually by filling forms 90
26th International Symposium on Automation and Robotics in Construction (ISARC 2009)
on site and then feeding the collected data into a computer in the office. This is not only time consuming but also is susceptible to human error, and may lack consistency and reliability. The proposed system aims at alleviating these shortcomings by incorporating the automated data acquisition technologies described in [1], [15], [16], [18], [21]. 7.
Proposed Model’s Database
The database of the system was designed to organize and store data collected from construction sites that support the management functions of the proposed model [1]. The database is of a relational type, and consists of 37 entities or tables. The entity relationship diagram is shown in Figure 7. The database was implemented in Microsoft Access to facilitate the interaction with scheduling software systems such as Microsoft Project and Primavera systems. The main entities of the database are Projects, Activities, Labors, Equipment, Materials, Photos, Sound, Videos, 3D Images and Drawings. The attributes of these entities are listed in Figure 7. A “Time Sheet” entity was constructed to store daily start and finish time of labors and equipments. Other entities were designed such as the “Activity Drawings” entity, which holds the primary keys of the “Activities” and “Drawings” entities, to realize the many-to-may relationship between both activities. Other types of relationships that exist beside many-to-many are the one-to-many as in the case of Projects and Activities because a project can have many activities and an activity belongs only to one project. To update planned information, data had to be first imported from the output of the scheduling software such as Microsoft Project. Microsoft Project can export data in ACCESS type files. An example was performed on the JMSB project currently under construction at the University to export planned data, update it, and send it back to Microsoft Project. To update the proposed system’s database with information imported from the scheduling software, a number of queries were developed using SQL language. A list of forms was designed to facilitate the interaction process with the user. The user starts by a validation process of his username and password. Upon granting access, the user is prompted with the main screen shown in (see Figure 8) that includes the list of forms available is prompt so that the user can start first by selecting the project he wants to invoke. The project form, shown in Figure 9, includes project information such as its duration, and start and finish time. A list of projects is available to choose from in the project dropdown menu. The user then can access the project’s activity by selecting the activity command button in the project form or from the main screen. The control process is performed on the activity level where hours spent on that activity such as labor hours has to be reported. This can help in integrating cost and time reporting. Clearly, once the data becomes available at that detailed level, it could be rolled up at the cost account or work package level. The activity form, shown in Figure 10, includes, aside from the activity information, command buttons to invoke different forms and queries. This query updates the fields: “Description”, “Duration”, “Start Date”, and “Finish Date” with those imported from the project’s schedule and with the activity ID set as criteria. Organizing collected data is a very important step and it facilitates future retrieval of this data, which can help not only in progress reporting but also in management of claims and in production of as-built drawings. If for example, a note was written regarding a particular problem related to an activity that has to do with weather condition during the data collection process then, this note is stored with its ID in the “Notes” entity along with its date and time. A link was established between the “Notes” entity and the note files so as to minimize the size of the database. Similarly, links were also constructed between photograph, video clips, drawings, and 3D modeled images and their respective “Photos”, “Videos”, “Drawings” and “3D Images” entities. The “Quantity to Date” attribute of the “Activity” entity is to register updated quantity of work accomplished. This quantity is calculated using modeled 3D scanned images merged with digital photo images as explained earlier. The “3D image” entity includes 3D modeled images that are linked with different activities to illustrate the current status of the project. After updating data of the activities involved during a reporting period, the database of Microsoft Project is then updated using update queries in a reverse way to that performed at the beginning and exported to the project schedule. EV analyses are performed in Microsoft Project using the calculated quantities of work accomplished described above and progress reports are generated. Additional reports such as notes, and photographs are also generated using the proposed system to highlight critical problems.
91
Automated Data Acquisition and Monitoring
Figure 6 Proposed system architecture
Figure 7. ER-Diagram of Developed Database 8.
Conslusions
This paper presented the layout of an IT-platform, designed to facilitate automated data acquisition from construction sites to support efficient time and cost tracking and control of construction projects. The paper also described the proposed cost/schedule control system main components. A set of automated data acquisition technologies was briefly described and their potential use in construction highlighted. The system presented in the paper is capable of capturing text, numerical and graphical data to report efficiently on the project progress. Integrating Laser scanning and photogrammetry was necessary to overcome limitations associated with both technologies. The authors described this integration in [1]. Database was designed to assist management teams in performing project tracking and control functions in an efficient manner, and in 92
26th International Symposium on Automation and Robotics in Construction (ISARC 2009)
management of construction claims. The proposed model’s database was described and its main entities were highlighted.
Figure 8 EPC Track switchboard
Figure 9 Projects form
Figure 10. Activity form 93
Automated Data Acquisition and Monitoring
Acknowledgements The authors would like to acknowledge the financial support provided by the National Science and Engineering Research Council of Canada in the form of operating grant
References [1] El-Omari, S., 2008. Automated Data Acquisition for Tracking and Control of Construction Projects, Ph.D. thesis presented to the department of building, civil and environmental engineering at Concordia University Montréal, Québec, Canada [2] Akinci, B., Patton, M., Ergen, E. (2002). “Utilizing Radio Frequency Identification on Precast Concrete Components-Supplier’s Perspective.” Proc. Of the 19th International Symposium on Automation and Robotics in Construction., NIST, Gaithersburg, MD, September 2002. [3] Perera, A., Imriyas, K. (2004). ”An Integrated Construction project cost Information System Using MS Access and MS Project.” J. of Constr. Mgmt and Economics, 22, 486-502. [4] Shashi, M., Jain, K (2007).” Use of Photogrammetry in 3d Modeling and Visualization of Buildings.” ARPN J. of eng and app sci , 2, NO. 2, APRIL 2007 [5] Du, J., C., Teng, H., C., 2007. 3D Laser Scanning and GPS Technology for Landslide Earthwork Volume Estimation. Automation in Construction, 16 (2007) 657 – 663. [6] Jaselskis, E. (2003). “Implementing Radio Frequency Identification in the Construction Process.” J. Constr. Engrg. and Mgmt, ASCE, 129(6), 680-688. [7] Abudayyeh, O., 1991. “An Automated Data Acquisition and Data Storage Model for Improving Cost and Schedule Control,” Ph.D. thesis presented to the department of civil engineering at the North Carolina State University [8] Eastman, C., Teicholz, P., Sacks, R., Liston, K., 2008 “BIM Handbook: A Guide to Building Information Modeling for Owners, Managers, Designers, Engineers and Contractors”, John Wiley & sons, 2008. [9] EMC, http://www.emc.com/products/family/documentum-family.htm [10] Software Innovation Inc., http://www.softinn.com/ [11] SNC-Lavalin, http://www.snc-lavalin.com/ [12] Lee, G., Sacks, R., Eastman, C. M. 2006. “Specifying parametric building object behavior (BOB) for a building information modeling system”. Automation in Construction, 15(6), 758-776. [13] Holness, G., 2008, "Building Information Modeling Gaining Momentum." ASHRAE Journal. Pp 28-40. June 2008. [14] Eastman, C., Teicholz, P., Sacks, R., Liston, K., 2008 “BIM Handbook: A Guide to Building Information Modeling for Owners, Managers, Designers, Engineers and Contractors”, John Wiley & sons, 2008. [15] El-Omari, S., Moselhi, O., (2007). “Hybrid Methodology for Automated Collection of Data from Construction Sites” International Symposium on Automation & Robotics in Construction ISARC 2007 Kochi, Kerala, India [16] El-Omari, S., Moselhi, O., (2008) “Integrating 3D Laser Scanning and Photogrammetry for Progress Measurement of Construction Work”, Automation in Construction, 18 (2008) 1–9 [17] Mayer, R. (1999), “Scientific Canadian: Invention and Innovation From Canada's National Research Council”, Vancouver: Raincoast Books, 1999. [18] Moselhi, O., El-Omari, S. (2006). “Integrating Bar Coding and RFID to Automate Data Collection from Construction Sites”, Joint International Conference on Computing and Decision Making in Civil and Building Engineering, ASCE, June 14-16, 2006, Montreal, Canada. [19] Intermec Inc., http://www.intermec.com/ [20] Identec Solutions, http://www.identecsolutions.com [21] Moselhi, O., El-Omari, S., (2005), “The Use of 3D Scanners for Automated progress Reporting on Construction Activities”, AACE 49thInternational Annual Meeting, 2005, New Orleans, Louisiana [22] Moselhi, O. (1993). “Applied Earned Value for Project Control.” CIB W-65, Trinidad, W. I., 869-879.
94