Neural Networks, Vol. 8, No. 7/8, pp. 1143-1152, 1995
Pergamon os93-6oso(9s)ooo67-4
Copyright © 1995 Elsevier Science Lid Printed in Great Britain. All fights reserved 0893-6080]95 $9.50 + .00
1995 S PECIA L ISSU E
Integrating Neural Networks with Image Pyramids to Learn Target Context PAUL SAJDA, CLAY D . SPENCE, STEVE HSU AND JOHN C . PEARSON David Sarnoff Research Center (Received 28 October 1994; revised and accepted 21 April 1995) AImtraet--The utility o f combining neural networks with pyramid representations f o r target detection in aerial imagery is explored. First, it is shown that a neural network constructed using relatively simple pyramid features is a more effective detector, in terms o f its sensitivity, than a network which utilizes more complex object-taned features. Next, an architecture that supports coarse-to-fine search, context learning and data fusion is tested. The accuracy o f this architecture is comparable to a more computationally expensive non-hierarchical neural network architecture, and is more accurate than a comparable conventional approach using a Fisher discriminant. Contextual relationships derived both from low-resolution imagery and supplemental data can be learned and used to improve the accuracy o f detection. Such neural network/pyramid target detectors should be useful components in both user assisted search and fully automatic target recognition and monitoring systems.
Keywords----Context learning, Image pyramids, Hierarchical neural networks, Coarse-to-fine search, Object-tuned features, Eigenspace decomposition, Data fusion.
areas that are near roads. Analysts quickly scan for such regions and then analyze them in detail. We are developing techniques that can automatically learn these kinds o f contextual relationships from imagery and supplemental image-registered data, such as maps. Neural networks and pyramid representations are complementary techniques for this kind o f problem. Neural networks are good for learning ill-defined relationships from noisy examples, including relationships between disparate data types. Pyramids are compact, multi-scale representations that produce good textural features for landscape characterization (Lane et al., 1992). They also support efficient coarseto-fine search (Burt, 1998a, b). Neural networks do not scale well with input dimensionality (target size), but this can be mitigated with multi-scale representations. Both neural networks and pyramids also map well onto relatively inexpensive, fast hardware for high-throughput applications. The paper is organized as follows. Section 2 describes the blob-based receiver operating characteristic method we developed and used to assess detection accuracy. Section 3 tests whether a neural network can extract target related data from the kind of relatively simple, generic features in pyramid representations. The performance of the pyramid
1. I N T R O D U C T I O N Detecting a specific class o f relatively small and sparsely distributed man-made objects in large aerial images is a challenging problem that has yet to be fully automated. In addition to the inherent difficulties o f small size and large search space, other confounding factors include variations in imaging conditions, occlusion, camouflage. The objects of interest may also be collections o f smaller objects, such as building clusters, with no easily defined relation between the parts. This paper reports our first efforts toward developing neural-network/pyramid techniques for problems of this kind. Our approach is motivated by the simple observation that image analysts utilize the context of the surrounding landscape and other manmade objects and artifacts. F o r example, a certain target might tend to be found in clearings in wooded Acknowledgements: This work was funded under ARPA contract No. N00014-93-C-0202and a contract from the National Information Display Laboratory. We would like to thank P. Anandan, Peter Burt, Jack Rudnick and Lambert Wixsonfor many helpful discussions. Request for reprints should be sent to Dr Paul Sajda, David Sarnoff Research Center CN5300, Princeton, NJ 08543, USA; E-mail
[email protected]. 1143
P. Sajda et al.
1144
features is compared with more complex, objecttuned features derived from principle component analysis. Sections 4-6 test a hierarchical neural network architecture that supports coarse-to-fine search, context learning and data fusion. Comparison are made with non-hierarchical neural network architectures and with a more conventional method utilizing linear discriminant techniques. Our region detecting system could be used as a first step in a fully automatic target recognition system, which is followed by other more computationally expensive target identification methods, such as model-based approaches. Our system could also be used to pre-screen large volumes of imagery in analyst applications.
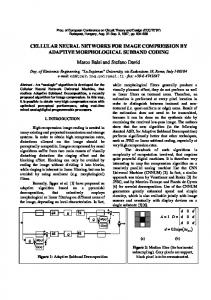
2. ROC ANALYSIS We use a receiver operating characteristic (ROC) analysis to measure the performance of our various detectors. An ROC curve is a parametric plot of falsepositive versus true-positive rate, where the parameter being varied is the decision threshold of the detector. We have developed a "blob"-based ROC analysis technique which is more appropriate than simple pixel-based techniques for the kind of region detection problem of interest here. The true-positive rate is simply the number of correctly detected targets divided by the total number, but the false-positive rate is more difficult to define. A positive blob which does not overlap a target region is considered a false positive, while a positive blob which overlaps a target and does not extend too far from the target is considered a true positive (Figure 1A). "Too far" is defined as farther than the median linear extent of the targets, as measured by the taxicab metric. A positive blob that overlaps the target but extends too far from it can count as several false positives. The portion which is too far has its bounding box divided into squares whose size is the median linear extent of the targets. Each such square in which the neural net exceeds threshold somewhere is counted as a false positive (Figure 1B). To get the rate, the false-positive count must be divided by the total possible number of false positives, which was defined as the count that False Positive
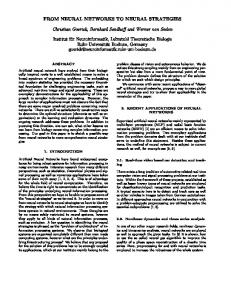
would have resulted if the neural network's output had exceeded threshold at all pixels in the image. 3. GENERIC PYRAMIDS VERSUS OBJECT-TUNED FEATURES Pyramid representations are traditionally constructed through convolution of an image with separable filters, such as a Gaussian or Laplacian, resulting in relatively simple features, which can be classified as "generic" in that they are found in a multitude of objects and contexts. The advantages of generic features are that they are computationally efficient and provide multi-scale information. However, it is unclear whether they contain enough object specific information for a neural network to learn a target detection task. More sophisticated features may be more appropriate for the neural network. For example, object-tuned features may improve target detection accuracy since they are related to details of object shape and structure. We have conducted experiments to compare the performance of a neural network with pyramid feature inputs to a neural network with object-tuned feature inputs. For the comparison, we consider the specific ATR problem of detecting planes in aerial imagery. An example of the imagery is shown in Figure 2.
3.1. Laplacian Pyramid Neural Network Figure 3 is a block diagram of our non-hierarchical neural network/pyramid. For a given input image,
TruePositive
FIGURE 1. Definition of false positives. The lightly shaded areas
represent "positive blobs" in which the neural network's output exceeds a threshold, the moderately shaded areas represent aclual largels, and the darkly shaded areas represent overlap between the two.
FIGURE 2. One of the training images for the neural network/
pyramid system.
Learning Target Context
1145 1001
. . . . . . . . .
[ . . . . . . . . .
' . . . . . . . . .
' .....
4
I. . . . . . . . . . . /
80
' ' , . . . . . . . . .
'
1
/
t
///
•.z 60 '~
r----
~
FIGURE 3. Block diagram for Laplacian neural network/pyramid.
7)
J ....
~- 40 N I
four levels of the Laplacian pyramid are constructed.] These four levels, representing a feature vector, are converted to an integrated feature measure (Burt, 1988b) via a standard nonlinearity and local integration, e.g., a squaring followed by a convolution with a Gaussian. A multilayer perceptron neural network is trained to discriminate targets from nontargets given the pyramid representation as input. The network is strictly feedforward and consists of three hidden units and a single output unit. The number of hidden units was chosen by systematically growing (increasing) the hidden layer until the addition of hidden units no longer reduced the error on the training set. The error measure used is the cross-entropy, Z
[ - d p log(yp) - (1 - d p ) log(1 - y p ) ]
(1)
P
where de • {0, 1} is the desired output for examplep, and yp is the network output for example p. Training is done in order to minimize the cross entropy error. The output of the network can be considered an estimate of the probability that a target is present at a given location. The network is trained on an image consisting of 36 planes and tested on an image having 11 planes. ROC curves are generated by systematically varying the decision threshold 0 (if neto,t > 0 then the detector decides it is a positive, else it decides it is a negative). The ROC curves for both the training set and test are shown in Figure 4.
3.2. Eigenfeature Neural Network One method for deriving object-tuned features is through principal component analysis (PCA). In PCA (Oja, 1983; Fukunaga, 1990), a data set is characterized through the construction of a set of orthonormal vectors, u , , which best describes the data set's distribution. One can use these orthonor-
2O -I -I -I
0
lO
20 30 %FolsePositives
50
FIGURE 4. ROC curves l o t l . a p l ~ l a n pyramid neural network (Iralnlng sel = solid; l u l sol = dashed).
mal vectors to construct subspaces in which objects are represented. This approach has received much attention, especially within the domain of face recognition (e.g. Sirovich & Kirby, 1987; Turk & Pentland, 1991; O'Toole et al., 1993). Our main assumption in using PCA is that certain subspaces capture more complex statistical properties of objects, e.g., object shape, than do simple features such as the Laplacian. To build the eigenfeatures, the Laplacian of the training image is computed to eliminate effects due to luminance variation. From this image a set of N subimages, I, representing the target class (in this case planes) is selected. To eliminate orientation dependencies in the eigenfeatures, rotated versions, spanning eight different orientations, are constructed for each subimage. The covariance matrix, l
8N
W = m8N~-'~.~I,,I.T
(2)
for the resulting 8N images is computed and the eigenvectors, u i, and eigenvalues, Ai, a r e f o u n d . 2 These vectors, ui, represent a basis in which all images can be represented. One can form a feature vector, w, for a given image, L by projecting the image into a subspace of the complete eigenspace and noting the components along each eigenvector;
c, = where wV= {¢L, C2,...
] Note, this resolution was chosen because the fourth level of the pyramid was the lowest resolution in which the individual planes remained distinctive (i.e., they were still segregated from o n e another).
40
u/XI
,eL+a}
(3)
and L specifies the
2 Details of an efficient method for computing the eigenveetors are discussed in Turk and Pentland (1991).
1146
P. Sajda et al. TABLE 1 Test Set Sensitivities (Ag) of Neural Nets with Eigenfeature Inputs
FIGURE 5. Graphical illustration distribution in image space.
of plane and non-plane
dimensionality of the eigenvectors and c~ the number. We call the vector w an "eigenfeature". It is unclear which set of eigenvectors is best suited for distinguishing targets from non-targets, the problem being that there is no information about non-targets inherent to the covariance matrix. The eigenvectors with the highest eigenvalues represent those dimensions of the eigenspace which are optimal, in the least squares sense, for reconstructing the images. Figure 5 is a simplified illustration of plane eigenspace. Planes tend to fall in an elliptical shaped region of the space, while the "rest of the world" is more uniformly distributed across the space. Most planes will have a large component along the direction of the eigenvectors with high eigenvalues (along direction A), while most planes have smaller components along the vectors with smaller eigenvalues (along direction B). However, the "rest of the world", given the uniform distribution assumption, will project equally well along vectors A and B. A system can use a set of eigenvectors with smaller eigenvalues to discriminate target from nontarget by noting that planes will cluster near the origin of the subspace, while non-planes will not. Presumably this clustering will be detectable in the eigenfeatures. To investigate which eigenvectors are best suited for discriminating planes from non-planes and constructing the eigenfeatures, we consider the projection of images into a low-dimensional sub-
Eigenfeatures
Ag
1-4
0.69
6-9 11-14 16-19 21-24 143-146 284-287
080 0.78 0.70 0.55 0.47 0.56
space of the eigenspace (four-dimensional subspace where c~ = 3). After sorting the eigenvectors by eigenvalue (Ul being the eigenvector with the highest eigenvalue, u u having the lowest eigenvalue), we train several neural networks, each using eigenvectors which span different subspaces (i.e., each neural network is trained using a different eigen-subspace). Each system is then tested empirically to determine the set which is best suited for constructing the eigenfeatures. Figure 6 is a schematic of the eigenfeature-based neural network. After computing the Laplacian of the input image, each pixel is projected into the network's eigen-subspace, resulting in the four-dimensional eigenfeature wT {CL,CL+I,CL+2,CL+3}. We call the four maps, representing the eigenfeatures at every pixel location, "eigenfeature maps". The eigenfeature maps are then transformed into integrated feature measures (squaring followed by lowpass Gaussian filter). The resolution of the eigenfeature maps is reduced via a Gaussian pyramid (i.e., the third level of the Gaussian pyramid is extracted for each eigenfeature map). These four maps are the inputs to the neural network, which has the same architecture and uses the same training procedure as is used for the Laplacian pyramid neural network. Note that we use four eigenfeature maps so that the neural network architecture between the two systems is identical (both the Laplacian and eigenfeature neural network have four inputs). The performance of the networks trained with different eigenfeatures is illustrated in Table 1. The systems, each based on a different set of eigenvectors, are compared using the
12" ~':
/ / // // ev 6 FIGURE 6. Block diagram for eigenfeature-based neural network.
ev 7
ev 8
FIGURE 7. (Top) Sample plane. (Bottom) eigenvectors (ranked by eigenvalue).
ev 9 No.
6-No.
Learning Target Context
100'
. . . . . . . .
1147
, . . . . . . . . .
, . . . . . . . . .
,
...... /" , '/ .......
This frequency signature may be related to plane size, since most of the planes in our example span approximately the same number of pixels (40 x 40 to 70 x 70). The eigenfeatures, as we have defined them, do not seem to be as robust as the Laplacian pyramid, at least not those constructed within a fourdimensional subspace. Though larger subspaces might be able to perform better, they come at additional computational cost. Thus it appears that the neural network/pyramid architecture, utilizing multi-resolution generic features, can perform better than systems using more complex object-tuned features, such as the eigenfeatures we have constructed here.
80 I /
2 60
s
_1
/
I
~
L 40
I I I
20
/ I I
0
,.
......
i .........
I0
i .........
30
False
FIGURE 8. ROC curves system
(elgen¥1~ors
i .........
20
I ........ 40
50
Positives
4. HIERARCHICAL NETWORK ARCHITECTURES
for Leplaclan and best eigenfeature
6-.9) ( L e p l a c l a n
=
solid; eigenfeature
=
deshedl.
integral under their ROC curves. This measure (Ag) gives an indication of the relative sensitivity of the system. The values in Table 1 indicate that the system constructed with eigenvectors 6-9 (see eigenvectors in Figure 7) is the most sensitive, in terms of discriminating target from non-target. The highereigenvalue subspaces capture the distinctions between planes but not between planes and non-planes. The eigenvectors with the smallest eigenvalues are also not necessarily the best for discriminating target from non-target. This might be due to the fact that (1) eigenvectors with small eigenvalues simply represent noise inherent to all images and/or (2) the assumption that the rest of the world is uniformly distributed in plane eigenspace is not completely valid.
3.3. Comparison between Laplacian Pyramid and Eigenfeatures Figure 8 shows the ROC curves for the Laplacian neural network/pyramid versus the eigenfeature neural network. These curves, along with the data in Table 2, show that the neural network/pyramid architecture is a better discriminator of targets from non-targets, at least within this specific ATR example. One possible explanation is that the spatial frequency information in the Laplacian pyramid contains robust information, creating a "plane signature" which the neural network can utilize.
TABLE2 False-positive Rates and Sensitivities of Laplaclan and Eigenfeature Detectors
Arch Laplacian Eigen (6-9)
FP rate (@ 95% TP), test set 38% 42%
Ag 0.89 0.80
best
This section begins the study of hierarchical neural network architectures, so called because there is one neural network for each level of the pyramid (Figure 9). Each network receives input from a window within the corresponding pyramid level, but also receives input from lower-level networks. Target and context features extracted at low-resolution can thereby be passed to networks processing higherresolution data, hopefully improving their detection accuracy. The output of a network at one level can also be used to indicate the search region at the next level of the pyramid, and so this system supports coarse-to-fine search. Supplementary image-registered data, such as maps, can also be provided as a parallel input, possibly improving the detection accuracy. The detection problem studied in this section was that of finding clusters of buildings in aerial photographs of farmland (see Figure 10). Note that this target has the kind of contextual relation (near roads) and variable appearance needed for testing the desired features of the hierarchical neural network. A typical building cluster has a linear extent of about 30 pixels at full resolution. The regions constituting clusters were chosen by hand. Three detectors of increasing complexity were developed. Detector A consisted of a single network operating at the highest image pyramid level.
Feature.~__.. Target * High-aes..=_ /'[~ ~ "=- / / :i I Probability /
Low-Res. Features ,/// ~
l
I C°ntext [
FIGURE 9. Hierarchical neural network detector architecture.
1148
P. Sajda et al.
\
value was proportional to the distance from a road, were constructed by linearly blurring the binary road map (by expanding more coarsely-sampled versions of the road map with the same expand operation used in constructing a Laplacian pyramid). The networks at the fifth and third pyramid levels received inputs from the road-maps at their resolution and from the two lower resolutions, while the network at the first pyramid level received input from the road map at its resolution and the next lower resolution.
4.2. Network Architecture and Training
FIGURE 10. Example Image for detection problem of finding building clusters In aerial photographs of farmland.
Detector B was a multi-level architecture but did not receive road-map supplemental data. Detector C was also multi-level and did receive road-map data. In this section we test two desired features of the hierarchical architecture by comparing the performance of these three detectors: (1) D o the internetwork connections improve detection accuracy (compare A and B)? (2) Can the system learn to exploit target context information provided in supplementary image-registered data (compare B and C)?
4.1. Features
The image features were constructed by building the Laplacian pyramid of the image and then applying a non-linearity to the pixels in each image in the pyramid. We then locally integrated these features by constructing a Gaussian pyramid o f each of these images, resulting in the so-called integrated feature pyramid (IFP) (Burt, 1988b) as described earlier (Section 3.1). These IFP images were the inputs to the neural networks. Binary, image-registered road maps were constructed by hand from the aerial photographs. They were reduced in resolution by first performing a binary blur of the image and then sub-sampling it by two in each dimension. In the binary blur procedure each pixel was set to one if any o f its nearest neighbors were road pixels before blurring. This was repeated to get road maps at each resolution. Continuous-valued road maps, in which the pixel
The input to each network was a single pixel from the same location in all o f the input arrays. Of course, because of the coarse representations and features, these single pixels represent information derived from extended regions in the original image. The networks were multi-layer perceptrons with sum-and-sigmoid units and one hidden layer. They were trained using the cross-entropy error measure [eqn (1)]. This error measure was added to a quadratic regularization term (weight decay) of the form,
r= ~_jw i
(4)
to get the objective function. The regularization constant, A, was adjusted to give lowest error on a test set. The training examples were drawn from two images. The desired output at each pixel was 1 if it was part of a building cluster, and 0 otherwise. The networks were trained separately, one at a time, beginning at the bottom of the hierarchy. For speed of development, in the hierarchical systems we trained nets only at the first, third and fifth pyramid levels. Note that at the fifth level, the typical buildingcluster size is about one pixel. Often, the weights to two or more hidden units would become identical and/or very small during training, and in these cases the extraneous units were pruned and the search for the optimal regularization parameter was begun again. This usually resulted in very small networks, with from two to five hidden units. For the hierarchical systems, the image of the lower-resolution network's output was expanded in order to use it as an inter-network for the networks at higher resolution.
4.3. Results
The performance figures presented here were measured on a validation set, i.e., an image on which the network was not trained and which was not used to set the regularization parameter. The false-positive
Learning Target Context
1149 TABLE 3
F a l s e - p o s i t i v e R a t e s a n d Sensitivities of t h e D e t e c t o r s . C o n t e x t and Road Maps Improve Performance
Detector
FP Rate (@ 95% TP)
AQ
Single net Hier. NN Hier. NN with road m a p s
16% 11% 5%
0.97 0.98 0.99
100
....
' ..... r
~ .>
r-
95
' '
'.. . . .
~"
' '
--
-
0
a_
90
N
85
I
80
.[
0
.........
5 10 15 % False Positives
20
F I G U R E 11. R O C c u r v e s I o r t h r e e building d e t e c t o r s . Solid = t h e
slngle-netwo~, mops, dashed
dotted = the hlerar~lcet :
hierarchical
network wlthou! road
n e t w o r k with r o a d m a p s .
rates presented in Table 3 are those that obtain with a true-positive rate of 95%. Figure 11 compares the ROC curves of the three systems. Table 3 and Figure 11 clearly show the benefits of using the road map and inter-network inputs, although the statistics are somewhat poor at the higher true-positive rates because of the small number of building clusters which are being missed. The improved accuracy produced by the internetwork connections was not due to the extraction of road context at lower levels. The output images from the lower-resolution networks did not exhibit any road-like structures. They seemed to simply reflect the lower-resolution appearance of the potential building clusters. This is probably not a fault of the networks, but is because the unoriented energy features are not well-suited for representing roads, which are highly oriented.
5. COMPARISON WITH A NONHIERARCHICAL NEURAL NETWORK ARCHITECTURE In this section we explore two key questions related to the inter-network connections of the hierarchical architecture: (1) How much relevant coarse-scale information is lost in the transfer between networks, and would a single network provided with inputs from all resolutions perform better? (2) Can the low-
resolution networks extract true image context that improves detection accuracy at higher levels? To address these questions, three elements of the approach to the building-cluster problem were modified. (1) Oriented energy was used to make the detection of roads possible, since roads tend to be strongly oriented, whereas buildings are not, at least at the scales being used here. (2) Hidden nodes instead of output nodes were the source of the inter-network input at the next level. Hidden nodes develop compact internal representations, and should be a better source of target context than the output nodes. (3) The supplemental road-map data were not used in the experiments in this section, as they are not relevant to the questions being examined here. To investigate the extent to which relevant coarsescale information is lost, a non-hierarchical neural net was trained with inputs from energies in all frequency bands available to the hierarchical system. All coarse-scale information is thereby available to this network. The new features were constructed as follows. Image energy was computed in multiple bands, varying by radial and angular passbands and spatial resolution. Relatively few radial passbands were used for simplicity and speed, and because of the strong correlation between adjacent pyramid levels in natural images. The twelve band filters had the 2D frequency response
Ho,i(f) = (ro . t)2exp(-9 ~12i-'rl2 )
(5)
where ro = (cos 0, sin 0) is a unit direction vector, chosen from 0 ~ {0°, 45°, 90°, 135°}, and i denotes the octave of radial frequency (i.e., pyramid level), chosen from {1, 3, 5}. The bands are disjoint in radial frequency and broadly overlapping in angular frequency. The passband energies were computed efficiently using the steerable filter method (Freeman & Adelson, 1991). These are squares of filter outputs, rather than the absolute values as used in Section 4.1. These energy outputs were filtered to produce bands with varying receptive field sizes. Denote by Eu(O ) the energy of filter Ho, i with spatial resolution of Gaussian pyramid level j. This IFP was computed by Gaussian pyramid reduction and expansion. Twenty-four Eij(O) bands were chosen as features, ij E {11, 13, 15, 33, 35, 55} for each of the four 0s. For the non-hierarchical neural network detector, these features were output at the full resolution of the source image. As for the previous hierarchical neural network detector, each network only received energies derived from spatial resolutions greater than or equal to the search resolution. In other words, the inputs to the network which searches the
1150
P. Sajda et al. O 0
. . . .
P
. . . .
i
. . . .
f
,
95
the level-one network. Note that the level-one network did not receive inputs from the level-five network, unlike the detectors described in Section 4.
. . . .
-
-
/
-
-
..,y
o_
El_
5.1. Training Methods and Performance Measures
90 85 8 0
,
0
,
,
..~
. . . .
i
. . . .
t
5 10 15 % False Positives
. . . .
20
FIGURE 12. ROC curves for the hierarchical and nonhierarchical systems. Solid is the non-hierarchical system.
jth pyramid level are the Eiy(O) for all i ~