Integrating Performance Monitoring and Communication in Parallel Computers Margaret Martonosi
David Ofelt
Dept. of Electrical Engineering Princeton University
Computer Systems Laboratory Stanford University
[email protected]
{ofelt,heinrich}@mojave.stanford.edu
Abstract
• The semantics of program loads and stores present software with the abstraction of a flat memory space (caching is hidden) which hinders implementing memory monitoring tools in software.
A large and increasing gap exists between processor and memory speeds in scalable cache-coherent multiprocessors. To cope with this situation, programmers and compiler writers must increasingly be aware of the memory hierarchy as they implement software. Tools to support memory performance tuning have, however, been hobbled by the fact that it is difficult to observe the caching behavior of a running program. Little hardware support exists specifically for observing caching behavior; furthermore, what support does exist is often difficult to use for making fine-grained observations about program memory behavior.
In response to these difficulties, memory performance tools have, in many cases, turned to simulation-based approaches. Such approaches can give detailed information about how the program is likely to behave on a specified memory hierarchy. The main drawback of these approaches is that while they offer a realistic view of what might happen to the code, there are no assurances that the code running on the real machine will behave this way. For example, most such tools do not include operating system effects in their simulation, because the additional references would increase simulation time. Furthermore, simulations of parallel systems suffer slowdowns that increase with increasing numbers of processors, preventing interactive use of simulation-based tools. For these reasons, hardware support for memory performance monitoring is often needed to get detailed assessments of program behavior accurately and efficiently.
Our work observes that in a multiprocessor, the actions required for memory performance monitoring are similar to those required for enforcing cache coherence. In fact, we argue that on several machines, the coherence/communication system itself can be used as machine support for performance monitoring. We have demonstrated this idea by implementing the FlashPoint memory performance monitoring tool. FlashPoint is implemented as a special performance-monitoring coherence protocol for the Stanford FLASH Multiprocessor. By embedding performance monitoring into a cache-coherence scheme based on a programmable controller, we can gather detailed, per-data-structure, memory statistics with less than a 10% slowdown compared to unmonitored program executions. We present results on the accuracy of the data collected, and on how FlashPoint performance scales with the number of processors.
1
Mark Heinrich
The key contribution of this paper is to expose the parallels between the system support that is desirable for memory system performance monitoring and the system support that is already implemented on cache-coherent shared memory multiprocessors. The main observation is that the mechanisms used to implement cache coherence are often quite similar in structure to what is desired for performance monitoring. In other words, while memory performance monitoring does need particular forms of support, we argue that in many cases that support has already been implemented, albeit for another purpose.
Introduction
In recent years, processor speeds have improved much faster than DRAM speeds, resulting in significant relative increases in memory latencies. This situation has led to heightened attention on program memory performance. The problem is particularly acute in multiprocessors, due to the potential for accesses over a network to remote memory. For example, even in the absence of contention, some remote accesses in the Stanford FLASH Multiprocessor can take as many as 380 processor cycles to complete [HKO+94].
To demonstrate concretely the utility of integrating performance monitoring with coherence support, we have implemented FlashPoint, a performance monitoring tool for the FLASH Multiprocessor [KOH+94]. The tool is integrated into the software handlers of FLASH’s flexible coherence protocol. It takes advantage of FLASH’s existing mechanisms for (i) automatic software activation on each second-level cache miss and (ii) per-cache-line accounting of memory usage. FlashPoint keeps detailed memory statistics for individual program code and data structures. By taking advantage of existing cache-coherence support, FlashPoint is able to collect these fine-grained statistics at low overheads. Gathering per-data-structure statistics incurs less than 10% overhead; gathering per-data-structure, per-procedure statistics has higher overheads but still generally results in less than 2X slowdown.
Despite the great importance of memory system behavior to application performance, it is difficult to build tools to monitor such behavior. The main challenges are: • Memory references happen frequently, and therefore require very frequent, fine-grained monitoring. • Little hardware support exists to give feedback on caching and memory behavior.
FlashPoint represents an interesting and concrete demonstration of a symbiosis between cache coherence and performance monitoring in multiprocessors. The paper, however, is not simply a description of this particular tool, but rather an analysis of the natural parallels between these two system functions, and the opportunities for amortizing hardware and systems costs across both of them. Section 2 outlines the basic needs of performance monitoring and coherence systems, and shows the commonalities between the two.
1
As a case study, Section 3 describes the implementation and performance of FlashPoint. Section 4 expands the discussion to consider possible implementations in other styles of parallel computers. Section 5 discusses related issues and future work, and Section 6 offers our conclusions.
components central to performance monitoring: trigger points, handlers, and available state storage, have already been implemented for an entirely different purpose. Namely, they are often present as part of the cache-coherence support on many sharedmemory multiprocessors.
2
At the heart of most current high-performance shared-memory multiprocessors is a cache coherence protocol, which guarantees that the data in each processor’s cache is kept in sync with the data in other caches throughout the system. Hardware or software will track which lines are cached in which processor caches, watch for activity on those lines, and send out updates or invalidations accordingly. Although cache coherence strategies vary, a common theme is that the hardware or software intended to implement cache coherence will be triggered on “interesting” references (i.e., loads or stores that cause a protocol state change for the referenced cache line). This triggering activates hardware or software handlers. The handlers perform functions such as fetching the data or invalidating it from other caches. They may also maintain percache-line or per-page state information that the protocol uses to maintain coherence.
Integrating Monitoring and Coherence
To establish the link between performance monitoring and cache coherence in parallel systems, this section first outlines the needs of both independently, and then discusses which requirements are common to both.
2.1
Performance Monitoring
The functionality of a performance monitoring system can be considered in terms of three main components: (i) a means of triggering on events to be monitored, (ii) hardware or software handlers to respond to triggering events, and (iii) state information, or storage, to aggregate statistics over a stream of triggering events. As an example, consider a hardware histogram monitor, such as the DASH Hardware Performance Monitor [Hei93]. Here, monitoring is triggered by each reference on the shared cluster bus. Hardware (in essence, a handler) responds to the trigger by incrementing appropriate counts in a set of histograms. These banks of memory-mapped histograms form the statistics state information for this performance monitoring system.
One can also extend beyond this surface similarity. In sharedmemory cache coherence protocols, trigger points are those references that require coherence actions—either to fetch a line into the cache, or to upgrade its state from shared to exclusive. In scalable (e.g. directory-based) protocols, the memory events that cause major delays are almost always those requiring coherence actions; therefore, “interesting” coherence events are “interesting” memory performance monitoring events.
For comparison, consider a software-based approach such as MemSpy [MGA95] or CProf [LW94]. In these tools, the events-tobe-monitored are memory references in the code. Trigger points are created at these events by instrumenting them with calls to software procedures, or handlers. These monitoring routines update their data structures with statistics about the reference and then return control to the application. Although the implementation of these monitors is quite different from the hardware-based approaches, the three basic components of the performance monitor are still clearly present.
Once a cache-coherence handler has been invoked, it performs (either in hardware or software) a table lookup to check on the coherence state for the cache line. Based on this information, it sends out messages as needed and updates the coherence state information. One could modify the protocol handler state machine or software to update statistics counters as part of each coherence action. Furthermore, by modifying the directory storage to include counter bits or to include indexing bits that point to an array of counters, one could categorize statistics for different regions of memory at granularities as small as a cache line. Thus the three required mechanisms for fine-grained memory performance monitoring are present in the standard cache-coherence mechanisms.
Finally, systems using hardware miss counters (such as implementations of the R10000 [JHei95], Pentium [Mat94] or DEC Alpha [DEC92] architectures) trigger on first level cache misses, and cause counters to be incremented. In this case, the trigger is the miss signal resulting from the cache probe, the increment is the hardware handler, and the counter register is the statistics state information.
3 FlashPoint: A Case Study As a concrete example of our ideas, we now describe a tool called FlashPoint. The tool gives data oriented breakdowns of memory overhead in the programs being run. That is, similar to tools like MemSpy [MGA95] and CPROF [LW94] it presents program performance information in terms of data, as well as code, structures in the program. FlashPoint maintains data structures that map each memory location accessed by the monitored program to its corresponding program data structure identifier. The mappings handle heap-allocated as well as static data, and they aggregate together elements of dynamic data structures such as linked lists. ([MGA95] and [ZH88] describe similar methods.)
For many tools, the main limitation to their efficiency and accuracy has been the lack of lightweight, selective-notification mechanisms for performing the first of the three main components: identifying and triggering on events to be monitored. While bus monitors or on-chip cache miss counters allow one to trigger on all memory events (at a particular level of the hierarchy), it can be difficult to trigger selectively on some events or to take actions other than aggregate counting. For example, tools like MemSpy categorize miss counts according to the code and data structures that incurred the misses. This categorization is still quite time-consuming even with support such as on-chip miss counters or hardware histogram bus monitors. If miss detection could be performed instantaneously in hardware, the overhead for such a tool could drop by a factor of two or more in some cases [Mar93]. The following subsection introduces how cache-coherence mechanisms can help support selective notification and statistics categorization.
2.2
FlashPoint gathers statistics on the number and latency of read and write misses. It maintains separate categories of statistics for local and remote references. It also keeps counts on the number of invalidations required and on the number of cold misses in the program (i.e., misses to memory not previously referenced since monitoring began). The information gathered by FlashPoint can be viewed with a graphical user interface to give the programmer a display of the program’s memory behavior in familiar terms (procedure and variable names from the program).
Cache Coherence
The key observation underlying this research is noting that within many cache-coherent shared-memory multiprocessors, the three
2
Processor Network
2nd-Level 2$ 2nd-Level Cache Cache
PI PI µP µP
DRAM DRAM
data
I/O
NI
I/O
Message Split
header
Incoming Queues
Network
MAGIC MAGIC
I/O
Inbox Inbox
Data Buffers
Protocol Processor Protocol Processor Figure 1. FLASH Node Organization
3.1
Memory
Outbox Outbox
FlashPoint Implementation data
Lacking adequate, widely-available hardware support for memory performance monitoring, tools like MemSpy and CProf were designed to evaluate application performance based on simulations of the program. In contrast, FlashPoint is designed to run directly on the Stanford FLASH Multiprocessor; its implementation takes advantage of the implicit performance monitoring support offered by FLASH’s cache-coherence mechanisms. FlashPoint is implemented as a modified cache coherence protocol. Instead of the default protocol, each protocol processor in the machine runs protocol code that implements both performance monitoring and the standard coherence actions. It is crucial to note that unlike MemSpy or CProf, FlashPoint is NOT simulation-based; rather, it gathers data from a real, running system.1 For this reason, it has several beneficial characteristics. First, it captures information about full system effects. Second, it scales with number of processors. Third, it requires no additional hardware.
MAGIC MAGIC Data Data Cache Cache MAGIC Inst Cache
header
Message Join
Outgoing Queues PI
NI
I/O
Figure 2. Block Diagram of FLASH’s MAGIC Chip
The protocol processor is a programmable controller that implements a subset of the DLX instruction set [HP90] with extensions that include bitfield operations and a bit-wise conditional branch. Both extensions accelerate the state-bit manipulations that are common in the protocol handlers. The PP is implemented as a dual-issue 64-bit machine with static scheduling. It fetches a pair of instructions on every PP cycle. Since the PP does not support interrupts or exceptions, these instructions are executed unconditionally. The PP also does not support pipeline interlocks or most types of resource conflict detection, so the PP programmer or compiler must avoid these statically. Our FlashPoint implementation takes advantage of these PP characteristics: some of the FlashPoint code added to each handler fills otherwise-empty slots in the statically-scheduled protocol handlers.
The FlashPoint method has one potential disadvantage, however. Unlike simulation-based approaches, FlashPoint is intrusive because it augments the default coherence protocol with performance monitoring information. As a result, the timing of a program in a FlashPoint system is not identical to its timing in an unmonitored system. Later in this section, we examine the implications of this approach on monitoring accuracy and application performance.
The protocol processor’s memory hierarchy consists of a 16 KB direct-mapped on-chip instruction cache and a 1 MB, 2-way setassociative off-chip data cache. With these parameters, the protocol processor code experiences very few cache misses; they are negligible in the results presented in this paper for both the default protocol and the augmented FlashPoint protocol. The MAGIC chip has a target frequency of 100MHz, therefore all latencies collected by FlashPoint are stated in terms of these 10 ns system cycles.
FlashPoint is built by augmenting the default protocol used in the FLASH Multiprocessor. For this reason, we first describe the FLASH architecture and the default FLASH protocol. Following that, we describe the FlashPoint protocol in some detail—covering its data structures and control mechanisms.
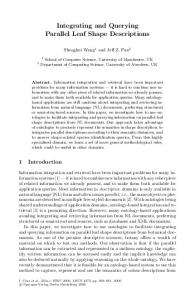
3.1.1 The FLASH Architecture Figure 1 shows the organization of one compute node in the FLASH architecture. These nodes are interconnected via a twodimensional mesh network. At the heart of every compute node is the MAGIC chip which includes interfaces to the processor, the network, and the I/O subsystem. MAGIC queues incoming events from each of these external interfaces, and invokes the appropriate software handlers on its embedded Protocol Processor (PP) to handle these events. (See Figure 2.)
3.1.2 The Default FLASH Protocol FLASH’s default coherence protocol is directory-based, and uses dynamic pointer allocation [Sim92] to maintain a scalable directory structure. In this protocol, eight bytes of state, the directory header, is associated with each coherence unit (a 128 byte cache line). The header includes boolean flags that encode the line’s state, as well as a link field which is the head of a linked list of sharers. For efficiency, the first of these sharers is also stored within the directory header. Each line has a directory entry at one node in the system; that node is called the home node.
1. Since the system does not yet exist however, we evaluate the performance of the FlashPoint protocol code by running it on the FlashLite simulator. This is precisely how one would evaluate a coherence-only protocol for the system.
3
The directory state is maintained via a set of software handlers. The base protocol accepts incoming messages from either the local compute node or from the network. Incoming read or read-exclusive requests may be satisfied either locally (if this is the home node for the line) or remotely (otherwise). For local requests, the protocol processor checks and updates the line’s state, and on writes, may also send invalidation requests to other nodes. For remote requests, the local protocol processor sends a corresponding request to the home node for that line. For each request message in the system, a corresponding reply message is sent back; these return requested data or acknowledge completion of a requested action.
NILocalGet(Header hdr, Address addr) { Address headLinkAddr; long long h; headLinkAddr = AddrToHeadlinkAddr(addr); h = headLinkAddr; if (!h.Pending) { if (!h.Dirty) { // Clean if (!h.HeadPtr) { // no previous sharers hdr.len = LEN_CACHELINE; hdr.msgType = MSG_PUT; hdr.bin = h.FPBin; hdr.warm = h.FPWarm; NISend(header, addr); h.FPWarm = 1; h.Ptr = hdr.src; h.HeadPtr = 1; } else {... // Already sharers } } else { ... // Dirty bit set } else { ... // Pending bit set }
3.1.3 The FlashPoint Protocol The FlashPoint protocol can be viewed as a superset of the default dynamic pointer allocation protocol. It augments several handlers with additional code that updates the performance counts. In addition, it defines several new handlers not present in the default protocol. In total, FlashPoint required modifying 12 out of the approximately 100 handlers in the default protocol, and adding four new handlers. Figures 3 and 4 show the pseudo-code for two FlashPoint handlers. The portion in boldface is the code added to the handler for FlashPoint; the remaining code is the default protocol handler.
Performance Data Structures The FlashPoint protocol maintains two per-processor data structures in addition to the default cache-coherence data structures. One data structure is a bit field occupying part of the directory header for each cache line. We use eleven previously unused bits in the directory header to store a “warm bit” and a ten-bit “bin number”. The warm bit indicates whether the cache line has been accessed since initialization. The value of the warm bit is checked on data replies to decide whether or not the reference is a cold miss, and if so, to update statistics accordingly. The bin number identifies which data structure the cache line belongs to. For all coherence operations at the home node, the default protocol looks up the directory header and loads it into a register. Consequently, it is available without recalculation for performance monitoring code. void NIRemotePut(Header hdr, Address addr) { long long binAddr, latency; int bin, warm;
} Figure 4. NILocalGet Handler
The second data structure is the storage for the per-bin statistics. It is an array of statistics structures where each individual record includes counters for read misses, write misses, local vs. remote misses, and so on. These records are organized as a two-dimensional array where the first dimension is the procedure number, and the second dimension is the bin number. This allows FlashPoint to maintain per-data-structure, per-procedure statistics. For efficiency, a pointer to the current procedure’s array of bins is stored in a register. In the applications used in our study, this data structure’s average size is approximately 256 KB.
Program Access to Performance State There are two pieces of information that the user-level system needs to pass down to the protocol. The first is the assignment of bins to cache lines. This is used to categorize memory to form perdata-structure statistics. We implement this with an uncached store to a special location. The address of the store is interpreted as a command by MAGIC, and the data contains: (i) the starting physical address for a data bin, (ii) the length (in cache lines) of the bin, and (iii) the bin number to assign to that range. The protocol takes this data and loops over the appropriate directory headers setting the bin field of each to the new bin number, and clearing the warm bit. In a real system, the mapping between the program’s virtual memory and the physical memory of the machine can change over the course of the program’s execution. In our experiments we assume that all pages are pinned (the virtual to physical translations do not change, and hence you need to establish bin mappings only once). Other components of the FLASH design remove this page-pinning requirement [HGD+94]; for simplicity, we do not address this problem here because we do not believe it affects the quality of our results.
PISend(hdr, addr); latency = ReadLatency(); bin = hdr.bin; warm = hdr.warm; binAddr = binTableStart + bin * sizeof(FP_BIN); binAddr.rdMissRemote++; binAddr.rdLatencyRemote += latency; if (!warm) { binAddr.cold++; } } Figure 3. NIRemotePut Handler
4
Lite event-driven reference generator [Gol93]. To model latency and contention accurately, FlashLite uses cycle counts and arbitration information from a Verilog model of the MAGIC chip. Handler code is compiled using a modified version of gcc [Stall93], which generates object code that makes use of the PP’s extended instruction set. This code is then scheduled using a version of twine [Smi92], an instruction scheduler originally developed for the TORCH processor [SJH89]. To make the comparison fair, the same tools and optimization levels are used when generating the default and FlashPoint versions of the protocol handlers.
When monitoring per-procedure statistics, the user-level system also needs to pass the protocol the procedure number on every function call and return. Whenever the program switches procedures the difference between the current procedure number and the new procedure number, the delta, is sent down to the memory system. The current bin pointer is adjusted by delta times the size of the bin array.2 This is implemented as an uncached load where the page offset bits contain the procedure delta. After the program has run, the statistics need to be read by the main processor. There are many ways of doing this. For example, one could send a command to the PP that causes it to flush the bin data structures from its cache. The main processor can then read the bin structures like it would any other part of memory.
We evaluate FlashPoint on a subset of the SPLASH-2 suite of parallel applications [WOT+95]. The four programs considered are: FFT, LU, OCEAN, and RADIX. The FFT benchmark uses a data set of 256K points. LU performs an LU decomposition on a 512x512 matrix with a block size of 16. OCEAN is a scientific program that studies large-scale ocean movements; we run it here on a 258x258 grid. Finally, RADIX performs an integer sort with radix 256 and 1 million keys. Except where specified, we use 16 processor runs of these applications. Our results are presented in two parts. First we consider the accuracy of the statistics gathered by FlashPoint by comparing the miss counts and miss latencies it reports with those for the same application run with the default coherence protocol. Subsequently, we quantify the performance overhead of running with the FlashPoint protocol as compared to running with FLASH’s default protocol. Throughout these results, we present overview statistics for all applications. Occasionally we also present results focusing in on a single application’s behavior. Typically, we focus on FFT, but its behavior is not qualitatively different from the other three applications.
3.1.4 Fine-Grained Timing Support Counts are easy to do in software, but determining accurate latencies is not. A request may spend an arbitrary amount of time between the main processor and the PP (waiting in queues). Therefore, if the entire latency calculation were done by having the PP set and later read timestamps, it could be arbitrarily inaccurate since it would not have recorded the time the request spent in the system before being initially serviced by the PP. Instead, there is hardware directly at the processor interface to MAGIC that starts a counter when the request arrives from the processor bus. When the corresponding reply is sent back to the processor, the PP can read the counter to record the latency in the proper bin. By reading the counter after the reply is sent to the main compute node (i.e. outside the latency interval itself), FlashPoint obtains a highly accurate measurement of the miss latency.
3.2.2 Accuracy Impact of FlashPoint
3.1.5 Summary
Clearly our goal is to collect statistics about program caching behavior with only slight perturbation of the behavior being studied. FlashPoint collects statistics both on cache miss counts and on their latencies, and we would like each of these to reflect the behavior of the unmonitored program run.
Clearly, some aspects of FlashPoint’s implementation are specific to the FLASH multiprocessor and its cache-coherence support. For example, the programmability of the PP allows protocol modifications to happen in a flexible way. In addition, the PP’s dual-issue pipeline allows some of the extra performance monitoring code to be embedded into unused instruction slots. Beyond that, FLASH’s default protocol already maintains state information about each cache line in the system. By adding performance information to the coherence state, we can easily access the information, and can amortize directory table lookup overhead that is already needed for the coherence protocol. The main point is that although some implementation details are machine-specific, the notion of integrating coherence and performance monitoring is a much more generally applicable idea. Section 4.0 discusses extensions to other protocols and machines.
3.2
To determine the accuracy impact of FlashPoint, we compare the cache statistics collected by a run with the FlashPoint protocol (in which the timing and perturbation of FlashPoint are included) against the statistics collected by a control run of the simulator. In the idealized control run, the simulator collects the same statistics that FlashPoint would, but uses the default protocol so the program is not charged for the timing effects of gathering these statistics.
Cache Miss Counts Table 1 shows the application cache miss counts for local and remote reads and writes, for three different protocol configurations. DP refers to the dynamic pointer allocation protocol that is the default on FLASH. FP-NoProc is the FlashPoint protocol with per-data-structure statistics, but without per-procedure statistics. FP-Proc is the full FlashPoint protocol, which keeps statistics both per-data-structure and per-procedure.
FlashPoint Performance
In order to present results on FlashPoint’s performance, we first describe the methodology used to collect the data. We then present results comparing the performance overhead and accuracy of the FlashPoint protocol to the default dynamic pointer allocation protocol. We conclude with a discussion of some implementation tradeoffs in the FlashPoint design. Many of the ideas in that section can be used to reduce FlashPoint’s overhead even further than the numbers presented here.
For all four applications the cache miss counts gathered by FlashPoint are quite close to the true statistics. In most cases, miss counts for reads and writes differ by less than 3% from ideal. The 9-13% difference in remote read misses for RADIX is caused by an artifact of our simulator, resulting in different placement of static data between the DP and the FlashPoint runs. Notice though that for total read misses in RADIX, FlashPoint barely differs from the default protocol. Clearly, for gathering statistics of this sort, FlashPoint is quite accurate.
3.2.1 Experimental Methodology We gathered these results using the FlashLite simulator. FlashLite is a multithreaded system simulator that interfaces to the Tango 2. If the size of the bin array is a power of two, then the procedure adjustment is just two instructions—a shift and an add.
5
Table 1: Cache Miss Counts (x103)
Read Miss Counts (Total / Local / Remote) Application
DP
FP NoProc
Error
FP Proc
Error
FFT
215 / 122 / 93
214 / 121 / 93
-1% / -1% / 0%
215 / 121 / 93
0%/-1% / 0%
LU
225 / 26.9 / 198
224 / 26.2 / 198
0% / -2% / 0%
225 / 27.8 / 198
0%/ 3%/ 0%
OCEAN
452 / 216 / 236
457 / 221 / 235
1% / 2% / 0%
456 / 221 / 235
1%/ 2%/ 0%
RADIX
71.7 / 69.2 / 2.48
71.8 / 69.0 / 2.79
0% / 0% / 13%
71.7 / 69.0 / 2.69
0%/ 0%/ 9%
Write Miss Counts FFT
105 / 105 / .016
105 / 105 / .019
-1% / 0% / 19%
105 / 105 / .018
0%/ 0%/ 13%
LU
42.5 / 26.1 / 16.5
41.8 / 25.3 / 26.5
-2% / -3% / 0%
43 / 26.5 / 16.5
1% / 2%/ 0%
OCEAN
630 / 630 / .293
629 / 628 / .284
0% / 0% / -3%
629 / 629 / .307
0% / 0% / 5%
RADIX
149 / 40.5 / 108
149 / 40.6 / 108
0% / 0% / -1%
149 / 40.6 / 108
-1% / 0%/ -1%
Table 2: Cache Miss Latencies (10 ns system cycles)
Read Latency (Average / Local / Remote) Application
DP
FP NoProc
Error
FP Proc
Error
FFT
84 / 22 / 165
95 / 23 / 189
13% / 3% / 14%
95 / 23 / 189
13% / 2% / 14%
LU
141 / 23 / 157
163 / 24 / 181
16% / 5% / 16%
152 / 22 / 171
8% / -1% / 9%
OCEAN
94 / 24 / 158
102 / 28 / 172
9% / 15% / 9%
103 / 28 / 172
9% / 15% / 9%
RADIX
104 / 101 / 190
109 / 104 / 226
4% / 3% / 19%
109 / 104 / 225
4% / 3% / 19%
52% / 52% / -5%
119 / 119 /282
54% / 54% / -5%
Write Latency FFT
77 / 77 / 297
118 / 118 / 283
LU
62 / 31 / 110
67 / 32 / 120
8% / 2% / 9%
65 / 30 / 122
5% / -5% / 10%
OCEAN
42 / 42 / 286
57 / 57 / 301
34% / 34% / 5%
57 / 57 / 294
35% / 35% / 3%
RADIX
170 / 31 / 222
192 / 33 / 252
13% / 4% / 14%
192 / 32 / 253
13% / 3% / 14%
Cache Miss Latencies
Per-Bin Statistics
Beyond counts, FlashPoint also collects information about the latencies of memory events. Table 2 shows information about FlashPoint’s latency estimates. For each application, latency estimates are given for the same three protocol configurations as before. For each, we display the average, average local, and average remote read and write miss latencies. Although not as successful as the count values, the results for latency measurements are also acceptable. For all four applications, read latencies are estimated to within 20% of their true values. RADIX and LU have the best behavior of the four, with latency estimates remaining within 20% of the true values for both reads and writes. For OCEAN and FFT, read estimates are fairly accurate, but write estimates deviate by roughly 35% and roughly 55% respectively. This occurs because these programs perform bursty writes, so the added occupancy of the FlashPoint handlers exacerbates the queueing delays inherent under the base DP configuration. It may be possible to improve the accuracy of latency measurements by adjusting them by a fixed amount corresponding to FlashPoint’s additional instruction overhead in a particular handler.
The above paragraphs have examined FlashPoint’s aggregate measurement accuracy. Our goal, however, is to use FlashPoint as a mechanism for collecting fine-grained statistics. On one hand, it may seem even more difficult to collect fine-grained data accurately as compared to aggregated data. When reference statistics are very finely categorized, the number of data points collected per bin may be quite small and the potential for measurement error may therefore be greater. As a performance tuning tool, however, FlashPoint’s main objective is to indicate to programmers the main bottlenecks in the code and the degree to which they are bottlenecks. The proportional representation of key data and code structures may be more important than absolutely precise measurements of event latencies. Table 3 summarizes some of the FlashPoint per-data structure statistics output for a 16 processor run of FFT. The two top-ranking bins are shown, and they make up 84% of the read and write misses for this run of the code. For each data structure (there are two shown) and each statistics metric (there are ten shown), the table presents the proportion of that metric caused by this data bin. For example, the top-ranking data structure (a pointer to doubles, called trans) is responsible for 29% of the local read misses, 33% of the remote read misses, and 65% of the total write misses. We
6
FP run
Error
Top Ranking Data Bin: (double*).trans 29%
32%
7%
Read Latency Local
28%
30%
6%
Read Miss Remote
33%
33%
0%
Read Latency Remote
35%
34%
-2%
65%
68%
4%
62%
64%
2%
Write Miss Remote
0%
0%
0%
Write Latency Remote
0%
0%
0%
Cold Misses
33%
33%
0%
Invalidation Misses
59%
59%
0%
9.8 10 7.4 7.8 7.8
5
5.2 3.5 3.6 1.8 1.9 1.9
0|
|
Write Miss Local Write Latency Local
10
Default FP NoProc FP Proc
|
Read Miss Local
15
20
|
Parallel execution time (10E6 cycles)
DP run
|
Metric
20
|
Table 3: Per-data-structure Statistics for FFT
FFT
LU
OCEAN
RADIX
Figure 5. Application Parallel Execution Time
For comparison, MemSpy would require greater than 10X overhead to gather similar statistics, and its simulation-based approach does not scale well with the number of processors [Mar93].
Impact on Handler Latency
2nd Ranking Data Bin: (double*).x Read Miss Local
29%
27%
-7%
Read Latency Local
31%
29%
-6%
Read Miss Remote
66%
66%
0%
Read Latency Remote
61%
60%
-1%
Write Miss Local
34%
31%
-7%
Write Latency Local
38%
36%
-4%
Write Miss Remote
0%
0%
0%
Write Latency Remote
0%
0%
0%
Cold Misses
33%
33%
0%
Invalidation Misses
41%
40%
-1%
Figure 6 shows the average latencies of the five instrumented handlers with the greatest impact on performance. These five handlers are: (i) PILocalGetX (gets exclusive access for a local write), (ii) PILocalUpgrade (a local upgrade from shared to exclusive mode), (iii) NILocalGet (a remote read request), (iv) PILocalGet (a local read) and (v) NIRemotePut (a remote read reply). Latency is measured as the time from when the PP executes the first instruction of the handler to the time when the PP sends the response. Although the additional instrumentation in the FlashPoint protocol leads to different program execution, with slightly different handler latencies, Figure 6 shows that none of the handler latencies increase significantly. For completeness, Table 4 reports the handler latency and occupancy perturbations for all four of our applications for two of the most common handlers: PILocalGet and NILocalGet. Since these perturbations are nearly identical for FP-NoProc and FPProc, we report results only for FP-Proc in the table.
show these proportions for both FlashPoint and the base protocol. We also show the relative errors between the base, unperturbed results and the FlashPoint results. The results here are extremely promising. All FlashPoint measurements are within 7% of their unperturbed values. Even in cases (such as FFT’s write latencies) where FlashPoint’s absolute measurements deviate due to perturbation, the relative proportion of latencies by data structures can be reported quite accurately. For programmers assessing which variables make the most difference in their program’s performance, this metric is arguably more important than the absolute latency measurements.
Table 4: Handler Latency/Occupancy Perturbations (10 ns system cycles)
NILocalGet
PILocalGet DP
FP Proc
FFT
9/11
9/21 0%/91% 15/29 17/37 15%/30%
LU
9/11
9/21 0%/91% 15/49 22/56 41%/15%
OCEAN 9/11
9/21 0%/91% 16/38 18/47 9%/25%
App
3.2.3 Performance Impact of FlashPoint
Overhead
DP
FP Proc
Overhead
RADIX 11/13 11/18 0%/36% 16/37 20/44 23%/20%
Having established that FlashPoint can accurately measure several aspects of fine-grained memory behavior, we now present data on its performance overhead. Figure 5 plots execution time for the four applications using our three different protocol configurations. The execution time presented here is the time the program spends in the parallel section of its code; initialization is not included. In all cases, the execution time required for the FP-NoProc protocol is less than 10% greater than the default unmonitored run. When users wish to have statistics categorized both by data bin and by procedure, the overhead increases somewhat for some of the applications. For OCEAN and RADIX, even the FP-Proc protocol costs only an extra 5% in execution time. For FFT and LU, the overheads are higher, but are still much lower than the only previous alternative (simulation) for gathering statistics at this granularity.
Impact on Handler Occupancy Figure 7 shows a graph similar to the previous one, this time for the handler occupancies in FFT. Occupancy is defined as the time from when the PP executes the first instruction of the handler until the time the PP reaches the next “switch” which is the PP instruction to load in the next handler. Occupancy is a measure of how busy the PP is being kept, while handler latency is a measure of how long a particular access (or portion of an access) will take. The figure shows that although handler latencies were largely unchanged under FlashPoint, handler occupancies do increase. Particularly for NIRemotePut (a small pass-through handler) the occupancy increases significantly. Referring back to Figure 3, the
7
|
25
| |
15
Table 5: Scaling FFT to 64 Processors
Metric
|
Handler Latencies (cycles)
30
20
Default FP NoProc FP Proc
|
35
|
40
10
|
5
16 15 15
17
16 16
DP
FP No Proc
Error
FP Proc
Error
17 17 15
FFT 16P
|
9.0 9.0 9.0
3
1.0 1.0 1.0
215
214
-1%
215
0%
Read Latency
84
95
13%
95
13%
|
0|
Read Misses (10 ) 3
PILocalGetX PILocalUpgrade NILocalGet
PILocalGet
NIRemotePut
60
105
105
-1%
105
0%
77
118
52%
119
54%
FFT 64P
|
55
|
50
|
45
|
40
|
35
|
30
|
25
|
20
|
15
|
10
|
5
|
Handler Occupancy (cycles)
Figure 6. Handler Latencies for FFT
Write Misses (10 ) Write Latency
Default FP NoProc FP Proc
3
37 37 30 30
30 30
19
29
Read Misses (10 )
203
203
0%
203
0%
Read Latency
188
231
23%
218
16%
Write Misses (103)
102
102
0%
102
0%
Write Latency
81
126
55%
127
56%
Parallel Execution Time (106 cycles)
DP
FP No Proc
Overhead
FP Proc
Overhead
FFT 16P
3.45
3.62
5%
5.19
51%
FFT 64P
1.11
1.17
5%
1.55
40%
21 21
20
15 15 11 2.0
|
0|
PILocalGetX PILocalUpgrade NILocalGet
PILocalGet
NIRemotePut
Figure 7. Handler Occupancies for FFT
reason for this becomes apparent. Without FlashPoint, the handler merely passes off the request to the processor interface. With FlashPoint, additional instructions are inserted. The handler latency is measured only up until the send, so it is unaffected. The handler occupancy includes all the PP instructions after the send, so it is here that the monitoring has an impact. Again, Table 4 shows occupancy perturbations for all four of the applications for two of the most common protocol handlers.
3.2.4 Summary In summary, FlashPoint is quite accurate in collecting statistics on miss counts with only minimal performance impact on the application. Furthermore, the per-data-structure miss counts and miss latencies (as a percentage of the total) are nearly identical between the unmonitored DP protocol and the monitored FlashPoint system. The overhead and the accuracy of FlashPoint also scale well with the number of processors.
Scaling Number of Processors One of the primary drawbacks to using simulation-based tools for performance monitoring parallel programs is that simulation time scales poorly with increased number of parallel processors to simulate. The result is that the runtime overhead of using a simulationbased tool can become prohibitive when one is interested in monitoring even a moderate number of processors. FlashPoint, in contrast, shows quite good scaling behavior with the number of processors.
FlashPoint’s implementation has a number of interesting design tradeoffs that affect both monitoring overhead and accuracy. For example, if the user does not want to collect latency information, but instead is only interested in miss counts, the overhead of FlashPoint would be much smaller. In the current installation, users can choose between NoProc and Proc versions of the protocol. In future installations, more versions could be available. In addition, since the FLASH multiprocessor uses an aggressive, out-of-order execution main compute processor, FlashPoint must be conservative in notifying MAGIC about procedure entry and exit points and data binning information. In particular, we use memory fence instructions to prevent newer loads and stores from bypassing the uncached write that changes the pointer to the current set of bins (which could potentially assign miss information to the wrong statistical bin). It is likely that the error introduced by not inserting the fence instructions is small, and that they can therefore be removed without adversely affecting the accuracy of FlashPoint. Since the fence stall time is the major source of execution time overhead in the per-procedure (FP-Proc) version of FlashPoint, removing the fence instructions will decrease the overall execution time dramatically, and may reduce the total amount of system perturbation as well.
As an example, Table 5 compares read and write miss counts and latencies generated for 16 and 64 processor runs of FFT. The miss count error remains negligible in the 64 processor case. The error in the miss latencies remains significant, but does not increase much with the number of processors. Table 5 also compares the 16 and 64 processor parallel execution times for each of our three protocol configurations. Surprisingly, the FlashPoint execution time overhead for FFT decreases as the number of processors increase, though handler occupancies are larger for the 64 processor case than for the 16 processor case. Overall as the number of processors increases, the performance trends depend on the application behavior. For example, if increasing the number of processors on a fixed problem size reduces capacity misses, then FlashPoint’s relative performance may actually improve with the number of processors, since the number of misses decreases.
8
4
Other Coherence Mechanisms
structure performance information a primary goal. While spaceconstraints limit our discussion, this belief is based on work such as SHMAP [DBK+90], MemSpy [MGA95], and CPROF [LW94]; in these tools, the authors argued strongly that the ability to get visualizations or performance data on individual data structures is instrumental to understanding program behavior. Other higherlevel approaches like MTool [GH93] also exist; we argue however that particularly in parallel code, additional statistics detail can be instrumental in understanding application memory referencing patterns.
The preceding example has taken an in-depth look at an implementation of a performance monitoring tool integrated into FLASH’s flexible coherence protocol. This section discusses other common classes of coherence protocols, and the support they offer for performance monitoring. Machines that implement user-level shared memory schemes, such as Typhoon [RLW94], also provide an excellent environment for performance-coherence integration. Typhoon is similar to FLASH in the sense that both architectures include a network interface device with a fully-programmable processor. This allows performance tools to be implemented relatively simply via changes in the protocol code running in the network interface processor. Among systems with programmable protocol processors, variations in block sizes may affect tool performance. FlashPoint benefits slightly from longer cache lines for two reasons. First, the data bin mapping of a new page is done by mapping each of the cache blocks within it, so larger lines require fewer individual mapping operations per new page. Second, FlashPoint’s overhead is fixed, regardless of the amount of data being transferred. With longer cache lines, one amortizes this overhead over more bytes of data, and the handler overhead is more likely to be hidden in parallel with the data transfer.
We have also touched only briefly on hardware monitoring support in current machines. In fact, over the past five to ten years, monitoring support has become increasingly available both on research and commercial machines. On-chip hardware counters are a class of monitoring support found on several current-generation processor chips, including the DEC Alpha 21164, MIPS R10000, and Intel Pentium processors. These counters—collecting information on data accesses, cache misses, pipeline stalls, and instruction mix—can be invaluable in collecting fine-grained information about program and system behavior. Unfortunately their main drawback, as discussed in [HMM+96], is that they are primarily intended to offer aggregate counts on hardware performance. Since the counters are often memory-mapped, the overhead to read the counter values can be quite high, so it is difficult to implement tools that can attribute individual cache misses to particular reference points in the code. In addition, the counters on current processors offer no mechanism by which software can observe and react to individual cache misses as in FlashPoint.
Fully hardwired implementations of directory-based protocols also offer some of the same advantages as FLASH’s programmable directory protocol. Whether implemented using a hardwired or programmable controller, directory protocols keep per-cache-line state information. For performance monitoring tools, this per-line information can be extended by only a few bits to store a unique id (bin number) indicating which data structure this cache line is a part of. The main difference is that the decision to support performance monitoring must be made at hardware design-time. In FlashPoint, data structures for per-procedure and per-data statistics are built up in software by the protocol’s handler code. To build a similar tool in a directory-based machine with a hardwired controller, additional hardware would be required to record counts and latencies of read and write events. Because of the hardwired implementation, users would have less flexibility in selecting levels of performance monitoring detail.
Several multiprocessors [Hei93, NAB+94, ABC+95] provide system-level monitoring hardware as well. For example, the DASH multiprocessor includes a monitoring board connected to each shared cluster bus, and the Alewife project includes monitoring hardware on the CMMU. Some such approaches have enough flexibility that they can gather statistics similar to those gathered by FlashPoint. The advantage of these approaches over FlashPoint is that by dedicating hardware for monitoring, they can design the monitor to be able to observe communication behavior without perturbation. The clear disadvantage, however, is their reliance on special-purpose hardware which tools like FlashPoint can circumvent.
Over time, scalable parallel machine designs are converging, as are the communication mechanisms in both “message-passing” and “shared-memory” machines. Although not hardware cache-coherent, machines like the Wisconsin COW [HLW95] or upcoming SHRIMP [BLA+94] implementations may also be amenable to integrating communication and performance monitoring. In these machines, the network interface is (or is likely to be) implemented using Myricom switches [BCF+95]. The core of these switches is a programmable controller implemented using the LANai processor. Thus, performance monitoring code could be inserted directly into the LANai handlers that support communication. Unfortunately, the 33MHz LANai processor is not nearly as high-performance as FLASH’s protocol processor. Furthermore, LANai is a single-issue processor, so there are fewer unused instruction slots where performance code could be inserted “for free”. On the other hand, LANai provides hardware support for two full contexts, and has a mechanism for switching between contexts in a single cycle. The freedom to place the performance instrumentation code in a separate context may allow for better register usage in the communications code itself.
5
Finally, by integrating the performance monitoring into the coherence protocol itself, one can also develop systems where the online performance information can be used by the protocol to customize handler actions according to the observed program data usage patterns. For example if the protocol notes that a processor is making frequent remote accesses to lines on a particular page, it could use this information to suggest to the operating system that it might be useful to migrate the page to this processor’s local memory. (This is similar to the approach described in [CDV+94], which used dedicated monitoring hardware.) More elaborate protocols might also use similar information to guide decisions of whether to use updates or invalidations to maintain the coherence of each line. For these types of applications, the integration of performance and coherence monitoring is especially useful; less integrated approaches (for example using profile data from a hardware trace buffer) do not work well because of extra overhead in detecting and responding to particular conditions.
6
Conclusions
This paper has explored the natural parallels between coherence and performance monitoring in cache-coherent, shared-memory multiprocessors. By taking advantage of existing coherence support on such machines, performance monitoring can often be integrated into a multiprocessor system with little design effort or cost.
Related Work
Implicit in the work described here were several assumptions based on related work. First, our implementation made per-data-
9
The extent to which performance monitoring can be implemented out of existing hardware and software depends on the coherence mechanism being used. In machines with programmable protocol controllers, it becomes especially easy to take advantage of these parallels. Changes required to implement even fairly detailed monitoring can be done entirely by modifying protocol code.
[DBK+90] J. Dongarra, O. Brewer, J. A. Kohl and S.Fineberg.A Tool to Aid in the Design, Implementation, and Understanding of Matrix Algorithms for Parallel Processors. Journal of Parallel and Distributed Computing. pages 185-202. Jun, 1990. [DEC92] DEC. DECChip 21064 RISC Microprocessor Preliminary Data Sheet. Technical report, 1992. [GH93] A.J. Goldberg and J. L. Hennessy. Mtool: An Integrated System for Performance Debugging Shared Memory Multiprocessor Applications. IEEE Trans. on Parallel and Distributed Systems, pages 28–40, Jan.1993. [Gol93] S. R. Goldschmidt. Simulation of Multiprocessors, Speed and Accuracy. Ph.D. Thesis, Stanford University, June, 1993. [JHei95] J. Heinrich. MIPS R10000 Microprocessor User’s Manual. 1995. [Hei93] M. Heinrich. DASH Performance Monitor Hardware Documentation. Stanford University, Unpublished Memo. 1993. [HGD+94] J. Heinlein, K. Gharachorloo, S. Dresser, et al. Integration of Message Passing and Shared Memory in the Stanford FLASH Multiprocessor. In Proc. 6th Int’l Conf. on Architectural Support for Programming Languages and Operating Systems, pages 38-50, Oct. 1994.
We have demonstrated the usefulness of this approach by implementing the FlashPoint memory performance monitoring tool as part of a software coherence protocol for the FLASH Multiprocessor. FlashPoint obtains detailed memory performance statistics at low overheads with good accuracy. Both per-bin cache miss counts as well as counts aggregated over the whole program run agree well with an unperturbed execution. Absolute measurements of cache miss latencies are more error-prone than cache miss counts, but relative comparisons of latencies attributed to different data structures remain quite accurate. For a collection of programs from the SPLASH-2 benchmark suite, FlashPoint runtime overhead was less than 10% for gathering per-data structure program statistics. When one uses FlashPoint to gather per-procedure and per-data structure statistics, the overheads increase somewhat, but are still generally less than 2X. This compares favorably with previous approaches with overheads of 10X or more. In addition, FlashPoint’s overheads scale well with the number of processors.
[HKO+94] M. Heinrich, J. Kuskin, D. Ofelt, et al. The Performance Impact of Flexibility in the Stanford FLASH Multiprocessor. In Proc. 6th Int’l Conf. on Architectural Support for Programming Languages and Operating Systems, pages 274-285, Oct. 1994. [HLW95] M. D. Hill, J. R. Larus, and D. A. Wood. Tempest: A Substrate for Portable Parallel Programs. Proc. Compcon. March, 1995.
Although the paper describes a case study based on a particular multiprocessor implementation, the observation of similarities between coherence and monitoring is both important and general. In light of a large and still-increasing processor-memory performance gap, memory performance monitoring is an essential part of application development in shared-memory multiprocessors. Using the techniques described here, efficient, useful support can be integrated into cache-coherent designs with relative ease and low cost.
7
[HMM+96] M.Horowitz, M. Martonosi, T. Mowry, M. D. Smith. Informing Memory Operations: Providing Memory Performance Feedback in Modern Processors. Proc. 23rd Int’l. Symp. on Computer Architecture., May, 1996. [HP90] J. Hennessy and D. Patterson. Computer Architecture: A Quantitative Approach. Morgan Kaufmann, 1990. [KOH+94] J. Kuskin, D. Ofelt, M. Heinrich, et al. The Stanford FLASH Multiprocessor. Proc. 21st Int’l. Symp. on Computer Architecture, Apr.1994. [LW94] A. R. Lebeck and D. A. Wood. Cache Profiling and the SPEC Benchmarks: A Case Study. IEEE Computer, October 1994. [Mar93] M. Martonosi. Analyzing and Tuning Memory Performance in Sequential and Parallel Programs. Ph.D. Thesis, Stanford Univ., Dec. 1993. [MGA95] M. Martonosi, A. Gupta and T. Anderson. Effectiveness of Trace Sampling for Performance Debugging Tools. Proc. ACM SIGMETRICS Conf. on Measurement and Modeling of Computer Systems. May, 1993. [Mat94] Terje Mathison. Pentium Secrets. Byte, pages 191-192, July 1994.
Acknowledgments
The FLASH Project is supported by ARPA contract DABT-94-C0054. In addition, Margaret Martonosi is supported in part by an NSF Career Award (CCR-9502516). We thank Chris Holt and the anonymous reviewers for making suggestions that improved FlashPoint and this paper.
8
References
[ABC+95] A. Agarwal, R. Bianchini, D. Chaiken, et al. The MIT Alewife Machine: Architecture and Performance. Proc. 22nd Int’l. Symp. on Computer Architecture. Jun, 1995.
[NAB+94] A. Nowatzyk, G. Aybay, M. Browne, et al. The S3.mp Scalable Shared Memory Multiprocessor. Proc. 27th Hawaii Int’l Conf. on System Sciences Vol. I: Architecture. pages 144-53. Jan, 1994. [RLW94] S. K. Reinhardt, J. R. Larus and D. A. Wood. Tempest and Typhoon: User-Level Shared Memory. Proc. 21st Int’l. Symposium on Computer Architecture. April, 1994. [Sim92] R. Simoni. Cache Coherence Directories for Scalable Multiprocessors. Ph.D. Thesis, Stanford Univ., Nov. 1992. [Smi92] M. D. Smith. Support for Speculative Execution in HighPerformance Processors. Ph.D. Thesis, Stanford Univ., Nov. 1992. [SJH89] M. D. Smith, M. Johnson, and M. Horowitz. Limits on Multiple Instruction Issue. Proc. 3rd Int’l Conf. on Architectural Support for Programming Languages and Operating Systems, 1989, pages 290-302. [Stall93] R. Stallman. Using and Porting GNU CC. Free Software Foundation, Cambridge, MA, June 1993.
[BCF+95] N. J. Boden, D. Cohen, R. E. Felderman, et al. Myrinet: A Gigabit-per-Second Local Area Network. IEEE Micro 15(1). pages 29-36. Feb., 1995. [BLA+94] M. A. Blumrich, K. Li, R. Alpert, et al. Virtual Memory Mapped Network Interface for the SHRIMP Multicomputer. Proc. 21st Int’l. Symp. on Computer Architecture. pages 141-153. April, 1994. [BM89] H. Burkhart and R. Millen. Performance-Measurement Tools in a Multiprocessor Environment. IEEE Trans. on Computers, 38(5):725–737, May 1989. [CDV+94] R. Chandra, S. Devine, B. Verghese, et al. Scheduling and Page Migration for Multiprocessor Compute Servers. In Proc. 6th Int’l Conf. on Architectural Support for Programming Languages and Operating Systems, pages 12–24, Oct. 1994.
[WOT+95] S. Woo, M. Ohara, E. Torrie, et al. Methodological Considerations and Characterization of the SPLASH-2 Parallel Application Suite. Proc. 22nd Int’l. Symp. on Computer Architecture. Jun, 1995. [ZH88] B. Zorn and P. N. Hilfinger. A Memory Allocation Profiler for C and Lisp. Technical Report UCB/CSD 88/404, Feb. 1988.
[D+92] D. Dobberpuhl et al. A 100MHz 64b Dual-issue CMOS Microprocessor. In Int’l Solid State Circuits Conf. Digest of Technical Papers, Feb 1992.
10