International Journal on Advances in Intelligent Systems, vol 3 no 1 & 2, year 2010, http://www.iariajournals.org/intelligent_systems/
65
Integration of Condition Monitoring in Self-optimizing Function Modules Applied to the Active Railway Guidance Module Christoph Sondermann-W¨olke University of Paderborn Mechatronics and Dynamics F¨urstenallee 11 33102 Paderborn, Germany Email:
[email protected]
Walter Sextro University of Paderborn Mechatronics and Dynamics F¨urstenallee 11 33102 Paderborn, Germany Email:
[email protected]
Abstract—New mechatronic systems, called self-optimizing systems, are able to adapt their behavior according to environmental, user and system specific influences. Self-optimizing systems are complex and due to their non-deterministic behavior comprise hidden risks, which cannot be foreseen in the design phase of the system. Therefore, modifications of the ISO 17359 condition monitoring policy for being able to cope with this new kind of systems are presented. Besides avoiding critical situations evoked by self-optimization, the proposed concept uses self-optimization to increase the dependability of the system. This concept is applied to the active guidance module of an innovative rail-bound vehicle. First test drives provide information for the enhancement of the implementation of realtime switching to appropriate control strategies. The different control strategies are investigated in detail. It is illustrated that influences on the system like different track sections or the desired velocity of the RailCab effect the system and can lead to a higher amount of flange contacts, which indicate higher wear and thus a reduction of the availability of the system. Therefore, these influences should be minded within the condition monitoring policy. Consequently, this article presents the condition monitoring policy for self-optimizing function modules and its application to the active railway guidance module. Keywords-dependability; condition monitoring; optimization; active railway guidance module
or more objectives leads to behavior adaptation. In general, there are two options for behavior adaptation: parameter or structural adaptation; whereas structural adaptation leads to compositional adaptation or reconfiguration. The determination of a suitable behavior is reflected by the selfoptimization process, which is subdivided into three actions. In the first action the situation is analyzed. Therefore, the influences, the current system state and the current degree of performance concerning the system objectives are collected. From this the next objectives are deduced within the second action. In the third action the system adapts its behavior with respect to the chosen objectives. Influences on the Technical System
Environment
System
User
O O1
System of Objectives
O2
(Internal Objectives)
O1.1 O1.2 O2.1 O2.2 O2.3
selfBehavior
I. I NTRODUCTION TO SELF - OPTIMIZING SYSTEMS Classical mechatronic systems use knowledge of mechanical and electrical engineering as well as information technology to open up new design concepts. Self-optimizing systems, which are the focus of research at the collaborative research center (CRC) at the University of Paderborn, augment these mechatronic systems with intelligent information processing [1][2]. This “inherent intelligence” is able to adapt the objectives of the system and hence the behavior of the system to changing influences. As depicted in Figure 1 these influences on the technical system could arise from the environment, the user or the system itself. Every selfoptimizing system features a system of objectives, whereas different objectives could be pursued by the system depending on the current situation and influences. The choice of one
Structure U(s)
1 s-l1
X1
1 s-l2 ..
X2
1 s-ln
Xn
Parameters
C1
C2 ..
Mathematical Description of the Behavior
x(t)=A.x(t)+B.u(t) y(t)=C.x(t)+D.u(t)
+ + Y(s) +
l1 0 0 0 l2 0 A= . . . 0 0 0
... 0 ... 0 ... . , ... ln
C = cT = c1 c2
...
cn
1
B = b = 1. 1
D=0
Cn
Specialized Representation of the System Structure
Specialized Representation of System Parameters
Technical System Figure 1.
Aspects of self-optimization
As every mechatronic system self-optimizing systems comprise the physical system, sensors, actuators and the information processing. The information processing of selfoptimizing systems is structured into three layers (see Figure 2) and is called operator-controller-module (OCM).
2010, © Copyright by authors, Published under agreement with IARIA - www.iaria.org
International Journal on Advances in Intelligent Systems, vol 3 no 1 & 2, year 2010, http://www.iariajournals.org/intelligent_systems/
66
The self-optimization process takes place in the cognitive operator. The optimization itself can be model-based or behavior-based. Model-based techniques enable predictive, time-independent optimization. Behavior-based techniques provide planning and assessment functions with respect to the current objectives. The cognitive operator processes information in soft real time. On the contrary, the controller works in hard real time. The controller supervises the mechatronic system, reads sensor data and adjusts the actuators. The reflective operator is situated in between these two layers. It has the task to supervise the controller. The chosen behavior adaptation of the system is passed from the cognitive operator to the reflective operator, which has to initiate the correct control strategy as well as controller parameter variations. The configuration control, a finite state machine, is responsible for switching control strategies, but has no direct impact on the actuators. Further information about the operator-controller-module are given in [3]. Operator-Controller-Module (OCM) cognitive information processing
Behavior-based Self-Optimization
soft real time
Planning Level
Cognitive Operator
Model-based Self-Optimization
Cognitive Loop reflective information processing
Reflective Operator
A
C
hard real time
Action Level
B
monitoring emergency
configurationcontrol
sequencer
...
Reflective Loop motor information processing
Controller configurations
C B
A
sensors
Motor Loop
actuators
physical system Figure 2.
Operator-Controller-Module
Self-optimizing system are complex and due to their nondeterministic behavior comprise hidden risks, which cannot be foreseen in the design phase of the system. A condition monitoring policy is needed to supervise the system behavior and avoid severe dependability-critical impacts of self-optimization. Furthermore, self-optimization is able to increase dependability by integrating the objectives reliability, availability and safety in the system of objectives. The paper is structured in five sections. This introduction
to self-optimizing systems is followed by a short survey of related work regarding maintenance and condition monitoring in Section II. Section III introduces the proposed condition monitoring policy for self-optimizing systems. Section IV presents the active guidance module as an application for the developed policy. Afterward Section V illustrates results of first test drives, which should enhance the implementation of the proposed concept. Finally, Section VI presents a conclusion and a gaze at future work. II. R ELATED W ORK According to the taxonomy proposed by Kothamasu et al. maintenance strategies can be subdivided into reactive and proactive maintenance, whereas the latter comprises preventive and predictive approaches [4]. Reactive maintenance is executed to correct a failure or avoid serious consequences, but not to avoid failures in advance. The preventive methods avoid failures, e.g., by fixed maintenance intervals, but only predictive maintenance monitors the current system behavior continuously. Due to the non-deterministic behavior of selfoptimizing systems the latter strategy is preferable. The two strategies, which are mentioned in the context of predictive maintenance, are reliability centered maintenance (RCM) and condition based maintenance (CBM). RCM is a combination of several maintenance strategies with respect to high reliability by minimum costs (cf. [5]). CBM is applicable, when the parameters, which should be monitored, are measurable by the system. Diverse techniques and methodologies for condition monitoring are well investigated [6] and applied for example in the field of advanced manufacturing [7]. The measured parameter is compared to an alarm value and if this value is exceeded the maintenance action is initiated. That is why Ma et al. [8] point out that condition monitoring in today’s complex systems is mostly regarded as an alarm tool for maintenance. Even the ISO 17359 defines mainly, how a condition monitoring policy should look like to establish a successful maintenance strategy [9]. For a good review on CBM including diagnosis and prognostic techniques see, e.g., Jardine et al. [10]. None of these maintenance strategies influence the dependability of the system in the operating phase. Instead merely the next maintenance time is determined. Condition monitoring is used to assess the current state of the monitored system or component. The focus concentrates on the short term prediction. As consequence Ma et al. [8] call for a holistic view on the system and postulate that both, short and long term prediction, are required . A first approach to calculate operational availability regarding optional machine configurations and technical services is given by Fleischer et al. [11]. Reliability and availability prognosis are established to optimize life cycle performance of the investigated machine tool. In the operating phase newer publications describe selfhealing, self-repairing and self-maintaining systems. As
2010, © Copyright by authors, Published under agreement with IARIA - www.iaria.org
International Journal on Advances in Intelligent Systems, vol 3 no 1 & 2, year 2010, http://www.iariajournals.org/intelligent_systems/
67
physical systems are not capable of repairing components like broken sensors, most of the concepts deal with software systems (cf. [12][13]). In the domain of mechanical systems Umeda [14] propose the development self-maintenance machines. The basis of these machines is functional redundancy as fault-tolerant scheme. As a first application a photocopier is designed self-maintaining [15]. III. C ONDITION MONITORING IN SELF - OPTIMIZING SYSTEMS
Self-optimizing systems comprise the risk of unforeseen failures due to their complexity and inherent nondeterministic behavior. Nevertheless self-optimization could be used to increase the dependability of the technical system. This section presents the established multi-level dependability concept and highlights how this concept could be embedded in an augmented condition monitoring policy. A. Multi-level Dependability Concept To reduce the risks and use the potentials of selfoptimization the multi-level dependability concept (MLDC) has been developed (cf. [16]). This concept is situated in the reflective operator and subdivided into four hierarchically ordered levels (see Figure 3). On the one hand the concept offers well-directed measures to react on monitored circumstances and on the other hand the importance of the objective dependability is characterized and feed back to the cognitive operator.
Figure 3.
Multi-level dependability concept
The levels of the dependability concept and the impacts on the system of objectives are explained in detail in the following: •
Level I: The system operates in a dependable way. Dependability is one objective among others.
Level II: An error has occurred. Self-optimization is used to return to the first level. Therefore, the priority of the affected attribute of dependability is increased. • Level III: A severe error has occurred. First emergency mechanisms are triggered to reach a safer state. In the system of objectives safety is the sole objective to avoid the failure of the whole system and the consequences involved. The other attributes of dependability may occur as sub-objectives of safety. • Level IV: The control over the system is lost. Mechanisms, like emergency routines, are executed to reach a fail-safe state. In conjunction with the configuration control the multilevel dependability provides an interface between the fast controller structure and the self-optimization process in the cognitive operator. •
B. Condition Monitoring Policy for Self-optimizing Systems In this contribution the multi-level dependability is embedded as one part of the proposed policy of establishing condition monitoring. This policy is based on the common ISO 17359 policy [9]. This standardized policy has to be augmented and modified mainly in the operating phase by steps and details that utilize the advantages of selfoptimization. In Figure 4 the steps of the adapted condition monitoring policy are illustrated. New or modified steps within the policy are highlighted in gray. The other steps (white background) are consistent with the ISO 17359. The policy is divided into three main phases: the design phase, the operating phase and the maintenance phase. 1) Design phase: The design phase of the condition monitoring policy should be parallel to the design phase of the system. The development of the system should be accompanied by the identification of self-optimizing potentials [17]. For self-optimizing systems the advantages of self-optimization over well-established design solutions must be exposed. This analysis highlights the variables and structures, which can be influenced by self-optimization and hence used for the condition monitoring proactive measures. Furthermore, the inherent objectives of the system are defined in this stage and obviously dependability should be one of them. Dependability in our case, as an abstract objective, is defined according to Laprie [18] by its four attributes reliability, availability, safety and security, whereas the latter plays a minor role in self-optimizing function modules. In the subsequent reliability analysis several methods like reliability block diagram, failure mode and effects analysis, and fault tree analysis can be applied to classify the risks and to reveal dependencies and fault propagation paths. Being in parallel with the development process, an early reliability audit is able to avoid misconstructions and to add required system redundancy for critical functions. After the reliability analysis highlights parameters, which influence the dependability, these parameters should be mapped onto
2010, © Copyright by authors, Published under agreement with IARIA - www.iaria.org
International Journal on Advances in Intelligent Systems, vol 3 no 1 & 2, year 2010, http://www.iariajournals.org/intelligent_systems/
68
System audit
Design phase
Dependability audit Select measurement method Set initial alarm critteria/ Implementation of multi-level dependability concept (MLDC) Set up Configuration control incl. Model Checking Take measurements and trend readings Compare measurements with MLDC
Operating phase
y Level I ?
n Perform diagnosis and short-term prognosis
Perform long-term prognosis
Level I ?
y
n Determine required action
Maintenance required?
Maintenance
the dependability attributes safety, availability and reliability. The attributes are described by corresponding mathematical equations, e.g., failure rate or survival probability for reliability or mean time between failure (MTBF) for availability (cf. [19]). These steps make the function module comparable with other modules or the whole system. The required parameters should be measurable to install proactive measures. As explained above, the preferable maintenance strategy for self-optimizing systems is predictive maintenance. As a consequence of this the proposed decision step of the ISO 17359 to install corrective or preventive maintenance is left out. Thus, in the current step suitable measurement methods for the predictive maintenance parameters are selected. The next step in the proposed condition monitoring policy is the implementation of multi-level dependability concepts, which classify the current state on basis of the dependability quantities. In most cases there is one multi-level dependability concept for availability, safety and reliability. The implementation and hence the specification of the alarm values and the priority of the quantities depend on the investigated function module. The next step is to set up the configuration control, which is also situated in the reflective operator. The configuration control choses the desired control strategy according to the current situation and is defined by a finite state machine. A state machine consists of states and transitions. The states arise from the different control concepts of the development phase. For example, redundancy and degradation concepts are reflected in this state machine. The transitions could be derived from the reliability analysis. A fault tree analysis for each state indicates the state transitions. The configuration control is a dependability-critical component and it has to be guaranteed that the state machine itself processes faultlessly. This can be done by model checking, which is extended for real time mechatronic systems [20][21]. 2) Operating phase: The first step in the operation phase is taking measurements of the monitored parameters and calculate the resulting dependability quantities. This information is transmitted on the one hand to a hard real time information processing (left branch in Figure 4). The quantities are compared immediately with the multi-level dependability concept. If the state of the system is still Level I, the system is in a regular state. Otherwise the system performs known diagnosis and short term prediction methods to deduce the required action. This process step works in hard real time, which is necessary to initiate emergency routines. On the other hand the quantities are passed to the cognitive operator, which works in soft real time (right branch in Figure 4). On the basis of further knowledge the long term progression of the system is analyzed and the dependability quantities are updated for a point in time in the future. Afterward the retrieved quantities are compared with the multi-level dependability concept within the reflective
n
y Determine required maintenance action Feed back results to history record Review
Figure 4. Condition Monitoring policy for self-optimizing function modules – new or modified steps are highlighted in gray
operator and checked if the system will still be in Level I for a finite horizon of time. If Level I is exceeded a suitable proactive measure has to be taken. An example for planning in combination with the multi-level dependability concept is given in [22]. In the subsequent step – if Level I is exceeded – the required action is determined. Basis of the decision is the current classification within the multi-level dependability concept. If the system state is in Level IV a fast reaction like an emergency routine is necessary. In Level II or Level III the objective dependability is increased in the system of objectives. Additionally, the configuration control can be triggered to change the control strategy. In a first approach the dependability Levels from the short term and long term prognosis are compared. The worse Level is used and fed back to the self-optimization process for weighting the objective dependability.
2010, © Copyright by authors, Published under agreement with IARIA - www.iaria.org
International Journal on Advances in Intelligent Systems, vol 3 no 1 & 2, year 2010, http://www.iariajournals.org/intelligent_systems/
69
3) Maintenance phase: If maintenance is required, which should be the result of the short term and long term prediction in the previous step, the designated maintenance action is scheduled. As in the policy of the ISO 17359 the results are fed back to history record and prepared for review. IV. A PPLICATION TO THE ACTIVE GUIDANCE MODULE The main demonstrator of the CRC at the University of Paderborn is an innovative railway system. Independent vehicles, called RailCabs, are able to transport passengers or goods non-stop from departure to destination. Moreover, these RailCabs form convoys to take advantage of slipstream and to reduce the energy consumption of the following RailCabs. To dissolve these convoys at switches at high velocities (intended maximum velocity is about 180km/h), the switch remain passive and the single RailCab steers in the desired direction. The responsible module for this steering action is called active guidance module. The module with its most important components is shown in Figure 5. Besides steering in passive switches, the guidance module reduces wear on wheels and rails by avoiding flange contacts on straight tracks as well as in curves by compensating disturbances like track irregularities and side wind. Other influences on the active guidance module could occur from the RailCab itself, which, for example, restricts the energy consumption of the module or varies the velocity. During the operating phase the human has currently no influence on the system of objectives and therefore is not considered. center pivot axle steering actuator (hydraulic cylinder)
axle-carrier emergency brakes eddy-current sensors Figure 5.
Active guidance module
In the following the proposed condition monitoring policy (Figure 4) is applied to this active guidance module. Within the system audit the potential of self-optimization should be pointed out. The controlled parameter in the active guidance module is the steering angle. This angle is calculated by an optimized trajectory, which utilizes the track clearance to adapt to the desired objective. In general, there are two antagonistic objectives that the active guidance module can pursue reasonably.
On one hand the objective is to reduce energy consumption. This leads to the reduction of steering activity and trajectories that somehow “cut curves”. This results in a higher probability of flange contacts and a reduction of the availability of the system due to wear on wheels. Hence, on the other hand the objective is to minimize the wear on wheels, which leads to a trajectory near the center line of the track clearance to avoid flange contacts. This leads to a conflict within the system of objectives and thus to a multiobjective optimization which result is a Pareto set for the chosen objectives. More information about the generation of optimized trajectories using model-based optimization within the guidance module can be found in [23]. In the dependability audit a first failure mode and effects analysis (FMEA) is conducted to find non-tolerable risk and measures like additional redundancy to secure the system. This analysis is based on the principle solution of the guidance module. One result of the FMEA is that the determination of the lateral position, which is measured by eddy currents sensors, is important for the control of the guidance module as failures in the measurement can lead to severe faults like the derailment of the RailCab. Therefore, the eddy current sensors are attached in active redundancy. Two pairs of sensors for each guidance module are installed, whereas one pair requires that both sensors are working. If both pairs of sensors are working well, the mean is used to enhance the accuracy of the sensor signal. If one pair of sensor fails, this leads to a deterioration of the signal. For measuring the longitudinal position four incremental sensors, each at a wheel, are used. The mean is calculated to refine the measurement. As the incremental sensors are subjected to drift, the sensors are updated by proximity switches every 15m. The next step is to link the physical parameters to the dependability attributes. Wear on wheels, for example, is inversely proportional to the availability of the guidance module. The accurate relation has to be determined experimentally, whereas as a matter of fact flange contacts lead to higher wear. Considering the dependability attributes safety the physical quantity to keep the system safe is the lateral acceleration. The lateral acceleration should be low to avoid derailment by hard flange contact. Regarding reliability, the state of each component required for the controlling actions is monitored. Sensor failures could have an serious impact on the reliability of control strategies. A fault-tree analysis (FTA) is used to determine which events have to occur to force system degradation. Additionally, the quantitative FTA provides an indication of setting the alarm values of the multi-level dependability concepts regarding reliability. To set the alarm levels of the attribute availability and investigate which parameter would support undesired flange contacts, several test drives are made. Figure 6 shows the different control strategies, which are also specified in the design phase, and the classification con-
2010, © Copyright by authors, Published under agreement with IARIA - www.iaria.org
International Journal on Advances in Intelligent Systems, vol 3 no 1 & 2, year 2010, http://www.iariajournals.org/intelligent_systems/
70
sidering the multi-level dependability concept with respect to reliability. The control strategies include in most cases a track position controller, which gets a desired trajectory as set value, and a feed forward control based on the current curvature of the track. In Level I the trajectory is generated by the self-optimization process with a high priority on the minimization of the energy consumption. If a failure in an eddy current sensor occurs or the self-optimization process produces inadequate results the system state is classified into Level II. In the first case the self-optimization process assigns more priority on the dependability of the system the reliability and availability of the system increases. In the latter case the center line of the clearance is used as fallback trajectory for the track position controller (track position controller A - both sensors pairs working). If one pair of sensors fails without having the possibility to use selfoptimization the state is sorted into Level III (track position controller B). The map-based feed forward control is used, if all eddy current sensors fail. In this control strategy the steering angle is only set due to the curvature of the track. The emergency routine in the fourth level is fixing the axle to avoid uncontrolled behavior. So only in the first two levels self-optimization is used to enhance the dependability.
Figure 6.
Interrelation Configuration Control and FTA
Figure 6 illustrates that these different control strategies are utilized as states in the state chart of the configuration control. As the states are derived from the given control structure the transitions could be derived from the FTA by
choosing the failure of every control strategy as top event. For the determination of the transitions every fault tree is divided into minimal cut sets. The exact policy is descibed in DIN EN 61025 [24]. At the moment, expert knowledge is used to determine which minimal cut set belongs to which transition. One example of such a cut set is shown in Figure 6, which is linked to the transition manually. The condition of the transition could be derived by the Boolean Algebra, which is given by the fault tree notation. As explained above, the four redundant eddy current sensor (ecs) are ordered in the following way. Two sensors work together as a pair. If one sensor fails then the whole pair fails. So this relation is indicated by an OR-Gate. The other pair is still working. If also the second pair fails the track position controller is not able to work anymore (AND-Gate) and the transition of the state chart is triggered and the state switches to the map-based feed forward control. The adequate Boolean expression, which is deduced from the fault tree is (ecs1 ∨ ecs2) ∧ (ecs3 ∨ ecs4).
(1)
Regarding the guidance module the attributes reliability and availability are investigated. The reliability is reduced, if, e.g., certain failures in the hardware occur. The paper focuses on sensor failures, which handicap the control of the guidance module. Availability is quite similar as it is assumed that the number of flange contacts rises if a failure occurs. So the number of flange contacts could be used to assess the current availability of the system, respectively, to calculate the residual life time. As mentioned above, the established state chart refers to the fault tree analysis of the different control strategies. The ordering of the different control strategies to a certain alarm level is based on expert knowledge. It is depicted that only degradation processes are possible. The repair of the system takes place in the maintenance phase of the system. To avoid undesired behavior of the system, an advanced model checking is conducted on the state chart (cf. [25]). The model checking has to guarantee, for example, that the fail-safe state could be reached from every current state if a severe failure occurs. This concept is implemented on the active guidance module. To validate and enhance this concept it is necessary to take a closer look on the operating phase of the system. Therefore, several test drives were made to examine which parameter has got a relevant influence on the system behavior. In the next section selected results of the test drives are shown. V. E XPERIMENTAL RESULTS The test drives were conducted on the test track next to the University of Paderborn. In Figure 7 the test bed is shown. On the left side the RailCab is depicted. The RailCab on a scale of 1:2.5 is able to drive on the test track with a maximum velocity of about 10 m/s. The oval test track
2010, © Copyright by authors, Published under agreement with IARIA - www.iaria.org
International Journal on Advances in Intelligent Systems, vol 3 no 1 & 2, year 2010, http://www.iariajournals.org/intelligent_systems/
71
(a) RailCab on a scale of 1:2.5
(b) Test track next to the University of Paderborn Figure 7.
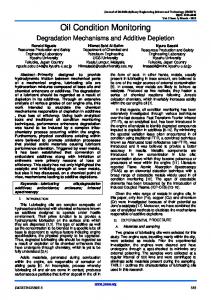
is 450m in length. The described multi-level dependability concept and the configuration control are programmed with Matlab/ Simulink and transferred to the dSPACE real time hardware on the RailCab. In the following three sections the results of different test drives are illustrated, whereas each section has a different focus. In the first section the control strategies are investigated. Besides driving with the track position controller in energy-optimized and dependability-optimized mode failures are induced to gain knowledge about the behavior in the case of a failure. For a comparison also the map-based feed forward control is investigated. In the second section the influence of different track sections is examined. The test track is subdivided into straights, clothoids and curves. The third section shows results for driving at different velocities. The assessment parameter of all test drives is the summed length of the flange contacts qf c . The flange contacts are calculated by the relation between the clearance c and the lateral position ry qf c =
2ry . c
(2)
If qf c ≥ 1 a flange contact is detected. The length of the flange contact is calculate by the determination of the beginning and end of each flange contact. A. Comparison of different control strategies The failure mode and effects analysis within the design phase of the proposed policy points out that the eddy current sensors are dependability-critical components. As consequence they are built up in hardware redundancy. This offers the option to use the mean of both sensor pairs to get an more accurate signal. But if one pair fails this leads to a reduction of the signal quality. If both pairs fail, the map-based feed forward control is the last possible control strategy. This section shows a comparison between
Test bed
the different control strategies and the impact of failures of the eddy current sensors. Table I lists the different test drives, which are investigated. All test drives were done at a velocity of 5m/s. The track sections of the passive switch are neglected in the evaluation because in the passive switch the active guidance module steers the RailCab next to the left or right rail to pass the switch. So a lot of flange contacts are expected, which would bias the results. Table I T EST DRIVES WITH DIFFERENT CONTROL STRATEGIES Test drive
Control strategy
failure of eddy current sensors
1
Dependability-optimized + track position controller
no failure
2
Energy-optimized + track position controller
no failure
3
Energy-optimized + track position controller
failure one pair
4
Dependability-optimized + track position controller
failure one pair
5
map-based feed forward control
failure both pairs
The results of the first test drives are depicted in Figure 8. The flange contacts are shown in m. The complete track without the passive switch sections is about 350m in length. Comparing the two rounds it is obvious that the test drives are highly reproducible. The comparison of drive number one and two shows that the dependability-optimized trajectory leads to lesser flange contacts in m than the energyoptimized trajectory. This is expected as the dependabilityoptimized trajectory tries to keep the RailCab next to the center line of the clearance, whereas the energy-optimized trajectory gets quite close to the rails to reduce the energy consumption. This could result in flange contacts due to the underlying controller of the hydraulic actuator. Furthermore,
2010, © Copyright by authors, Published under agreement with IARIA - www.iaria.org
International Journal on Advances in Intelligent Systems, vol 3 no 1 & 2, year 2010, http://www.iariajournals.org/intelligent_systems/
72
the figure illustrates that the flange contacts in m increase if one pair of eddy current sensor fails (drive number three and four compared to drive number one and two). For the availability of the system it is an option to change to the dependability-optimized trajectory in the case of a failure. The fifth test drive shows that the summed length of flange contacts increase significantly if the guidance module has to switch to the map-based feed forward control.
Sum of flange contacts [m]
70 60
First Round Second Round
50 40 30 20
driving two rounds with 5m/s on the test track. The first three bars refer to drives with the dependability-optimized control strategy (two of them cannot be seen due to the flange contacts are zero) and the second three bars refer to drives with the energy-optimized control strategy. It is illustrated by comparing both strategies, that in every track section type the dependability-optimized strategy counts lesser flange contacts (cf. preceding section). The comparison of the track section is given in percent. This is due to the different length of the track sections. The length of the straight and clothoid is 50m, whereas the length of the curve is 77m. Within the dependability-optimized drives only in curves were some flange contacts (0.18%). It is depicted that driving a straight road in the energy-optimized way leads to lesser flange contacts that in the clothoid and driving a clothoid produces lesser flange contacts than driving a curve. This is due to the lateral accelerations, which forces the RailCab to drive more on the outer rail. The flange contacts increase from straight to curved track because the trajectory has to compensate the curvature in addition to the track irregularities.
10 1 Figure 8.
2
3 Test drive
4
5
Flange contact in different control strategies
As these results show, self-optimization, e.g., different objectives like energy-optimized or dependability-optimized, leads to significant different amounts of flange contacts. Furthermore, it is illustrated, that in the case of a sensor failure the amount of flange contacts increases in both modes. But a change in the objectives from energy-optimized to dependability-optimized could decrease the number of flange contacts and thus the wear on the wheels. For the comparison the objectives have either high priority on energy or high priority on dependability. A compromise of both objectives as calculated within the multi-objective optimization could be more appropriate. B. Comparison of track sections In the preceding section is discussed, that sensor failures can lead to higher flange contacts. A higher number of flange contacts can lead to an adaptation of the behavior. For the condition monitoring it plays a decisive role which factors or influences can also lead to an increased amount of flange contacts. In this and the following section two influences are discussed: the influence of the current track section and the influence of the velocity of the RailCab. If the impact of these influences is known we are able to use it for the analysis of the current situation. Considering longterm prognosis we are able to adapt the behavior in advance. The test track consists of three different track sections: straights, clothoids and curves. Figure 9 shows the results for
Sum of flange contacts [%]
0
10 8
Straight Clothoid Curve
6 4 2 0
dependability energy Objective of controller strategy Figure 9.
Comparison of different track sections
The showed effect leads to several consequences. First of all it is obvious that the current track type has to be considered while analyzing the current situation. Furthermore, the track type could be one parameter regarding the longterm prognosis of the guidance module. If it is desirable to increase the availability by reducing the wear on wheels and rails, it is preferable to assign a higher priority on the objective dependability in curves. C. Comparison of different velocities The comparison of different velocities is important, because a measure to react on failures and thus to lower the amount of flange contacts could be the reduction of the velocity of the RailCab. Figure 10 illustrates the results of
2010, © Copyright by authors, Published under agreement with IARIA - www.iaria.org
International Journal on Advances in Intelligent Systems, vol 3 no 1 & 2, year 2010, http://www.iariajournals.org/intelligent_systems/
73
the test drives regarding the velocity. Again, the first three bars refer to the dependability-optimized and the second three bars refer to the energy-optimized control strategy. The test drives were executed at 3m/s, 5m/s and 7m/s. 40 Sum of flange contacts [m]
35 30
3m/s 5m/s 7m/s
25 20 15 10 5 0
dependability energy Objective of controller strategy Figure 10.
Comparison of different velocities
As it can be seen in Table II the results are highly reproducible. The change in flange contacts regarding the velocity is low. Only in the first round driving with 3m/s the resulting flange contacts (17.954m) are higher than expected. Overall it could be stated that the higher the velocity the higher is the amount of flange contacts in m. The difference between the optimization control strategies is again significant. Driving in the dependability-optimized control strategy always leads to lesser flange contacts. Table II F LANGE CONTACTS [ M ] AT DIFFERENT VELOCITIES control strategy
round
3m/s
5m/s
7m/s
Dependability-optimized + track position controller
1
0.953
1.184
1.249
Dependability-optimized + track position controller
2
0.474
1.159
1.558
Energy-optimized + track position controller
1
17.954
17.869
18.042
Energy-optimized + track position controller
2
16.612
17.354
18.507
In the end, reducing the velocity could be a mean to reduce flange contacts. In combination with a change in the control strategy from energy-optimized to dependabilityoptimized the flange contacts could be lowered even more. In our test cases the effect of reducing the velocity is small. Even smaller than setting the priority of the optimization more to dependability strategy. This difference will be more significant at higher velocities.
VI. C ONCLUSION AND F UTURE W ORK This contribution shows a policy for increasing the dependability of self-optimizing systems. The ISO 17359 condition monitoring process is modified to combine condition monitoring and self-optimization. In today’s applications condition monitoring is seen as a tool for the succeeding maintenance action, whereas the policy proposed in this contribution focuses on the operating phase. The multi-level dependability concept is embedded in this policy to avoid risks from self-optimization and to increase the objectives availability, reliability and safety. So systems with a selfoptimizing component constitute a new kind of redundancy to reach the highest reliability or availability level that is feasible. The proposed policy is applied to the active selfoptimizing guidance module of an innovative rail-bound vehicle. On one hand the experimental results illustrate that selfoptimization is able to compensate sensor failures by changing the objective from “minimizing energy consumption” to “maximize dependability”. Additionally, the difference in driving the established control strategies considering the flange contact are pointed out. For the comparison of test drives the test drives were conducted with a high priority on dependability or a high priority on reducing energy consumption. It is preferable to use a smooth or continuous modification of the priorities in the future. On the other hand the results give first advices for the integration of prognosis. The current track section and the current velocity should be considered. The gained information could also be use to enhance the long-term prognosis of the residual life time of the guidance module. So the next step in testing will be the use of diagnostics as well as short and long term prediction. The combination of both is already destined in the proposed condition monitoring policy. As the long term prediction is also done within the cognitive operator by the planning component this is an interesting point of research for the integration of condition monitoring in self-optimizing systems. At the current point of research the work is explicit for mechatronic function modules like the active railway guidance module. A further step is to interlink the diverse function modules of the RailCab and examine the whole system with respect to reliability-centered condition monitoring. ACKNOWLEDGMENT This contribution was developed in the course of the Collaborative Research Center 614 “Self-Optimizing Concepts and Structures in Mechanical Engineering” funded by the German Research Foundation (DFG). The authors would also like to thank Jens Geisler who accompanied the test drives.
2010, © Copyright by authors, Published under agreement with IARIA - www.iaria.org
International Journal on Advances in Intelligent Systems, vol 3 no 1 & 2, year 2010, http://www.iariajournals.org/intelligent_systems/
74
R EFERENCES [1] C. Sondermann-W¨olke and W. Sextro, “Towards the integration of condition monitoring in self-optimizing function modules,” in 2009 Computation World: Future Computing, Service Computation, Cognitive, Adaptive, Content, Patterns, Nov. 15-20, 2009, Athens, Greece, 2009, pp. 15–20. [2] J. Gausemeier, S. Kahl, and S. Pook, “From mechatronics to self-optimizing systems,” in Self-optimizing Mechatronic Systems: Design the Future, 7th International Heinz Nixdorf Symposium, Feb. 20-21, 2008, Paderborn, Germany, 2008, pp. 3–32. [3] T. Hestermeyer, O. Oberschelp, and H. Giese, “Structured information processing for self-optimizing mechatronic systems,” in Proc. of 1st International Conference on Informatics in Control, Automation and Robotics (ICINCO 2004), Setubal, Portugal, 2004, pp. 230–237. [4] R. Kothamasu, S. Huang, and W. VerDuin, “System health monitoring and prognostics–a review of current paradigms and practices,” The International Journal of Advanced Manufacturing Technology, vol. 28, no. 9, pp. 1012–1024, 2006. [5] M. Rausand, “Reliability centered maintenance,” Reliability Engineering & System Safety, vol. 60, no. 2, pp. 121–132, 1998. [6] A. Davies, Ed., Handbook of Condition Monitoring – Techniques and Methodology. Chapman and Hall, 1998. [7] L. Wang and R. X. Gao, Eds., Condition Monitoring and Control for Intelligent Manufacturing, ser. Advanced Manufacturing. Springer London, 2006. [8] L. Ma, “Condition monitoring in engineering asset management,” in 12th Asia-Pacific Vibration Conference, August 6-9, 2007, Sapporo, Japan, 2007. [9] DIN ISO 17359, “Condition monitoring and diagnostics of machines – general guidlines,” 2003. [10] A. Jardine, D. Lin, and D. Banjevic, “A review on machinery diagnostics and prognostics implementing condition-based maintenance,” Mechanical Systems and Signal Processing, vol. 20, no. 7, pp. 1483–1510, 2006. [11] J. Fleischer, S. Niggeschmidt, and M. Wawerla, “Optimizing the Life-Cycle-Performance of Machine Tools by Reliability and Availability Prognosis,” in Advances in Life Cycle Engineering for Sustainable Manufacturing Businesses: Proceedings of the 14th Cirp Conference on Life Cycle Engineering, Waseda University, Tokyo, Japan, June 11th13th, 2007. Springer, 2007, p. 329. [12] D. Garlan, J. Kramer, and A. L. Wolf, Proceedings of the First Workshop on Self-Healing Systems, WOSS 2002, Charleston, South Carolina, USA, November 18-19, 2002. ACM, 2002.
[14] Y. Umeda, T. Tomiyama, H. Yoshikawa, and Y. Shimomura, “Using functional maintenance to improve fault tolerance,” IEEE Expert, vol. 9, no. 3, pp. 25–31, 1994. [15] Y. Shimomura, S. Tanigawa, Y. Umeda, and T. Tomiyama, “Development of self-maintenance photocopiers,” AI Magazine, vol. 16, no. 4, pp. 41–53, 1995. [16] C. Sondermann-W¨olke, J. Geisler, T. M¨uller, A. Tr¨achtler, and J. B¨ocker, “The active guidance module of a rail-bound vehicle as an application for the dependability oriented design in self-optimizing systems,” in ASME2008 - International Design Engineering Technical Conferences & Computers and Information in Engineering Conference, New York, 2008. [17] J. Gausemeier, U. Frank, and D. Steffen, Reconfigurable Manufacturing Systems and Transformable Factories. Springer, 2006, ch. 36: Intelligent Systems, Self-optimizing Concepts and Structures, pp. 719–742. [18] J.C. Laprie, Ed., Dependability: Basic Concepts and Terminology in English, French, German, Italian, and Japanese. Wien: Springer, 1992. [19] A. Birolini, Reliability Engineering – Theory and Practice, 3rd ed. Springer Berlin, 2003. [20] H. Giese, S. Burmester, W. Schafer, and O. Oberschelp, “Modular design and verification of component-based mechatronic systems with online-reconfiguration,” ACM SIGSOFT Software Engineering Notes, vol. 29, no. 6, pp. 179–188, 2004. [21] H. Giese and M. Hirsch, “Modular Verification of Safe Online-Reconfiguration for Proactive Components in Mechatronic UML,” Lecture Notes in Computer Science, vol. 3844, pp. 67–78, 2006. [22] B. Kl¨opper, C. Sondermann-W¨olke, C. Romaus, and H. V¨ocking, “Probabilistic planning integrated in a multilevel dependability concept for mechatronic systems,” in 2009 IEEE Symposium on Computational Intelligence in Control and Automation, Mar. 30 - Apr. 2, 2009. IEEE, 2009, pp. 104–111. [23] J. Geisler, K. Witting, A. Tr¨achtler, and M. Dellnitz, “Multiobjective optimization of control trajectories for the guidance of a rail-bound vehicle,” in Proceedings of the 17th World congress The International Federation of Automatic Control, 2008, pp. 4380–4386. [24] IEC 61025:2006, “Fault tree analysis (FTA); German version EN 61025:2007,” August 2007. [25] C. Sondermann-W¨olke, J. Geisler, M. Hirsch, and T. Hemsel, “Verl¨asslichkeit im aktiven selbstoptimierenden Spurf¨uhrungsmodul eines schienengebundenen Fahrzeugs,” in 6. Paderborner Workshop Entwurf mechatronischer Systeme, Apr. 2-3, 2009, 2009, pp. 231–243.
[13] S. Takata, F. Kirnura, F. Van Houten, E. Westkamper, M. Shpitalni, D. Ceglarek, and J. Lee, “Maintenance: changing role in life cycle management,” CIRP Annals-Manufacturing Technology, vol. 53, no. 2, pp. 643–655, 2004.
2010, © Copyright by authors, Published under agreement with IARIA - www.iaria.org