Integration of Unsupervised Clustering, Interaction and Parallel Coordinates for the Exploration of Large Multivariate Data Jimmy Johansson Link¨oping University
[email protected]
Robert Treloar Unilever Research
[email protected]
Mikael Jern Link¨oping University
[email protected]
Abstract Parallel coordinates are widely used in many applications for visualization of multivariate data. Because of the nature of parallel coordinates, the visualization technique is often used for data overview. However, when the number of tuples to be visualized becomes very large, this technique makes it difficult to distinguish the overall structure. In this paper we present a novel technique which uses a classification approach, the self-organizing map (an unsupervised learning algorithm), to solve this problem by creating an initial clustering of the data. By initially only visualizing the resulting representational clusters, the inherited global structure can be shown. Using linked views and allowing the user to perform drill-down and filtering on these representations reveals the single data items without loss of context.
Keywords— Parallel coordinates, unsupervised clustering, linked views, interactive visualization.
1. Introduction Visualization of multivariate data is a challenging task. The goal is not the display of multiple data dimensions but user comprehension of the multivariate data. Parallel coordinates [7] is one of the established techniques transforming multi-dimensional patterns into two-dimensional patterns. Visualization is facilitated by viewing the two-dimensional representation of the m-dimensional data items as lines crossing m parallel axes (figure 1), each of which represents one dimension of the original feature space. This approach scales well with increasing m and has been incorporated into several data analysis tools. There are well-known issues with the representation when the number of tuples in a data set gets large. In our present application we have defined a large data set to be visualized with parallel coordinates to be one which contains at least 10,000 tuples each containing more than 10
Figure 1. Three tuples visualized with parallel coordinates.
data items. The parallel coordinates technique does not provide a good overview and it becomes hard to see the structure in the data (figure 2). Pre-processing or filtering the data is required as an integrated step in the visualization process. In recent years, several research efforts have been made directed towards enhancing the parallel coordinates technique to make it more effective for exploring large multivariate data sets. Fua, Ward and Rundensteiner [4] propose a multiresolutional view of the data via hierarchical clustering. By displaying groups of data at different levels of abstraction, the amount of clutter can be reduced. Their implementation provides a number of interaction techniques, such as drill-down, dimension zooming and structure based brushing, in order to manipulate the data and to navigate within the hierarchy. Wong and Bergeron [20] propose wavelet brushing as a technique for browsing large multidimensional multivariate data sets. Siirtola [15] uses a technique called polyline averaging that aggregates a set of user specified lines in a parallel coordinates chart providing a better overview of the data. Linked or coordinated views [3, 1] is another recognized technique for analyzing multivariate data. One movement or change in one view automatically propagates to all other views. This technique was successfully implemented by Brodbeck and Girardin [2], to analyze high-dimensional data in the field of geo-engineering and has also been used by Mukherjea, Foley and Hudson [12] to make a complex hypermedia system understandable to the user. In evaluating their snap-together visualization system, North and Shnei-
derman [13] have found that this technique enhances userperformance in data analysis tasks. It can be described as giving the user an impression of touching the data. Our research builds on several of the ideas discussed above. As in [4] we use a clustering technique to enhance the visualization of large multivariate data but we use an unsupervised learning algorithm (the self-organizing map (SOM) [9, 18, 8]) instead of the more traditional clustering techniques (see [6] for a survey). We also use interaction techniques, such as drill-down, filtering and zooming as discussed in [4, 15]. As in [3, 1] we use linked views to further facilitate the visualization of the calculated clusters. In this paper we focus on the tight coupling between the SOM algorithm and the parallel coordinates technique. Our goal is to find and catalogue patterns, trends and clusters or similarities in large multivariate data sets that normally would be hidden from us. We have developed a demonstration application that uses parallel coordinates to display clusters generated by the integrated SOM algorithm. We combine a zoomable interface with linked views to provide the foundation for a focus-plus-context design [11, 5, 10]. By integrating SOM, parallel coordinates and linked views, we wish to create a dynamic platform for exploratory analysis of large multivariate data. The remainder of this paper is organized as follows. Section 2 gives an introduction and description of the SOM algorithm. Section 3 gives a detailed description of our approach. Section 4 discusses the Visual User Interface (VUI) and the interaction techniques used. Our framework which integrates the techniques and concepts mentioned above, is discussed in Section 5. Finally, in Section 6, we give a conclusion and discuss our future research work.
2. Self-Organizing Map Algorithm The SOM algorithm [9, 18, 8] provides an effective mechanism for organizing unstructured data by extracting groups of similar data objects. A SOM can be described as a nonlinear projection from m-dimensional input space onto the two-dimensional display space. The mapping is topology preserving, i.e. it forms a locally correct projection while its distance mapping globally is a mere consequence of the local projection. The characteristics of SOM are useful in a wide variety of areas and it has become a popular artificial neural network algorithm. SOM is used as a standard analytical tool in, for example, statistics, signal processing, control theory, financial analysis, experimental Physics, Chemistry and Medicine. The SOM algorithm uses competitive learning to let its neurons adapt to the input so that they eventually specialize into sensing different input stimuli. The winning neuron is “rewarded” with becoming more like the input vector. If
Figure 2. 10,000 tuples with 16 data items are visualized using parallel coordinates. The visual clutter is high and no useful structure in the data can be seen.
order among the neurons is desired then not only the winning neuron but also its neighbours should learn from the input vector. How much a weight-vector, the vector consisting of values in all dimensions in the original space, of the neuron is adjusted depends on its closeness to the winning neuron.
3. Clustering in Parallel Coordinates An example molecular data set is used to illustrate our approach. The data set has 10000 tuples (rows) with 16 data items (columns). The raw data is visualized with standard parallel coordinates (figure 2). Since the data set is quite large, the amount of clutter is too large to perceive any trends or anomalies. We start by classifying the data into clusters using the SOM algorithm. For each cluster, the mean value in each dimension, j, is given by n
x ¯j =
1X xij , n i=1
(1)
where xij is the value in dimension j for tuple i and n is the size of the cluster. Besides the mean value, other measures such as the median or mode can be used as the metric. The band representing the cluster in the parallel coordinates chart is then displayed at the position of the mean value in each dimension. The width, d, of each band in pixels is then calculated so that n d= a, (2) nmax where a is a constant which is set to the maximum width allowed for a band by the software and nmax is the size of the maximum cluster. Obviously, the minimum width is one pixel. The band describing the largest cluster will consequently have the maximum width. This is an intuitive and fast way of presenting information about the size of each cluster relative all the others. The colours of the line segments can be used to further distinguish between the clusters (figure 3). See figure 6 for the final result. Since the
Figure 3. Variable width bands together with a colour map visually encode the information of a cluster.
number of clusters to be used strongly depends on the number of tuples in the data set, this can be changed at any time during the analysis and visualization process. The number of clusters, together with several other parameters concerning the SOM algorithm can be set through the user interface. For a thorough analysis it is important to present information about how well each cluster relates to the original tuples. This is done by calculating the intra-cluster error s Pm Pn 2 j=1 i=1 (xij − wj ) , e= (3) n which is a measure of how similar the original tuples, x, in a cluster of size n are to the clusters weight vector, w. Instead of the weight-vector, one of the measures described in section 3 could also be used. Normally, the average intra-cluster error is distributed such that many clusters have low values. The reason for this is that clusters in areas where few tuples have been assigned have had few possibilities to learn and consequently are relatively different to the original tuples that have been assigned to them. Tuples that belong to dense clusters on the other hand are spread out in areas containing many clusters due to the fact that neighbours learn in the SOM algorithm. These clusters have small errors because only tuples that are very similar will be associated in a cluster. The intra-cluster error gives an indication of how well the algorithm has managed to cluster the data and also about how tight or loose a cluster is. The weight vector can, if selected, be visualized together with the original tuples (figure 7).
4. Visual User Interface for Interactive Analysis
ulate the rendered objects in the visualization. A VUI complements the traditional graphical user interface (GUI) in order to give the user a more active role in the visualization process. By using a VUI a user is not forced to use buttons or sliders in order to interact with the visualization and this normally gives the user a sense of having more control. After the SOM algorithm has calculated satisfactory clusters, the VUI is used to perform drill-down and/or filtering to further investigate the data. Furthermore, the tight integration between VUI, SOM and visualization allows the user to control and steer the analysis process based on the given visual feedback. These techniques are described in detail in the following sections.
4.1. Drill-down in Linked Views SOM is a valid method for structuring data and identifying groups of similar data objects. However, for further analysis of those subsets e.g. revealing the original data items or determining object similarities within a cluster we use linked views together with cluster filtering. Linking multiple views so that changes made in one view are reflected in the other views lets the user focus on specific parts of the data set and see them within the context of other views. The user performs drill-down by clicking on a cluster band in the parallel coordinates view (figure 6). The original tuples associated with the selected cluster are then shown in a second linked parallel coordinates view (figure 7). The selected cluster is highlighted in red. By CTRL-clicking, drilldown can also be performed on several clusters simultaneously.
4.2. Cluster Filtering A filtering technique has been implemented to further reduce the clutter and facilitate the analysis of the clusters. Cluster filtering enables the user to filter the clusters according to the number of tuples within each cluster. For example, a user can choose to look at the largest or smallest clusters, or look at clusters in a specified sub-range. This is done by using a range scrollbar (figure 4) that has a minimum value, vmin , and maximum value, vmax , which lie in the range nmin (the size of the smallest clusters) to nmax (the size of the largest cluster). Moving the scrollbar changes the values vmin and vmax and the corresponding sub range is calculated. The parallel coordinates chart is immediately updated to reflect any changes.
4.3. Zooming and Translation Visual data mining focuses on a combination of visual and non-visual techniques as well as on integrating the user in the exploration process. An important feature in our application is the VUI which allows the user to directly manip-
Our implementation enables the user to zoom and pan the entire view but also to zoom in on a specific area by simply drawing a rectangle across the selected cluster bands.
Figure 4. A range scrollbar is used to perform cluster filtering.
Figure 8. Architecture and workflow.
5.2. Performance Figure 5. Using the rectangle zoom for a more detailed view.
The zoomed view is immediately updated (figure 5) and cluster details become visible.
5. Implementation The research in this paper is focused on the integration of a clustering technique, user interaction and standard visualization paradigms. We have selected a flexible framework which is scalable with respect to the characteristics of the data, the exploration tasks and user profiles. Our application is based on layered component architecture originally developed in the EC funded Smartdoc project, IST-2000-28137 [16]. To design and develop the user interface and interaction methods we have used Microsoft’s Visual Basic and low-level visualization components from OpenViz [14].
5.1. System Architecture and Workflow A description of the architecture and workflow of our application is shown in figure 8. The workflow begins with loading data from a file. The SOM algorithm calculates a cluster representation of the data which is visualized in parallel coordinates. The VUI interaction components provide filtering and drill-down techniques to interact with the visualization and clustering methods. The VUI allows the user at any time to go back and change parameters to further refine the visual representations.
Our interaction and visualization techniques (figure 8) work in real-time or near real-time and the only real bottleneck is the initial calculation of clusters with the SOM algorithm. The SOM algorithm has a time complexity of K 2 where K is the number of neurons, and each learning step requires O(K) computations [8]. Since the SOM operation is normally performed only once or twice during the overall process this short delay, typically measured in seconds, is acceptable.
6. Conclusions The concept of visualizing representations rather than the entire data set make the exploration of very large data sets possible. In this paper we have presented one novel technique based on algorithmic classification in linked views to enhance the display of large multivariate data sets in parallel coordinates. By tightly coupling the SOM with parallel coordinates we extend this visualization technique to clustered parallel coordinates. We represent clusters instead of data points. Variable width bands visually encode information about a cluster, where each band represents a single cluster. We also demonstrate the value of applying an “overview and detail” view in parallel coordinates. Our goal for interaction has been the development and assessment of tools for intuitive navigation and view modification within linked views. The advantage of using a visual user interface based on direct manipulation components tightly integrated with parallel coordinates has been demonstrated. This project is still under development and we find that there are still various aspects of our application that can
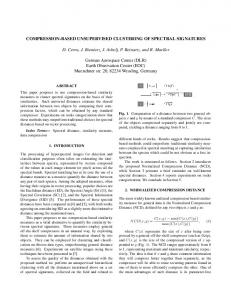
(a) 25 clusters
(c) 225 clusters
(b) 100 clusters
(d) 400 clusters
Figure 6. The molecular data set of 10,000 tuples with 16 data items as shown in figure 2 but now visualized as 25, 100, 255 and 400 clusters
Figure 7. Drill-down on the clusters reveals the original data elements and the weight vector. be improved. However, an extensive evaluation needs to be performed to confirm its usefulness. The application is currently being evaluated at the Unilever Research Port Sunlight Laboratory, UK. Their initial feedback has been that it is a promising technique which solves the difficulties they have previously experienced with parallel coordinates, particularly the initial visual clutter. We are currently investigating how to deal with the problem of handling non-numerical data. Like many clustering algorithms, SOM relies on concepts like distance, similarity and average. Because of this, the algorithm faces problems when the input data is based on representations, and data sets containing non-numerical data cannot be success-
fully used in the standard algorithm. This will be the subject of a forthcoming paper.
7. Acknowledgements We would like to thank Andreas Nilsson and Matt Cooper, Link¨oping University for important feedback during our work. This work is part of the VISIMOD project [19], supported by the Swedish Foundation for Strategic Research. It was also partly funded by the EC Commission IST-2000-28137.
References [1] M. Baldonado, A. Woodruff, and A. Kuchinsky. Guidelines for using multiple views in information visualizations. In AVI 2000, ACM Press, pages 110–119, 2000. [2] D. Brodbeck and L. Girardin. Design study: Using multiple coordinated views to analyze geo-referenced highdimensional datasets. In IEEE International Conference on Coordinated and Multiple Views in Exploratory Visualization, 2003. [3] A. Buja, J. McDonald, J. Michalak, and W. Stuetzle. Interactive data visualization using focusing and linking. In IEEE Visualization, pages 156–163, 1991. [4] Y.-H. Fua, M. O. Ward, and E. A. Rundensteiner. Hierarchical parallel coordinates for exploration of large datasets. In IEEE Visualization, pages 43–50, 1999. [5] M. Graham and J. Kennedy. Combining linking and focusing techniques for a multiple hierarchy visualization. In IEEE 5th International Conference on Information Visualization, pages 425–432, 2001. [6] T. Hastie, R. Tibshirani, and J. Friedman. The Elements of Statistical Learning. Springer, 2001. [7] A. Inselberg and B. Dimsdale. Parallel coordinates: A tool for visualizing multidimensional geometry. In IEEE Visualization, pages 361–378, 1990. [8] S. Kaski. Data exploration using self-organizing maps. PhD thesis, Helsinki University of Technology, 1997. [9] T. Kohonen. Self-Organizing Maps. Springer, second edition, 1997. [10] Y. Leung and M. Apperley. A review and taxonomy of distortion-oriented presentation techniques. In ACM Transactions on Human-Computer Interaction, pages 126–160, 1994. [11] J. D. Mackinlay, G. Robertson, and S. K. Card. The perspective wall: Detail and context smoothly integrated. In Conference on Human Factors in Computing Systems (CHI’95), pages 173–179, 1995. [12] S. Mukherjea, J. Foley, and S. Hudson. Visualizing complex hypermedia networks through multiple hierarchical views. In ACM SIGCHI Conference on Human Factors in Computing Systems, pages 331–337, 1995. [13] C. North and B. Shneiderman. Snap-together visualization: A user interface for coordinating visualizations via relational schemata. In AVI 2000, pages 128–135. [14] Openviz homepage. http://www.openviz.com/. [15] H. Siirtola. Direct manipulation of parallel coordinates. In IEEE 6th International Conference on Information Visualization, pages 373–378, 2002. [16] Smartdoc homepage. http://servus.itn.liu.se/smartdoc/. [17] A. Ultsch and C. Vetter. Self-organizing-feature-maps versus statistical clustering methods: A benchmark. Technical report, Department of Computer Science, University of Marburg, 1994.
[18] J. Vesanto and E. Alhoniemi. Clustering of self-organizing map. In IEEE Neural Networks, pages 586–600, 2000. [19] Visimod homepage. http://www.visimod.org. [20] P. C. Wong and D. Bergeron. Multiresolution multidimensional wavelet brushing. In IEEE Information Visualization, pages 141–148, 1996.