spoken conversations collected from a call center. Thus, the aim of this study is to ... We have analyzed acoustic and lexical features that discriminate individual ...
Unsupervised Recognition and Clustering of Speech Overlaps in Spoken Conversations Shammur Absar Chowdhury, Giuseppe Riccardi, Firoj Alam Department of Information Engineering and Computer Science, University of Trento, Italy {sachowdhury, riccardi, alam}@disi.unitn.it
Abstract We are interested in understanding speech overlaps and their function in human conversations. Previous studies on speech overlaps have relied on supervised methods, small corpora and controlled conversations. The characterization of overlaps based on timing, semantic and discourse function requires an analysis over a very large feature space. In this study, the corpus of overlapped speech segments was automatically extracted from human-human spoken conversations using a large vocabulary Automatic Speech Recognizer (ASR) and a turn segmenter. Each overlap instance is automatically projected onto a high dimensional space of acoustic and lexical features. Then, we used unsupervised clustering to find the distinct and well-separated clusters in terms of acoustic and lexical features. We have evaluated recognition and clustering algorithms over a large set of real human-human spoken conversations. The clusters have been comparatively evaluated in terms of feature distributions and their contribution to the automatic classification of the clusters. Index Terms: Overlapping Speech, Human Conversation, Discourse, Language understanding
1. Introduction Over the last forty years, the study of human-human conversations has attracted interest from researchers in the fields of sociology, computational linguistics and speech science. In the early seventies, Sacks et al. [1] studied human conversations and found that the transition from one speaker to another should occur with minimum overlap or gap, the two turn-taking signals. A recent study [2] suggests that the timing of turn taking with overlaps and silence is less precise. This study also states that overlap is in fact a frequent phenomenon and is much more than just a turn-taking signal. Overlaps represent a speaker’s behavior and intention in a regular conversation. Some overlaps indicate support for the current speaker to continue speaking while others are intended to break the flow of the conversation or to compete for turns [3]. The former class of overlaps is referred to as noncompetitive and the latter, competitive. Most previous studies have been conducted on controlled meeting corpora [4]. However, in this study, we focus on spoken conversations collected from a call center. Thus, the aim of this study is to analyze the natural distinctive statistical patterns that describe overlaps using unsupervised techniques. We have analyzed acoustic and lexical features that discriminate individual clusters and compared them with the characteristics of features mentioned in previous literature on distinguishing overlaps. In contrast with that of previous studies, the contribution of this study differs in a number of ways: • Designing the corpus of speech overlaps using an automated approach.
• Extraction of a large set of acoustic and lexical features. • Investigation of speech overlaps using unsupervised clustering. • Analysis of discriminative characteristics of speech overlaps over acoustic and lexical features. This paper is organized as follows. An overview of previous studies of overlaps is given in Section 2, followed by a description of data preparation procedures in Section 3. In Section 4, we discuss the experimental methodology used in this study. We present an analysis of our findings in Section 5 and provide conclusions in Section 6.
2. Related Work Speech overlaps have been categorized in terms of speakers’ (non) competitiveness. Different verbal and non-verbal predictors have been proposed to indicate willingness to compete. According to [5], position of the overlap onset is an important feature along with some temporal features related to the position of overlaps. In [6], it is mentioned that speech rate, cut-offs and repetition are also important features used by speakers in competitive overlaps. In [3], authors observed that precise location does not describe a competitive overlap but the phonetic design plays the role. Later studies in [8, 9] supported this hypothesis. In [9], authors also stated that competitive overlaps are usually high in pitch and amplitude to grab the attention from the current speaker. Classification of competitive and non-competitive overlaps was studied in [10] using decision tree and they found that duration is the most distinguishing feature. The findings in [4,7] suggest that f0 is the most common feature and is being higher in competitive overlaps.
3. Data In this study, we have analyzed a corpus collected from a call center, which contains inbound Italian phone conversations between agents and customers. Each conversation was recorded over two channels at a sample rate of 8 kHz, 16bit speech samples and has an average duration of 395 seconds. We selected 515 conversations based on maximum duration of the overlapped segments. The overlapped segments were detected using start and end time of each speaker’s turn and for each word unit within that turn. To get each speaker’s turns we passed the conversation to an automatic turn segmenter [11] followed by a large vocabulary Italian ASR to get automatic transcription from the corresponding turns. Then, we detected overlapping turns, where each turn has an alignment between the automated word level transcriptions and the speech recording. Using the overlapping turns, we also extracted words that are overlapped within the turns. Then, we extracted the speech signal from our overlapping speech instances using the start time of the first word in the overlap to the end time of the last word. Therefore, the overlap segment has two channels per
conversation. Following this approach, we have extracted 25132 instances of overlaps (average duration of 0.52s) from 515 conversations, where the duration of overlap is 3 hours and 38 minutes and total the duration of speaking time is 41 hours and 52 minutes. In the process of detecting overlapping segments, our approach differs from previous study [29], where they designed a classifier to detect speech overlap. The ASR system was designed using a subset of the data, with around 100 hours of conversations, and a lexicon of size ~18K. The training data of the ASR was completely independent from the data set that was used in the study. The MFCC features were spliced, taking 3 frames from each side of the current frame, followed by Linear Discriminant analysis (LDA) and Maximum Likelihood Linear Transform (MLLT) feature-space transformations to reduce the feature space. For obtaining the best acoustic model using Kaldi [12], we used speaker adaptive training (SAT) followed by Maximum Mutual Information (MMI) training. The Word Error Rate (WER) for our ASR system is 31.78% on the test set split using a tri-gram language model. The perplexity of the language model is 87.69.
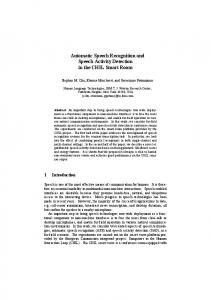
4. Methodology The workflow of clustering and feature analysis is shown in Figure 1. The overlap segment’s components are shown for each channel. We extracted acoustic and lexical features from both channels. We then merged the acoustic features from each channel to create a combined acoustic feature vector. We then followed the same procedure to create a combined lexical feature vector by merging the lexical features of each channel. In addition, we investigated the relevance of the combination of the new acoustic and lexical features. We designed three feature set combinations: acoustic only, lexical only and acoustic merged with lexical features. For each feature set, we performed cluster evaluation and analyzed the features based on the clustered output using feature ranking. Finally, we studied whether there was loss of any information due to the reduction of the feature dimension.
These low-level features were extracted with approximately 100 frames per second, with 25 milliseconds per frame. The 39 low-level features include frame energy, loudness, mel-frequency cepstral coefficients (MFCC1-12), voice quality, fundamental frequency (f0), exponentially smoothed f0-envelope, jitter-local, differential of jitter, shimmer-local, logarithmic harmonics-to-noise ratio (HNR) computed from auto-correlation, zero crossing rate of time signal, formant frequencies (f0-f3) and spectral features with different bands (0-250Hz, 0-650Hz, 250-650Hz, 1-4kHz), rolloff points (25%, 50%, 70%, 90%), centroid, flux, maxposition and min-position. Delta and acceleration coefficients of these features have also been extracted. These low-level acoustic features were then projected onto 24 statistical functionals, which included range, absolute position of max and min, linear and quadratic regression coefficients and their corresponding approximation errors, moments-centroid, variance, standard deviation, skewness, kurtosis, zero crossing rate, peaks, mean peak distance, mean peak, geometric mean of non-zero values, and number of non-zeros. As mentioned earlier, the overlap segment’s components appear in two channels. Therefore, we extracted the same number of features from each channel. The size of the feature vector in a single channel is computed as: (39 + ∆39 + ∆∆39) LLD × 24 functionals = 2808. A total of 5616 features were obtained after merging the feature vectors from both channels.
4.1.2. Lexical features Lexical features were extracted from automatic transcription using the ASR explained in Section 3. The lexical features were transformed into a bag-of-words (vector space model) [16]. The idea of this approach is to represent the words into numeric features. For this study, we extracted bigram features and selected the top 2000 frequent features to reduce features dimension. The frequencies in the feature vector were then transformed into tf-idf values – the product of the logarithmic term frequency (tf) and inverse document frequency (idf).
4.1.3. Feature Combination Although feature combination has been widely used in other speech processing tasks, its relative contribution greatly varies depending on the data and experiments. For this study, we also analyzed the contribution of feature combination. As shown in Figure 1, after extracting acoustic and lexical features we merged the feature vectors into a single vector and then used that for clustering.
4.1.4. Dimensionality Reduction
Figure 1: The overlap classification system. *-Trans: channel’s transcription
4.1. Features 4.1.1. Acoustic features We extracted a large number of acoustic features, motivated by their successful utilization in the paralinguistic task discussed in [13, 14]. The process extracts a large number of Low-Level Descriptors (LLD) and then projects them onto statistical functionals using openSMILE [15].
Since the complexity of any pattern recognition algorithm also depends on the number of features, we reduced the feature space to limit the complexity and number of free parameters. A typical approach for feature reduction is to map higher dimensional feature spaces into lower dimensional spaces, while maintaining as much of the information as possible. In our study, we have used Principal Component Analysis (PCA), which is one of the fundamental feature reduction methods. After transforming the feature space using PCA, the usual approach is to take the leading p components that explain the data with 95% variance [17]. However, as a baseline study we took the leading p components with 99% variance. The value of p varies for different features sets. Hence, we reduced 63% acoustic, 11% lexical and 59%
acoustic+lexical features. The reason for obtaining a minimal reduction with lexical features is the weak correlation with feature dimensions and sparseness.
4.2. Clustering To find well-separated clusters of speech overlaps in our dataset, we used K-means [18] where data points are classified as belonging to one of K groups. For reproducibility and transferability, we used Weka’s implementation [19]. Members of the clusters are determined by comparing the data point with each group’s centroid and assigning it to the nearest one. The reason for choosing K-means is that it is highly recommended for large datasets [20, 21] and is one of the simplest methods. However, one of main limitations of Kmeans is in choosing the value of K in prior. Therefore, we used cascaded K-means, which uses Calinski-Harabasz [22] criterion to determine the best value of K that represents the dataset. For each value of K, cascaded K-means calculates the between-group dispersion, BGSS, within-cluster sum of squares, WGSS, and Calinski-Harabasz (CH) value or index, using Equations [1-3]. !!"" = !"## = !!!!!!" =
! !!! !! ! !!!
! {!} −!
!∈!!
!!! ∗!"## !!! ∗!"##
!!
!
!
−!!
(1) !
!
(2) (3)
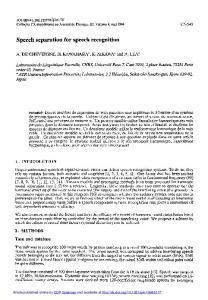
K is the number of clusters, N is number of observations, G{k} is the barycenter of cluster Ck, G is the barycenter of the entire dataset, nk is the number of elements in the Ck. Ik is the set of the indices of the observations belonging to Ck, and Mi is the ith observation of element in Ck. Figure 2 shows the values of CH corresponding to the number of clusters K. The results of our experiments are shown in Table 1. The optimal number of K using acoustic and acoustic+lexical feature sets is 2, as can be seen in Figure 2. The clustering difference between the two feature sets is minimal. The optimal number for k, which we obtained using lexical features, is 4. The CH value for the cluster is significantly smaller compared to the CH values with acoustic features. The minimal separability of lexical features could be due to the sparseness and recognition error of the ASR. We applied PCA feature reduction method to the acoustic and acoustic+lexical feature sets and with reduced dimensions we obtained 2 clusters for each set. We then calculated the cluster agreement between the feature sets using kappa (κ) statistics [23]. We found that the agreement between the original and reduced dimensions is fairly reasonable. The agreements for the acoustic and acoustic+lexical feature sets are 92% and 91%, respectively. This indicates that feature reduction is important in reducing computational cost with minimal loss of information. To check the validity of the clusters using cascaded Kmeans, we used another well-known clustering algorithm – Spectral Clustering [24, 25]. Using this algorithm, we also found 2 clusters. Then, we compared the clusters generated by these two clustering algorithms for acoustic and acoustic+lexical feature sets using κ measure. The agreements between the two algorithms on acoustic and acoustic+lexical feature sets are 90% and 87%, respectively. Detailed results of Spectral Clustering algorithm have not been included in this paper, in favor of brevity.
Figure 2: Calinski-Harabasz (CH) value for cluster decision Feature Set Acoustic Lexical Acoustic +Lexical Acoustic + lexical with PCA
K 2 4 2 2
CH W B 3681.12 42.31 155749.22 232.66 1.38 320.04 3568.28 43.71 155985.56 2754.82 21.28 58631.95
Table 1: Cluster evaluation using different feature sets: K number of cluster, CH - Calinski-Harabasz value, W – weighted within-cluster sum of squares, B – between group dispersion
5. Analysis and Discussions We analyzed different features based on the cluster decision of acoustic features, where cluster 0 (C0) and cluster 1 (C1) contain 37% and 63% of overlapping instances, respectively. The members of the clusters were analyzed using duration distribution of speech overlaps and top-ranked acoustic features. Based on this cluster decision, we extracted and analyzed lexical features. In doing so, we compared our observations with those of previous studies to determine whether our clusters resembled competitive or noncompetitive overlaps.
5.1. Duration Distribution Figure 3 shows the distribution of overlap durations for C0 and C1. It can be seen that C1 contains instances of overlaps with short durations whereas C0 has instances with comparatively long durations. The authors in [10] and [26] state that non-competitive overlaps tend to be shorter and resolved soon after the second speaker has recognized the overlap, whereas competitive overlaps are persistent because speakers keep on speaking despite overlapping. Therefore, it can be inferred that competitive overlaps have longer durations than non-competitive overlaps. With duration a key distinguishing feature, we observed that there is clear distinction between C0 and C1. We also observed that the median duration distribution of C1 is very close to the minimum distribution of C0. The minimum, median, third quartile and maximum durations, in milliseconds, of the clusters are C0 - {300, 740, 950, 3590} and C1 - {40, 330, 430, 850}, in that respect. The vertical lines in the figure indicate the median of the respective distributions.
5.2. Acoustic and Lexical Feature Analysis For the analysis of acoustic features we used Relief feature selection technique [27] to rank the features, which has been useful in paralinguistic task [28]. It calculates the weight of the
features based on the nearest instances of the same and different classes. The top-ranked low-level acoustic features include logarithmic Harmonic to Noise Ratio (logHNR), f0 envelope, shimmer-local, jitter-local, and spectral features, with their delta and acceleration coefficients, whereas the statistical functionals include range, standard deviation, mean of peak, linear regression with error coefficients, and centroid. Figure 4 shows some of the top-ranked low-level features projected on statistical functionals as described in Table 2. From the figure, it can be seen how the two clusters differ in their distributions – the mean values for C1 are always lower than those for C0.
homogenous lexicon, as demonstrated by the long tail of C0 in Figure 5. Feat. F1 F2 F3 F4 F5 F6 F7 F8 F9 F10 F11 F12
Description Logarithmic harmonic to noise (logHNR) ratio with delta coefficient projected to statistical range logHNR projected to statistical range logHNR with delta coefficient projected to statistical mean of peak logHNR projected to statistical standard deviation logHNR with linear error computed as the difference of the linear approximation and the actual contour f0 envelope projected to statistical mean of peak Local shimmer with centroid Local jitter with centroid f0 envelope projected to geometric mean of non-zero values First formant with number of non-zero values Loudness with number of non-zero values log energy with delta coefficient projected to non-zero values
Table 2: Acoustic features and their description
Figure 3: Overlap duration distribution of the two clusters
Figure 5: Zipf’s plot with bigrams for C0 and C1 clusters. Frequency is plotted as a function of frequency rank.
6. Conclusion Figure 4: Selected acoustic features (F1-12) and their zscore distribution in C0 and C1. Box-plots, representing the mean, max, upper and lower inner fences of top ranked features. Outliers have been removed for readability. Some of the voice quality features show significant difference in their distribution between two clusters. This indicates that these features play an important role in detailing the patterns in each cluster. logHNR is a feature which is widely used to analyze disorders such as hoarseness and depression. However, we observed that this feature has not been applied before to the analysis of overlaps. Other commonly used features for categorizing overlaps are f0, loudness and energy. By observing the values of F10 in Figure 4, it can be inferred that the mean value of C0 is higher than that of C1. This inference is extended to apply to the values of F11 as well. This, coupled with observations from previous research, provides the grounds for the conclusion that our C0 exhibits patterns similar to competitive overlaps. By studying the most frequent lexical features, it can be noted that filler and affirmative words are present in both clusters but that C1 has higher frequencies than C0 has. For example, the token “sì/yes” is present in C1 with a frequency of 2506, three times as much as that of the same token in C0. It can also be noted that, in comparison with C0, C1 has a
In this study, we designed an automatic system that divides speech overlaps into two classes using unsupervised approach. We prepared our data with an automated manner, by cascading a turn segmenter and an ASR system. For clustering, we extracted a large number of acoustic features from overlapped segments, and lexical features from automatic transcriptions. Our findings suggest that acoustic features play a more important role than lexical features in discovering wellseparated clusters. Voice quality features, especially logHNR, jitter and shimmer, are the most discriminative in clustering overlaps. Based on previous work and from our analysis, we found that instances of C0 have a higher chance of being competitive overlaps, while instances of C1 are more likely to be of non-competitive nature. Our observation of lexical features, which are obtained from the clustering decision of acoustic features, is that the frequencies of filler and affirmative words are higher in C1 than the frequencies of such words in C0. These features may help in supervised classification, which we will investigate further. Future study includes manual annotation and studying contextual features as well as understanding the roles of acoustic and lexical features.
7. Acknowledgements The research leading to these results has received funding from the European Union - Seventh Framework Programme (FP7/2007-2013) under grant agreement n° 610916- SENSEI.
8. References [1] [2] [3] [4] [5] [6] [7] [8] [9] [10]
[11] [12]
[13] [14]
[15]
[16] [17] [18]
[19] [20] [21] [22] [23]
H. Sacks, E. A. Schegloff, and G. Jefferson, “A simplest systematics for the organization of turn-taking for conversation”, Language, 50(4): 696–735, 1974. Heldner, M., & Edlund, J. “Pauses, gaps and overlaps in conversations.” Journal of Phonetics, 38(4), 555-568, 2010. French, P., Local, J., “Turn-competitive incomings”, J. Pragmatics 7, 701–715, 1983. Kurtić, E., Brown, G. J., & Wells, B, “Resources for turn competition in overlapping talk”, Speech Communication, 55(5), 721-743, 2013. Jefferson, Gail., “Two explorations of the organization of overlapping talk in conversation”, Tilburg University, Department of Language and Literature, 1982. Schegloff, E., “Overlapping talk and the organisation of turntaking for conversation”, Lang. Soc. 29, 1–63, 2000. K. P. Truong, “Classification of cooperative and competitive overlaps in speech using cues from the context, overlapper, and overlappee,” in Proceedings of Interspeech, 2013. Wells, B., McFarlane, S., “Prosody as an interactional resource: Turn-projection and overlap”, Lang. Speech 41, 265–294, 1998. Hammarberg, B., Fritzell, B., Gaufin, J., Sundberg, J., & Wedin, L., “Perceptual and acoustic correlates of abnormal voice qualities”, Acta otolaryngologica, 90(1-6), 441-451, 1980. Kurtic ́, E., Brown, G.J., Wells, B., “Resources for turn competition in overlap in multi-party conversations: Speech rate, pausing and duration”, Proc. Interspeech 2010. Makuhari, Japan, 2010. Ivanov, A. V., & Riccardi, G, “Automatic turn segmentation in spoken conversations”, In Interspeech 2010, pp. 3130-3133, 2010. Daniel Povey, Arnab Ghoshal, Gilles Boulianne, Lukas Burget, Ondrej Glembek, Nagendra Goel, Mirko Hannemann, Petr Motlicek, Yanmin Qian, Petr Schwarz, Jan Silovsky, Georg Stemmer, Karel Vesely, “The Kaldi speech recognition toolkit”, Proc. ASRU, 1-4, 2011. B. Schuller, “Voice and speech analysis in search of states and traits,” in Computer Analysis of Human Behavior. Springer, pp. 227–253, 2011. B. Schuller, A. Batliner, S. Steidl, and D. Seppi, “Recognising realistic emotions and affect in speech: State of the art and lessons learnt from the first challenge”, Speech Communication, vol. 53, no. 9, pp. 1062–1087, 2011. F. Eyben, F. Weninger, F. Gross, and B. Schuller, “Recent developments in openSMILE, the munich open-source multimedia feature extractor,” in Proceedings of the 21st ACM international conference on Multimedia. ACM, pp. 835–838, 2013. T. Joachims, Text categorization with support vector machines: Learning with many relevant features. Springer, 1998. Alpaydin, Ethem, “Introduction to machine learning”, MIT press, 2004. Arthur, David and Vassilvitskii, Sergei, “k-means++: The advantages of careful seeding”, Proceedings of the eighteenth annual ACM-SIAM symposium on Discrete algorithms, pp. 1027-1035, 2007. I.H. Witten and E. Frank, “Data Mining: Practical machine learning tools and techniques”, Morgan Kaufmann, 2005. Huang, Zhexue, “Extensions to the k-means algorithm for clustering large data sets with categorical values”, Data Mining and Knowledge Discovery 2.3, pp. 283-304, 1998. Abbas, O. A., “Comparisons Between Data Clustering Algorithms”, International Arab Journal of Information Technology (IAJIT), 5(3), 2008. T. Calinski, J. Harabasz, “A dendrite method for cluster analysis”, Communications in Statistics-theory and Methods, vol. 3, no.1, pp. 1-27,1974. Donner, Allan, and Neil Klar. "The statistical analysis of kappa statistics in multiple samples", Journal of clinical epidemiology, vol. 49, no.9, 1053-1058, 1996.
[24] L. Zelnik-Manor and P. Perona, “Self-Tuning Spectral Clustering”, Advances in Neural Information Processing Systems 17, pp. 1601-1608, 2005, (NIPS'04). [25] Von Luxburg, Ulrike, “A tutorial on spectral clustering”, Statistics and computing, Springer, Vol-17, Number-4, pp. 395416, 2007. [26] Jefferson, G., “A sketch of some orderly aspects of overlap in natural conversation”, PRAGMATICS AND BEYOND NEW SERIES, 125, 43-62, 2004. [27] Igor Kononenko, “Estimating Attributes: Analysis and Extensions of RELIEF”, In European Conference on Machine Learning, 171-182, 1994. [28] Alam, F., Riccardi, G. 2013. “Comparative Study of Speaker Personality Traits Recognition in Conversational and Broadcast News Speech”, Proceedings of Interspeech-2013 [29] Boakye, Kofi, et al. "Overlapped speech detection for improved speaker diarization in multiparty meetings." Acoustics, Speech and Signal Processing, 2008. ICASSP 2008. IEEE International Conference on. IEEE, 2008.